. 2023 Nov 5;15(11):2590.
doi: 10.3390/pharmaceutics15112590.

Targeting 7KCh-Induced Cell Death Response Mediated by p38, P2X7 and GSDME in Retinal Pigment Epithelium Cells with Sterculic Acid

Affiliations

Targeting 7KCh-Induced Cell Death Response Mediated by p38, P2X7 and GSDME in Retinal Pigment Epithelium Cells with Sterculic Acid

Ana Pariente et al. Pharmaceutics. .

Abstract

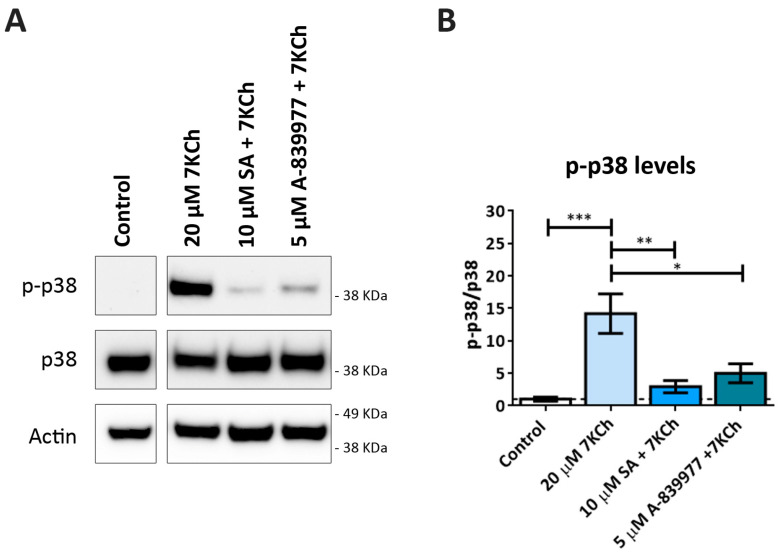
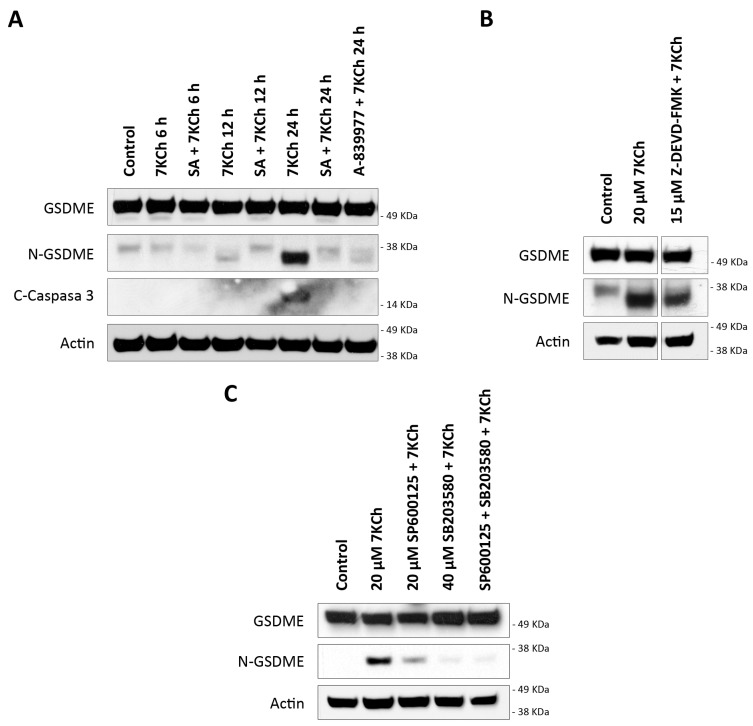
Age-related macular degeneration (AMD) is the main cause of blindness in developed countries. AMD is characterized by the formation of drusen, which are lipidic deposits, between retinal pigment epithelium (RPE) and the choroid. One of the main molecules accumulated in drusen is 7-Ketocholesterol (7KCh), an oxidized-cholesterol derivative. It is known that 7KCh induces inflammatory and cytotoxic responses in different cell types and the study of its mechanism of action is interesting in order to understand the development of AMD. Sterculic acid (SA) counteracts 7KCh response in RPE cells and could represent an alternative to improve currently used AMD treatments, which are not efficient enough. In the present study, we determine that 7KCh induces a complex cell death signaling characterized by the activation of necrosis and an alternative pyroptosis mediated by P2X7, p38 and GSDME, a new mechanism not yet related to the response to 7KCh until now. On the other hand, SA treatment can successfully attenuate the activation of both necrosis and pyroptosis, highlighting its therapeutic potential for the treatment of AMD.

Keywords: 7-ketocholesterol; AMD; GSDME; P2X7; cell death; retina; sterculic acid.


Conflict of interest statement

I.M.L. holds a patent on “Methods of treatment using sterculic acid”. The funders had no role in the design of the study; in the collection, analyses, or interpretation of data; in the writing of the manuscript, or in the decision to publish the results.

Figures

Figure 1
Figure 1
Chemical structure of sterculic acid (image obtained from Pubchem, https://pubchem.ncbi.nlm.nih.gov/compound/Sterculic-acid#section=2D-Structure, accessed on 26 October 2023, CID: 12921).
Figure 2
Figure 2
Cell toxicity induced by 7KCh and protective effect exerted by SA in mRPE cells. Cell viability was determined by MTS assay in mRPE cells treated with 15–20 μM 7KCh and 10 μM SA for 24 h. Data are expressed over the control and presented as a mean ± SEM of at least three different experiments. The dashed line is a guidance mark of the control value. The ANOVA test was used for statistical analysis, followed by the Sidak post hoc test. *** p < 0.001; **** p < 0.0001.
Figure 3
Figure 3
Participation of apoptosis in the toxic response induced by 7KCh in retinal cells. (A) Cell viability was determined by MTS assay in mRPE cells treated with 15 μM 7KCh and 5–25 μM Z-DEVD-FMK for 24 h. (B) Cell viability was determined by MTS assay in mRPE cells treated with 15 μM 7KCh and 1–10 μg/mL CHX for 24 h. (C) DNA laddering was detected by electrophoresis in mRPE cells treated with 15–20 μM 7KCh and 10 μM SA for 24 h. CHX and Z-DEVD-FMK were added with pretreatment for 2 h with respect to 7KCh. M.W., molecular weight. Data are expressed over the control and represented as mean ± SEM of at least three different experiments. The dashed line is a guidance mark of the control value. The ANOVA test was used for statistical analysis, followed by the Sidak post hoc test. ** p < 0.01; *** p < 0.001.
Figure 4
Figure 4
7KCh-induced necrosis in mRPE cells. (A) Representative images obtained in vivo by confocal microscopy in the control and 7KCh-exposed mRPE cells for 24 h stained with Hoechst (blue) and propidium iodide (IP, red). White arrow indicates an example of necrotic core. (B) Quantification of the percentage of nuclei stained with propidium iodide. Data expressed as the mean ± SEM of seven independent fields. (C) Cell viability determined by MTS assay in mRPE cells trated with 15 μM 7KCh and 3–10 μM Nec-1 or (D) 0.5–2 μM NSA. Data are expressed over the control and represented as mean ± SEM of at least three different experiments. Dashed line is a guidance mark of the control value. The ANOVA test was used for statistical analysis, followed by the Sidak post hoc test. * p < 0.05; ** p < 0.01; *** p < 0.001; **** p < 0.0001.
Figure 5
Figure 5
Effect of P2X7 inhibition on 7KCh-induced cell death. (A) Cell viability was determined by MTS assay in mRPE cells treated with 15–20 μM 7KCh and 5 μM A-839977 for 24 h. (B) Cell viability was determined by MTS assay in mRPE cells treated with 15 μM 7KCh and 25–75 μM CBX. Data are expressed over the control and represented as mean ± SEM of at least three different experiments. The dashed line is a guidance mark of the control value. The ANOVA test was used for statistical analysis, followed by the Sidak post hoc test. * p < 0.05; ** p < 0.01; **** p < 0.0001.
Figure 6
Figure 6
Involvement of the P2X7 receptor in 7KCh-induced toxicity in mRPE cells stained with propidium iodide (red) and YO-PRO 1 (green). (A) Representative images obtained in vivo in brightfield and fluorescence of mRPE cells treated with 15 μM 7KCh and/or 5 μM A-839977 for 24 h using Incucyte® equipment. Merge (yellow) represents the combination of propidium iodide and YO-PRO1 fluorescence. (B) Percentage of cells stained with propidium iodide (IP), YO-PRO1 and both fluorochromes (merge) at 6 h, 12 h and 24 h of treatment with respect to the total cell number quantified in brightfield. Data are expressed as the mean ± SEM of four independent fields. The ANOVA test was used for statistical analysis, followed by Tukey’s post hoc test. * p < 0.05; ** p < 0.01; *** p < 0.001; **** p < 0.0001.
Figure 7
Figure 7
SA attenuation of necrosis and P2X7 activation induced in response to 7KCh in mRPE cells stained with propidium iodide (red) and YO-PRO1 (green). (A) Representative images obtained in vivo in brightfield and fluorescence of mRPE cells treated with 15 μM 7KCh and/or 10 μM SA for 24 h using Incucyte® equipment. Merge (yellow) represents the combination of propidium iodide and YO-PRO1 fluorescence. (B) Percentage of cells stained with propidium iodide (IP), YO-PRO1 and both fluorochromes (merge) at 6 h, 12 h and 24 h of treatment with respect to the total cell number quantified in brightfield. Data are expressed as the mean ± SEM of four independent fields. The ANOVA test was used for statistical analysis, followed by Tukey’s post hoc test. * p < 0.05; ** p < 0.01; *** p < 0.001; **** p < 0.0001.
Figure 8
Figure 8
Effect of P2X7 inhibition on 7KCh-induced p38 phosphorylation. (A) Western blot estimation of phosphorylated p38 (p-p38) levels in mRPE cells exposed to 20 μM 7KCh alone or in combination with 10 μM SA or 5 μM A-839977 for 24 h. (B) Quantification of p-p38 levels over p38 levels. Data are represented as mean ± SEM of three different experiments. The dashed line is a guidance mark of the control value. The ANOVA test was used for statistical analysis, followed by Tukey’s post hoc test. * p < 0.05; ** p < 0.01; *** p < 0.001.
Figure 9
Figure 9
Classic pyroptosis in the cytotoxic response induced by 7KCh in mRPE cells. (A) Quantification of RT-qPCR of CASP1, GSDMD, IL1B and IL18 expression levels in mRPE cells treated with 15 μM 7KCh for 24 h, normalized with respect to 18S expression. (B) Western blot detection of GSDMD in mRPE cells exposed to 12–20 μM 7KCh. Statistical analysis in (A) was carried out using Student’s t-test. Data are expressed over the control and represented as mean ± SEM of at least three different experiments. The dashed line is a guidance mark of the control value. * p < 0.05; ** p < 0.01.
Figure 10
Figure 10
GSDME activation in mRPE cells exposed to 7KCh. (A) Western blot detection of GSDME cleavage (N-GSDME) and Caspase 3 cleavage (C-Caspase 3) in mRPE cells treated with 20 μM 7KCh alone or in combination with 10 μM SA at 6–24 h, and in combination with 5 μM A-839977 at 24 h. (B) Western blot detection of N-GSDME in mRPE cells treated with 20 μM 7KCh alone or in combination with 15 μM Z-DEVD-FMK for 24 h. (C) Western blot detection of N-GSDME in mRPE cells treated with 20 μM 7KCh alone or with 20 μM SP600125 and/or 40 μM SB203580 for 24 h. SP600125 and SB203580 were added with pretreatment for 2 h with respect to 7KCh.

Similar articles

Cited by

References

    1. Deng Y., Qiao L., Du M., Qu C., Wan L., Li J., Huang L. Age-related macular degeneration: Epidemiology, genetics, pathophysiology, diagnosis, and targeted therapy. Genes Dis. 2022;9:62–79. doi: 10.1016/j.gendis.2021.02.009. - DOI - PMC - PubMed
    1. Mehrzadi S., Hemati K., Reiter R.J., Hosseinzadeh A. Mitochondrial dysfunction in age-related macular degeneration: Melatonin as a potential treatment. Expert Opin. Ther. Targets. 2020;24:359–378. doi: 10.1080/14728222.2020.1737015. - DOI - PubMed
    1. Taylor A. Introduction to the issue regarding research regarding age related macular degeneration. Mol. Asp. Med. 2012;33:291–294. doi: 10.1016/j.mam.2012.04.002. - DOI - PMC - PubMed
    1. Xu Q., Cao S., Rajapakse S., Matsubara J.A. Understanding AMD by analogy: Systematic review of lipid-related common pathogenic mechanisms in AMD, AD, AS and GN. Lipids Health Dis. 2018;17:3. doi: 10.1186/s12944-017-0647-7. - DOI - PMC - PubMed
    1. Stahl A. The Diagnosis and Treatment of Age-Related Macular Degeneration. Dtsch. Arztebl. Int. 2020;117:513–520. doi: 10.3238/arztebl.2020.0513. - DOI - PMC - PubMed

LinkOut - more resources