

Effects of Maize-Crop Rotation on Soil Physicochemical Properties, Enzyme Activities, Microbial Biomass and Microbial Community Structure in Southwest China
- PMID: 38004632
- PMCID: PMC10672910
- DOI: 10.3390/microorganisms11112621
Effects of Maize-Crop Rotation on Soil Physicochemical Properties, Enzyme Activities, Microbial Biomass and Microbial Community Structure in Southwest China
Abstract
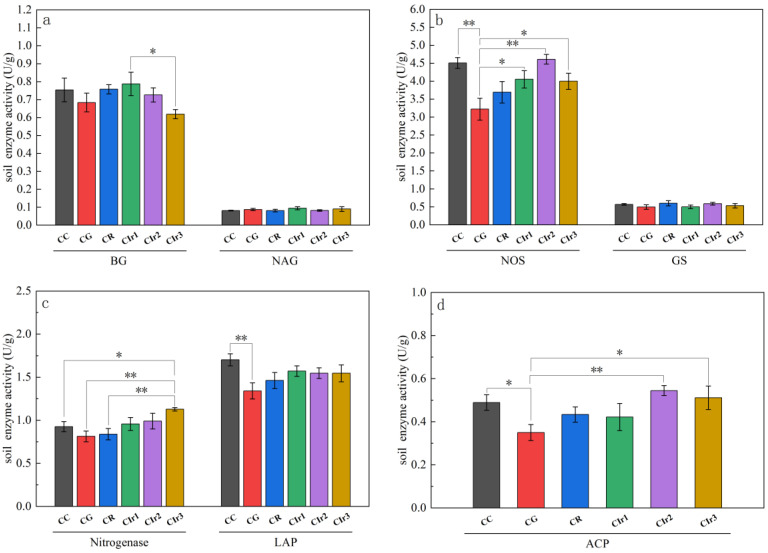
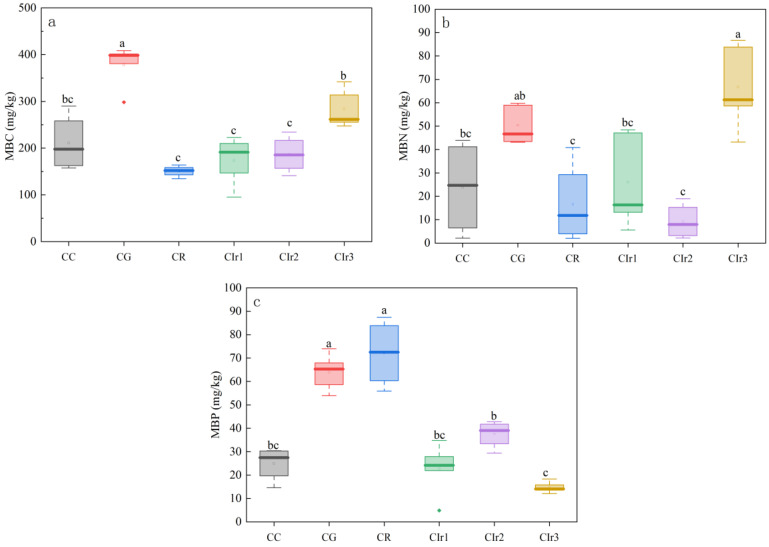
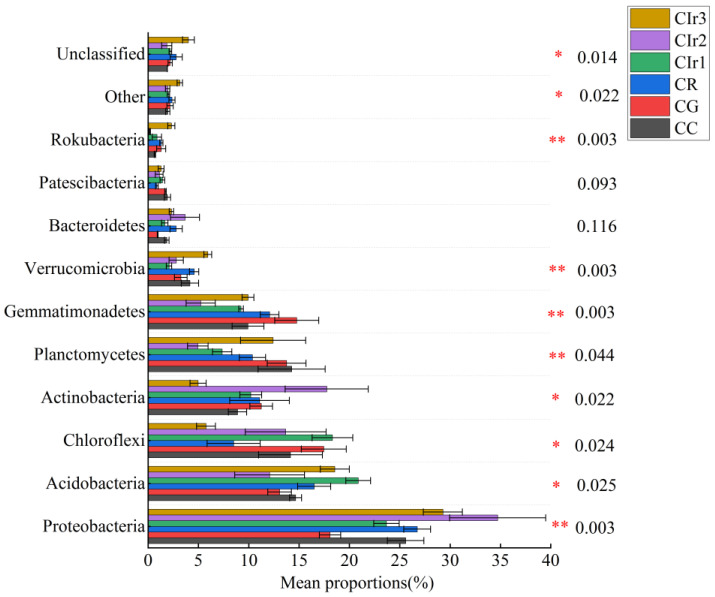
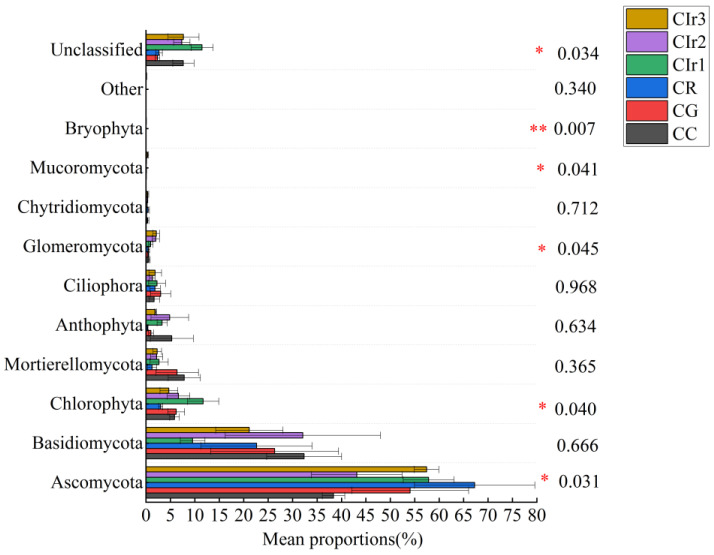
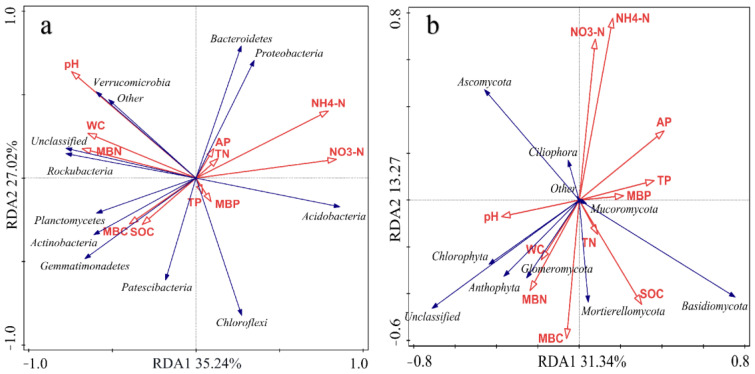
Introducing cover crops into maize rotation systems is widely practiced to increase crop productivity and achieve sustainable agricultural development, yet the potential for crop rotational diversity to contribute to environmental benefits in soils remains uncertain. Here, we investigated the effects of different crop rotation patterns on the physicochemical properties, enzyme activities, microbial biomass and microbial communities in soils from field experiments. Crop rotation patterns included (i) pure maize monoculture (CC), (ii) maize-garlic (CG), (iii) maize-rape (CR) and (iv) maize-annual ryegrass for one year (Cir1), two years (Cir2) and three years (Cir3). Our results showed that soil physicochemical properties varied in all rotation patterns, with higher total and available phosphorus concentrations in CG and CR and lower soil organic carbon and total nitrogen concentrations in the maize-ryegrass rotations compared to CC. Specifically, soil fertility was ranked as CG > Cir2 > CR > Cir3 > CC > Cir1. CG decreased enzyme activities but enhanced microbial biomass. Cir2 decreased carbon (C) and nitrogen (N) acquiring enzyme activities and soil microbial C and N concentrations, but increased phosphorus (P) acquiring enzyme activities and microbial biomass P concentrations compared to CC. Soil bacterial and fungal diversity (Shannon index) were lower in CG and Cir2 compared to CC, while the richness (Chao1 index) was lower in CG, CR, Cir1 and Cir2. Most maize rotations notably augmented the relative abundance of soil bacteria, including Chloroflexi, Gemmatimonadetes and Rokubacteria, while not necessarily decreasing the abundance of soil fungi like Basidiomycota, Mortierellomycota and Anthophyta. Redundancy analysis indicated that nitrate-N, ammonium-N and microbial biomass N concentrations had a large impact on soil bacterial communities, whereas nitrate-N and ammonium-N, available P, soil organic C and microbial biomass C concentrations had a greater effect on soil fungal communities. In conclusion, maize rotations with garlic, rape and ryegrass distinctly modify soil properties and microbial compositions. Thus, we advocate for garlic and annual ryegrass as maize cover crops and recommend a two-year rotation for perennial ryegrass in Southwest China.
Keywords: enzyme activity; microbial biomass; microbial communities; physicochemical properties; rotation patterns.
Conflict of interest statement
The authors declare that the research was conducted in the absence of any commercial or financial relationships that could be construed as a potential conflict of interest.
Figures
Similar articles
-
[Response of Soil Fungal Communities in Diversified Rotations of Wheat and Different Crops].Huan Jing Ke Xue. 2022 Jun 8;43(6):3338-3347. doi: 10.13227/j.hjkx.202109069. Huan Jing Ke Xue. 2022. PMID: 35686804 Chinese.
-
Diversified crop rotations improve soil microbial communities and functions in a six-year field experiment.J Environ Manage. 2024 Nov;370:122604. doi: 10.1016/j.jenvman.2024.122604. Epub 2024 Sep 19. J Environ Manage. 2024. PMID: 39303593
-
The shift of soil microbial community induced by cropping sequence affect soil properties and crop yield.Front Microbiol. 2023 Feb 16;14:1095688. doi: 10.3389/fmicb.2023.1095688. eCollection 2023. Front Microbiol. 2023. PMID: 36910216 Free PMC article.
-
Soil microbial substrate properties and microbial community responses under irrigated organic and reduced-tillage crop and forage production systems.PLoS One. 2014 Aug 4;9(8):e103901. doi: 10.1371/journal.pone.0103901. eCollection 2014. PLoS One. 2014. PMID: 25090235 Free PMC article.
-
[Response of Bacterial and Fungal Communities to Chemical Fertilizer Reduction Combined with Organic Fertilizer and Straw in Fluvo-aquic Soil].Huan Jing Ke Xue. 2020 Oct 8;41(10):4669-4681. doi: 10.13227/j.hjkx.202003068. Huan Jing Ke Xue. 2020. PMID: 33124400 Chinese.
Cited by
-
Transcriptome analysis of Pennisetum americanum × Pennisetum purpureum and Pennisetum americanum leaves in response to high-phosphorus stress.BMC Plant Biol. 2024 Jul 6;24(1):635. doi: 10.1186/s12870-024-05339-3. BMC Plant Biol. 2024. PMID: 38971717 Free PMC article.
-
Rotation with other crops slow down the fungal process in tobacco-growing soil.Sci Rep. 2024 Jun 19;14(1):14160. doi: 10.1038/s41598-024-64735-9. Sci Rep. 2024. PMID: 38898096 Free PMC article.
-
Maize, Peanut, and Millet Rotations Improve Crop Yields by Altering the Microbial Community and Chemistry of Sandy Saline-Alkaline Soils.Plants (Basel). 2024 Aug 5;13(15):2170. doi: 10.3390/plants13152170. Plants (Basel). 2024. PMID: 39124287 Free PMC article.
-
Research on drought stress in Medicago sativa L. from 1998 to 2023: a bibliometric analysis.Front Plant Sci. 2024 May 30;15:1406256. doi: 10.3389/fpls.2024.1406256. eCollection 2024. Front Plant Sci. 2024. PMID: 38872890 Free PMC article. Review.
References
-
- Salika R., Riffat J. Abiotic stress responses in maize: A review. Acta Physiol. Plant. 2021;43:130. doi: 10.1007/s11738-021-03296-0. - DOI
-
- Manisha K., Ruchi S., Devina V., Anil G., Harpreet K.S., Anupama A., Chahat T., Aastha V., Manisha T., Priyanka, et al. Maize: An underexploited golden cereal crop. Cereal Res. Commun. 2023;51:3–14. doi: 10.1007/s42976-022-00280-3. - DOI
-
- Liu Y., Yu Q., Zhou Q., Wang C., Bellingrath-Kimura S.D., Wu W. Mapping the complex crop rotation systems in Southern China considering cropping intensity, crop diversity, and their seasonal dynamics. IEEE J. Sel. Top. Appl. Earth Obs. Remote Sens. 2022;15:9584–9598. doi: 10.1109/JSTARS.2022.3218881. - DOI
-
- Yao Q.L., Chen F.B., Liu H.F., Fang P. Evolution of maize landraces in southwest China: Evidence from the globulin1 gene. Biochem. Syst. Ecol. 2015;61:54–61. doi: 10.1016/j.bse.2015.04.032. - DOI
Grants and funding
LinkOut - more resources
Full Text Sources
