

Profile of Pancreatic and Ileal Microbiota in Experimental Acute Pancreatitis
- PMID: 38004720
- PMCID: PMC10672832
- DOI: 10.3390/microorganisms11112707
Profile of Pancreatic and Ileal Microbiota in Experimental Acute Pancreatitis
Abstract
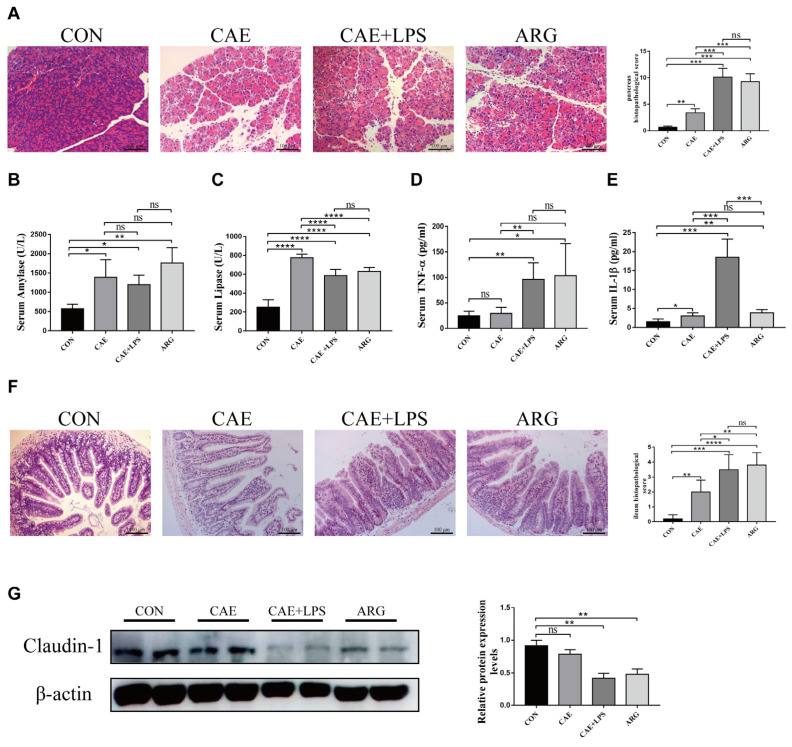
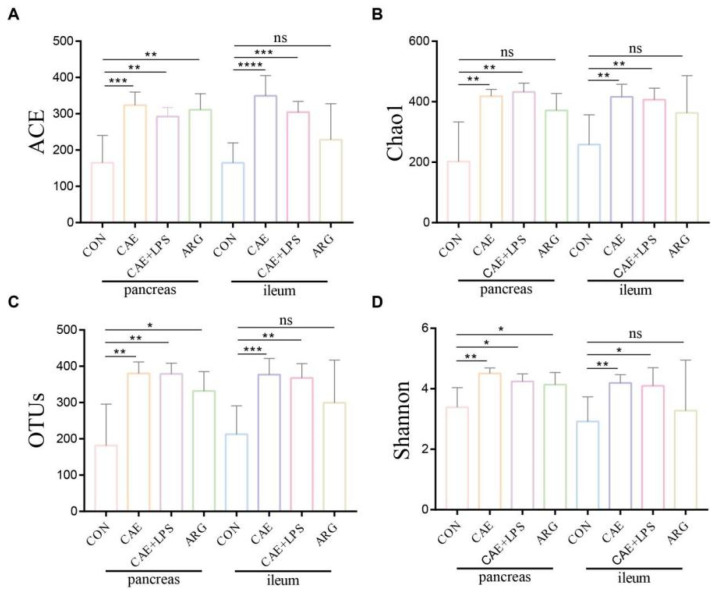
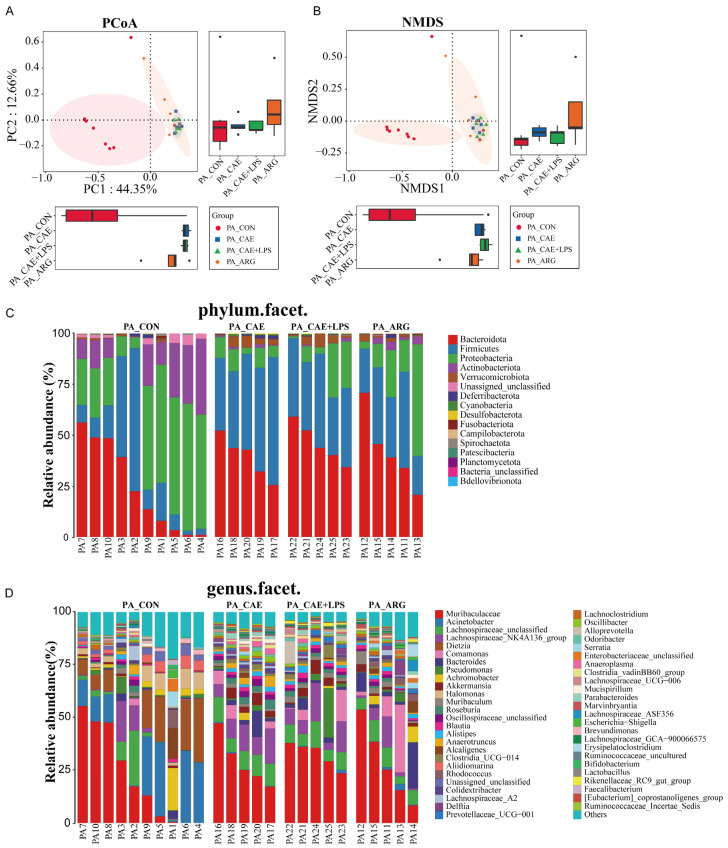
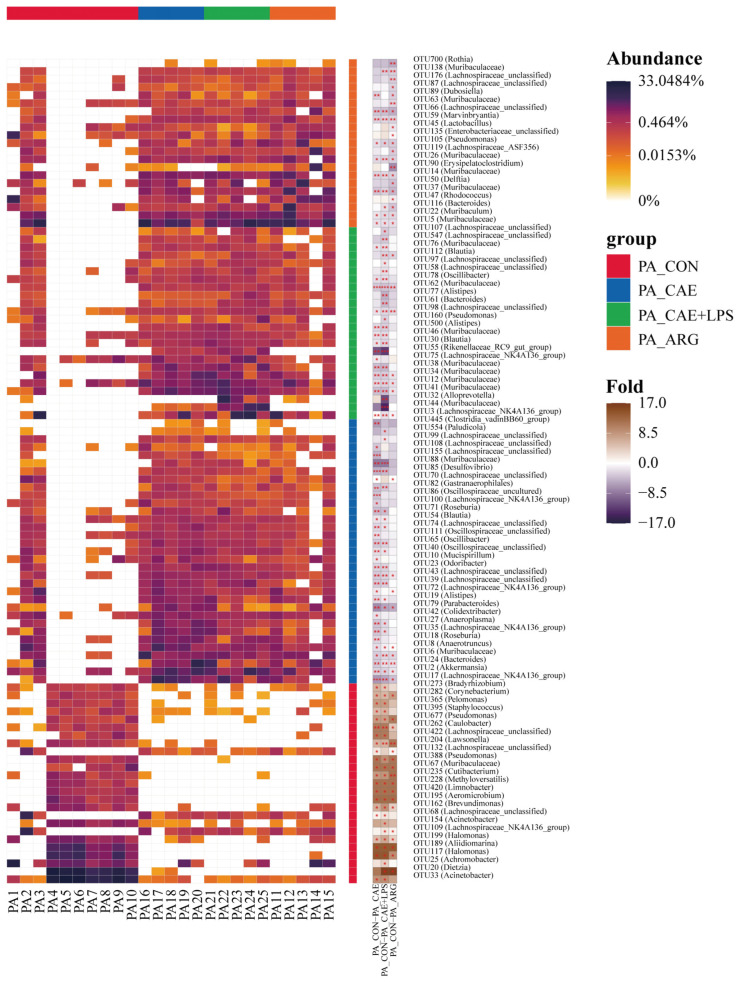
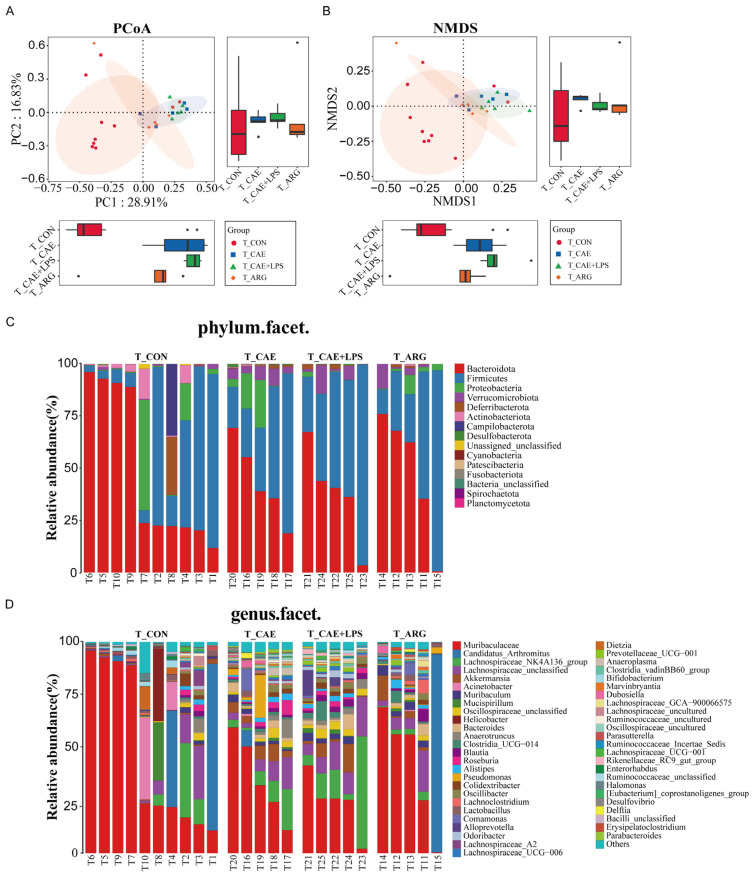
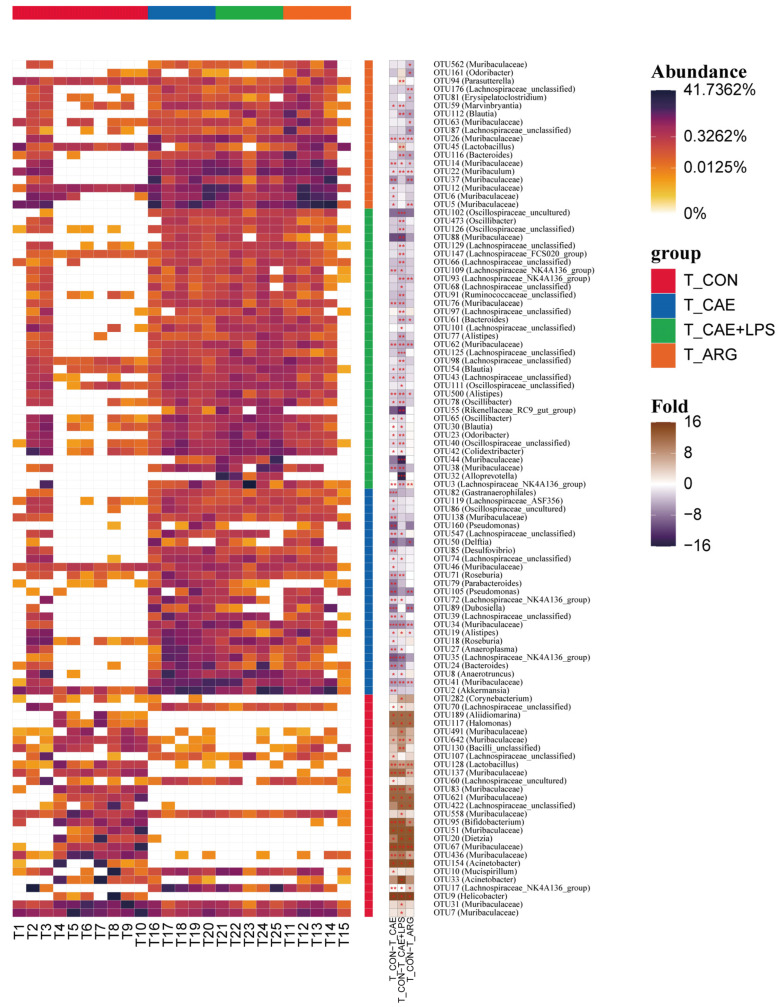
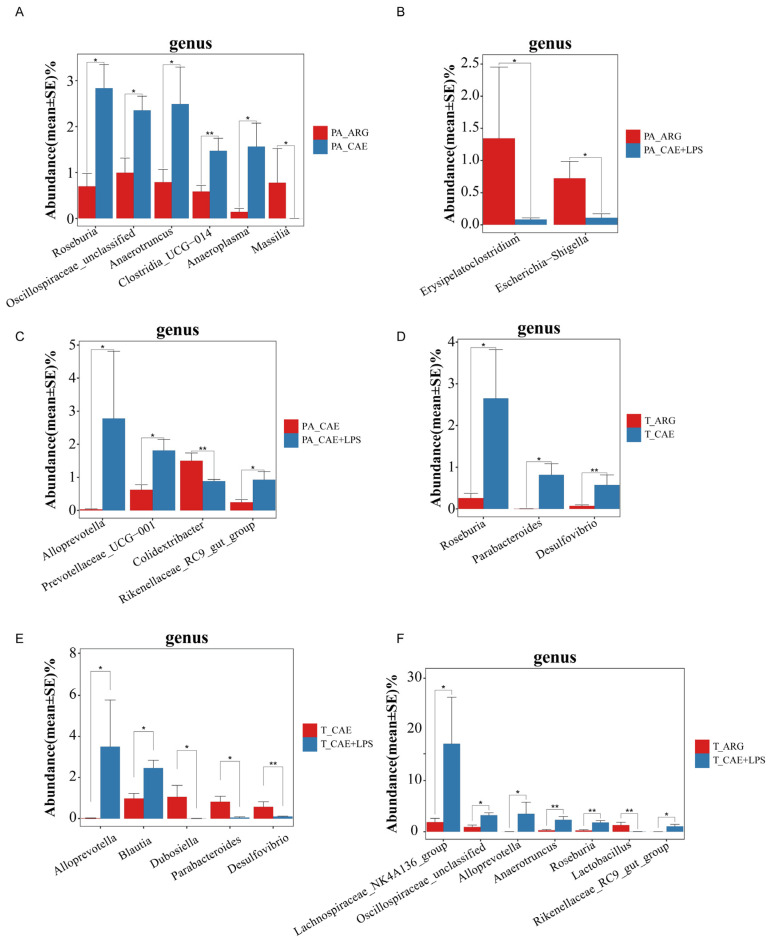
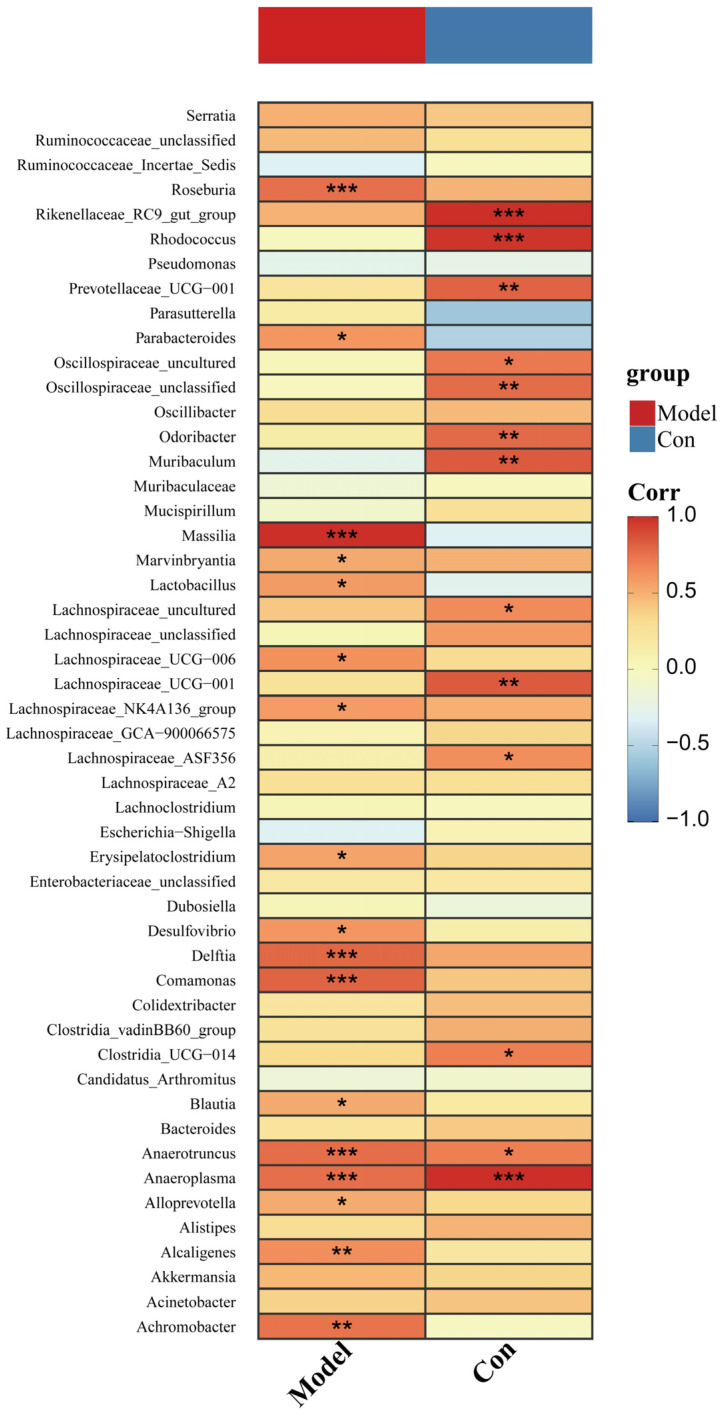
Acute pancreatitis (AP) is accompanied by gut microbiota dysbiosis. However, the composition of the pancreatic and ileal microbiota associated with AP is still unknown. This study aims to examine the alterations in the microbial composition of the pancreas and ileum in the context of experimental acute pancreatitis, as well as explore the potential interplay between these two regions. Methods: Caerulein (CAE), caerulein+lipopolysaccharide (CAE+LPS), and L-arginine (ARG) were used to induce AP in mice. The pancreas and ileum were collected for histological study and bacterial 16S rRNA gene sequencing. The results showed microbial structural segregation between the AP and control groups and between ARG and the two CAE groups (CAE, CAE+LPS) in the pancreas and ileum. Taxonomic analysis at the genus level and linear discriminant analysis effect size (LEfSe) at the operational taxonomic units (OTUs) level illustrated that AP mice exhibited a marked increase in the relative abundance of Muribaculaceae and a decrease in that of Dietzia both in the pancreas and ileum, and a reduction in Bifidobacterium only in the ileum; in addition, Roseburia was enriched in the two CAE groups in the pancreas and/or ileum, while Escherichia-Shigella expanded in the pancreas of the ARG group. Spearman correlation analysis between pancreatic and ileal microbiota revealed that the abundance of Muribaculaceae and Dietzia in the pancreas was related to that in the ileum. These findings demonstrated that caerulein and L-arginine differentially disturbed the pancreatic and ileal microbiota when inducing AP. Furthermore, these findings provide preliminary support for an association between the microbiota of the pancreas and ileum, which could be caused by AP-induced microbial translocation.
Keywords: Dietzia; Muribaculaceae; acute pancreatitis; ileal microbiota; pancreatic microbiota.
Conflict of interest statement
The authors declare no conflict of interest.
Figures
Similar articles
-
Intestinal TLR4 deletion exacerbates acute pancreatitis through gut microbiota dysbiosis and Paneth cells deficiency.Gut Microbes. 2022 Jan-Dec;14(1):2112882. doi: 10.1080/19490976.2022.2112882. Gut Microbes. 2022. PMID: 35982604 Free PMC article.
-
Gut microbiota dysbiosis worsens the severity of acute pancreatitis in patients and mice.J Gastroenterol. 2019 Apr;54(4):347-358. doi: 10.1007/s00535-018-1529-0. Epub 2018 Dec 5. J Gastroenterol. 2019. PMID: 30519748
-
Dysbiosis of Intestinal Microbiota and Decreased Antimicrobial Peptide Level in Paneth Cells during Hypertriglyceridemia-Related Acute Necrotizing Pancreatitis in Rats.Front Microbiol. 2017 May 4;8:776. doi: 10.3389/fmicb.2017.00776. eCollection 2017. Front Microbiol. 2017. PMID: 28522995 Free PMC article.
-
The Interaction of Microbiome and Pancreas in Acute Pancreatitis.Biomolecules. 2023 Dec 31;14(1):59. doi: 10.3390/biom14010059. Biomolecules. 2023. PMID: 38254659 Free PMC article. Review.
-
The association between exocrine pancreatic insufficiency and changes in gut microbiota: a narrative review.Med Pharm Rep. 2025 Jan;98(1):5-12. doi: 10.15386/mpr-2638. Epub 2025 Jan 31. Med Pharm Rep. 2025. PMID: 39949904 Free PMC article. Review.
Cited by
-
Gut microbiota and their relationship with circulating adipokines in an acute hepatic encephalopathy mouse model induced by surgical bile duct ligation.Heliyon. 2024 Sep 26;10(19):e38534. doi: 10.1016/j.heliyon.2024.e38534. eCollection 2024 Oct 15. Heliyon. 2024. PMID: 39391493 Free PMC article.
-
Therapeutic potential of plant polyphenols in acute pancreatitis.Inflammopharmacology. 2025 Feb;33(2):785-798. doi: 10.1007/s10787-024-01584-y. Epub 2024 Nov 4. Inflammopharmacology. 2025. PMID: 39497005 Review.
References
-
- Sendler M., Maertin S., John D., Persike M., Weiss F.U., Krüger B., Wartmann T., Wagh P., Halangk W., Schaschke N., et al. Cathepsin B Activity Initiates Apoptosis via Digestive Protease Activation in Pancreatic Acinar Cells and Experimental Pancreatitis. J. Biol. Chem. 2016;291:14717–14731. doi: 10.1074/jbc.M116.718999. - DOI - PMC - PubMed
-
- Ojima M., Motooka D., Shimizu K., Gotoh K., Shintani A., Yoshiya K., Nakamura S., Ogura H., Iida T., Shimazu T. Metagenomic Analysis Reveals Dynamic Changes of Whole Gut Microbiota in the Acute Phase of Intensive Care Unit Patients. Dig. Dis. Sci. 2016;61:1628–1634. doi: 10.1007/s10620-015-4011-3. - DOI - PMC - PubMed
Grants and funding
LinkOut - more resources
Full Text Sources
