. 2023 Nov 8;11(11):2728.
doi: 10.3390/microorganisms11112728.

Two-Dose Ceftiofur Treatment Increases Cephamycinase Gene Quantities and Fecal Microbiome Diversity in Dairy Cows Diagnosed with Metritis

Affiliations

Two-Dose Ceftiofur Treatment Increases Cephamycinase Gene Quantities and Fecal Microbiome Diversity in Dairy Cows Diagnosed with Metritis

Claudia Ossa-Trujillo et al. Microorganisms. .

Abstract

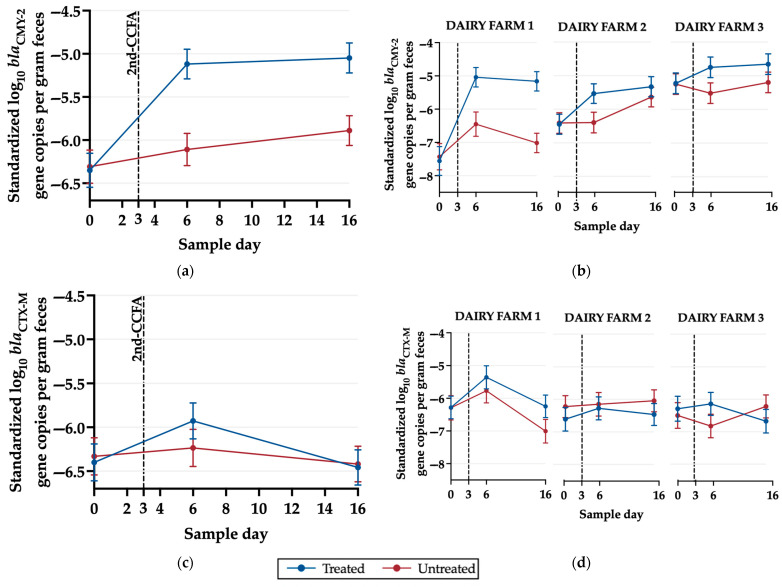
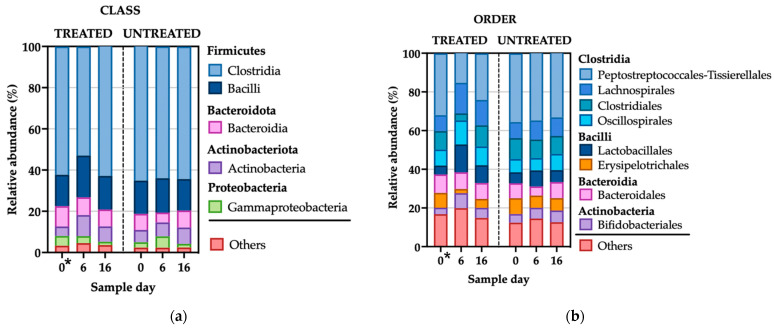
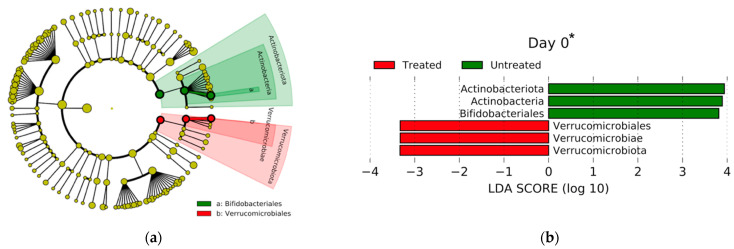
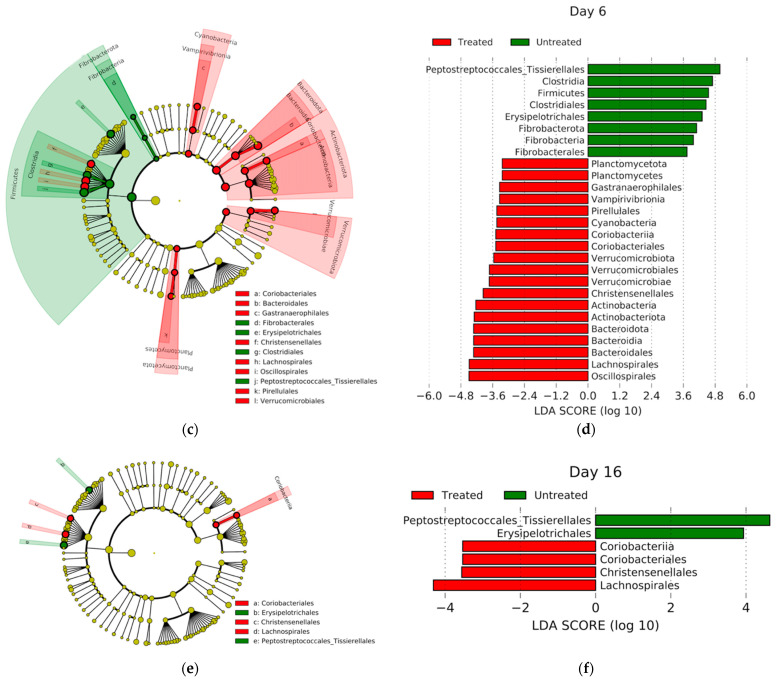
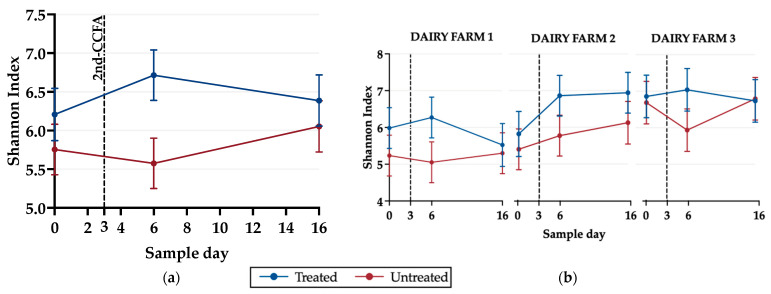
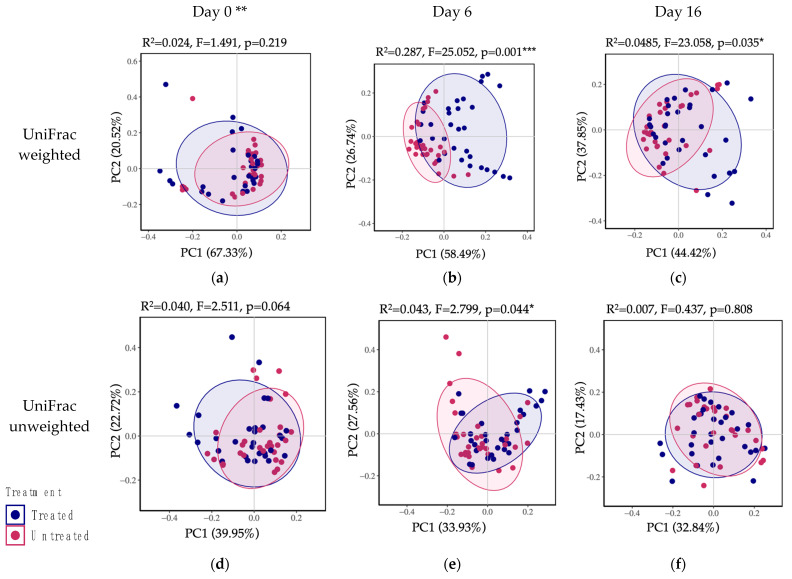
Antimicrobial resistance is a significant concern worldwide; meanwhile, the impact of 3rd generation cephalosporin (3GC) antibiotics on the microbial communities of cattle and resistance within these communities is largely unknown. The objectives of this study were to determine the effects of two-dose ceftiofur crystalline-free acid (2-CCFA) treatment on the fecal microbiota and on the quantities of second-and third-generation cephalosporin, fluoroquinolone, and macrolide resistance genes in Holstein-Friesian dairy cows in the southwestern United States. Across three dairy farms, 124 matched pairs of cows were enrolled in a longitudinal study. Following the product label regimen, CCFA was administered on days 0 and 3 to cows diagnosed with postpartum metritis. Healthy cows were pair-matched based on lactation number and calving date. Fecal samples were collected on days 0, 6, and 16 and pooled in groups of 4 (n = 192) by farm, day, and treatment group for community DNA extraction. The characterization of community DNA included real-time PCR (qPCR) to quantify the following antibiotic resistance genes: blaCMY-2, blaCTX-M, mphA, qnrB19, and the highly conserved 16S rRNA back-calculated to gene copies per gram of feces. Additionally, 16S rRNA amplicon sequencing and metagenomics analyses were used to determine differences in bacterial community composition by treatment, day, and farm. Overall, blaCMY-2 gene copies per gram of feces increased significantly (p ≤ 0.05) in the treated group compared to the untreated group on day 6 and remained elevated on day 16. However, blaCTX-M, mphA, and qnrB19 gene quantities did not differ significantly (p ≥ 0.05) between treatment groups, days, or farms, suggesting a cephamycinase-specific enhancement in cows on these farms. Perhaps unexpectedly, 16S rRNA amplicon metagenomic analyses showed that the fecal bacterial communities from treated animals on day 6 had significantly greater (p ≤ 0.05) alpha and beta diversity than the untreated group. Two-dose ceftiofur treatment in dairy cows with metritis elevates cephamycinase gene quantities among all fecal bacteria while paradoxically increasing microbial diversity.

Keywords: 3rd generation cephalosporin; antibiotic resistance genes; dairy cattle; ecological diversity; fecal microbiota; fluoroquinolone; macrolide; metagenomics; metritis; two-dose CCFA.


Conflict of interest statement

The authors declare no conflict of interest.

Figures

Figure 1
Figure 1
Overview of the experimental design. (a) Schematic description of the matched-pair longitudinal study design (created with BioRender.com accessed on 1 September 2023) and (b) Overall methods workflow.
Figure 2
Figure 2
Marginal means graphs of the linear regression model of standardized (log10 target resistance gene–log10 16S rRNA) log10 genes copies per gram of feces based on (a) blaCMY-2, (b) blaCMY-2 by farm, (c) blaCTX-M, and (d) blaCTX-M by farm. Data were analyzed using Stata/BE version 17.0 and graphed using GraphPad Prism version 10.0.2.
Figure 3
Figure 3
Fecal microbiome relative abundance by day and treatment (2-CCFA). Comparisons of relative abundance at the level of (a) class and (b) order. * On day 0, the only difference between the treatment groups was the presence of metritis in the treated group. The graph was generated using GraphPad Prism version 10.0.2.
Figure 4
Figure 4
Linear Discriminant Analysis Effect Size (LEfSe) and taxonomic cladogram results of the significantly differentially abundant taxa in treated and untreated groups on day 0 (a,b), day 6 (c,d), and day 16 (e,f). Orders more abundant in the treated group are presented in red (indicated with a negative Linear Discriminant Analysis (LDA) score, whereas orders more abundant in the untreated group are presented in green (indicated with a positive LDA score). In the cladogram, the size of each dot is proportional to the effect size. * On day 0, the only difference between the treated groups is the presence of the animal disease metritis.
Figure 4
Figure 4
Linear Discriminant Analysis Effect Size (LEfSe) and taxonomic cladogram results of the significantly differentially abundant taxa in treated and untreated groups on day 0 (a,b), day 6 (c,d), and day 16 (e,f). Orders more abundant in the treated group are presented in red (indicated with a negative Linear Discriminant Analysis (LDA) score, whereas orders more abundant in the untreated group are presented in green (indicated with a positive LDA score). In the cladogram, the size of each dot is proportional to the effect size. * On day 0, the only difference between the treated groups is the presence of the animal disease metritis.
Figure 5
Figure 5
Marginal means graphs from a linear regression model of the Shannon alpha diversity index in treated and untreated groups on (a) days 0, 6, and 16 and (b) by farm. Data were analyzed using Stata/BE version 17.0 and graphed using GraphPad Prism version 10.0.2.
Figure 6
Figure 6
Fecal microbial beta-diversity represented in Principal Component Ordinal Analyses (PCoA) clustered by day and treatment. UniFrac distances between bacterial community composition based on (ac) weighted (quantitative) and (df) unweighted (qualitative) on days 0, 6, and 16, respectively. Figures were generated using the Vegan package in R Studio. ** On day 0, the only difference between the treatment groups is the presence of the disease metritis in the (not-yet) treated group. *** Significant at p < 0.001, * Significant at p < 0.01.

Similar articles

References

    1. Fleming A. Classics in infectious diseases: On the antibacterial action of cultures of a penicillium, with special reference to their use in the isolation of B. influenzae by Alexander Fleming. Br. J. Exp. Pathol. 1929;10:226–236. reprinted in Rev. Infect. Dis. 1980, 2, 129–139. - PubMed
    1. Prestinaci F., Pezzotti P., Pantosti A. Antimicrobial resistance: A global multifaceted phenomenon. Pathog. Glob. Health. 2015;109:309–318. doi: 10.1179/2047773215Y.0000000030. - DOI - PMC - PubMed
    1. CDC . Antibiotic Resistance Threats in the United States. U.S. Department of Health and Human Services; Atlanta, GA, USA: 2019.
    1. O’Neil J. Tackling Drug-Resistant Infections Globally: Final Report and Recommendations. Volume 1. Government of the United Kingdom; London, UK: 2016. p. 84.
    1. Castanheira M., Simner P.J., Bradford P.A. Extended-spectrum beta-lactamases: An update on their characteristics, epidemiology and detection. JAC Antimicrob. Resist. 2021;3:dlab092. doi: 10.1093/jacamr/dlab092. - DOI - PMC - PubMed

LinkOut - more resources