. 2023 Nov 11;11(11):2755.
doi: 10.3390/microorganisms11112755.

Transcriptome and Secretome Analyses of Endophyte Methylobacterium mesophilicum and Pathogen Xylella fastidiosa Interacting Show Nutrient Competition

Affiliations

Transcriptome and Secretome Analyses of Endophyte Methylobacterium mesophilicum and Pathogen Xylella fastidiosa Interacting Show Nutrient Competition

Manuella Nobrega Dourado et al. Microorganisms. .

Abstract

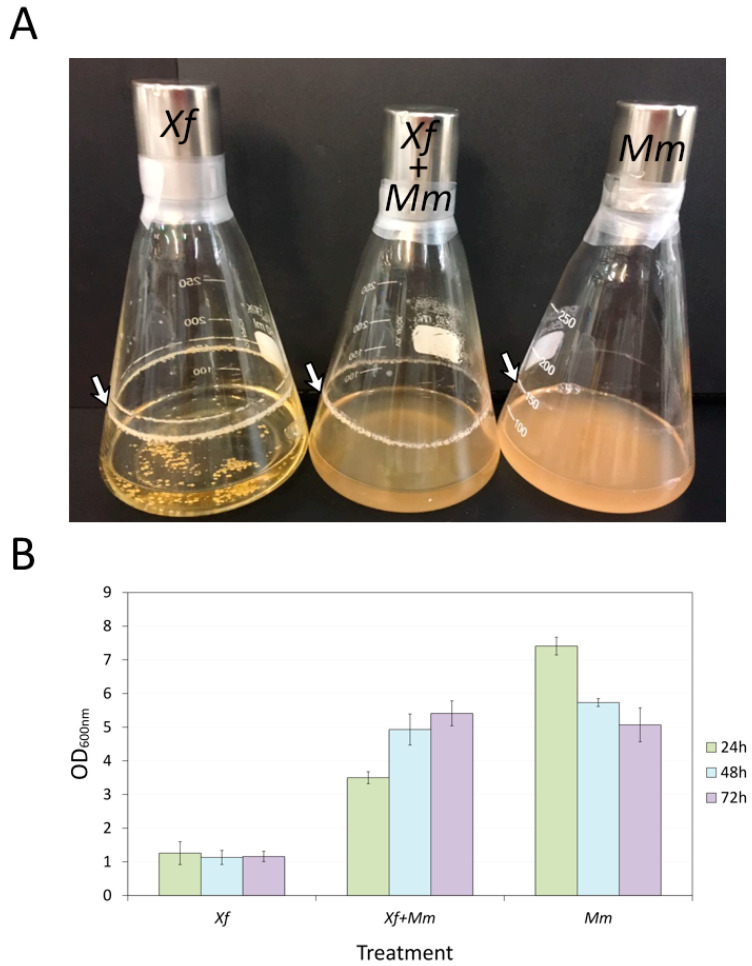
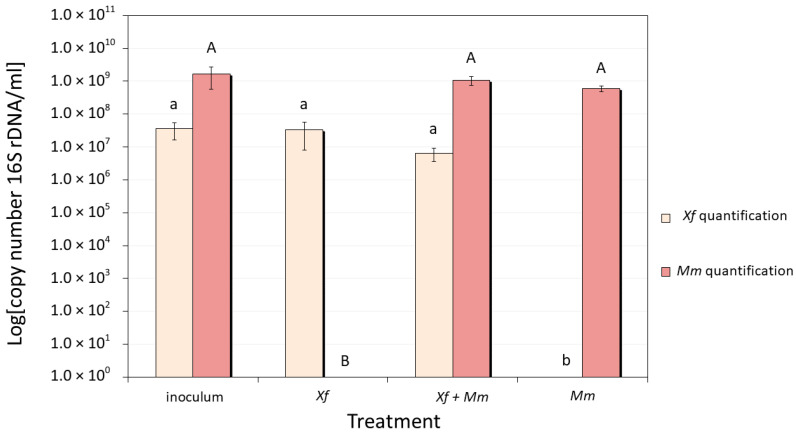
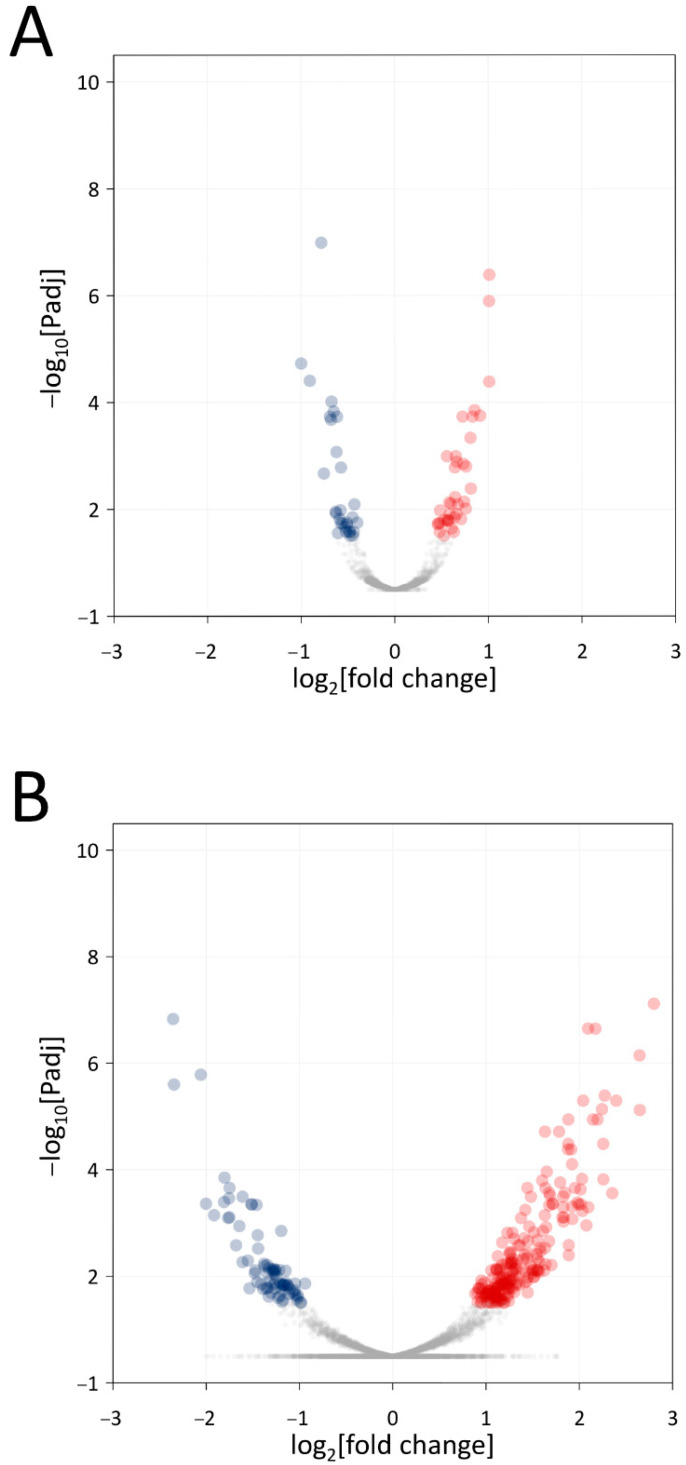
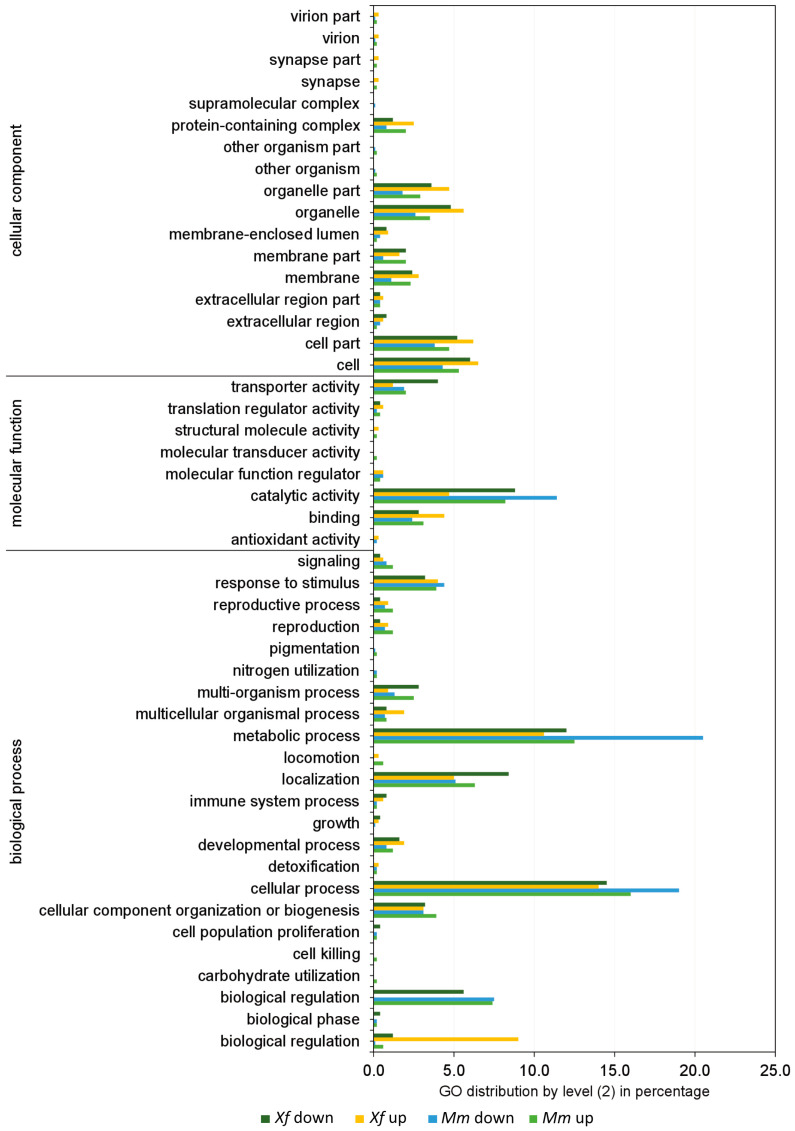
Xylella fastidiosa is the causal agent of several plant diseases affecting fruit and nut crops. Methylobacterium mesophilicum strain SR1.6/6 was isolated from Citrus sinensis and shown to promote plant growth by producing phytohormones, providing nutrients, inhibiting X. fastidiosa, and preventing Citrus Variegated Chlorosis. However, the molecular mechanisms involved in the interaction among these microbes are still unclear. The present work aimed to analyze physiological and molecular aspects of M. mesophilicum SR1.6/6 and X. fastidiosa 9a5c in co-culture. The transcriptome and secretome analyses indicated that X. fastidiosa down-regulates cell division and transport genes and up-regulates stress via induction of chaperones and pathogenicity-related genes including, the lipase-esterase LesA, a protease, as well as an oligopeptidase in response to M. mesophilicum competition. On the other hand, M. mesophilicum also down-regulated transport genes, except for iron uptake, which was up-regulated. Secretome analysis identified four proteins in M. mesophilicum exclusively produced in co-culture with X. fastidiosa, among these, three are related to phosphorous uptake. These results suggest that M. mesophilicum inhibits X. fastidiosa growth mainly due to nutrient competition for iron and phosphorous, thus promoting X. fastidiosa starvation, besides producing enzymes that degrade X. fastidiosa cell wall, mainly hydrolases. The understanding of these interactions provides a direction for control and management of the phytopathogen X. fastidiosa, and consequently, helps to improve citrus growth and productivity.

Keywords: citrus; endophytic bacteria; phytopathogen–endophyte interaction; secretome; transcriptome.


Conflict of interest statement

The authors declare no conflict of interest.

Figures

Figure 1
Figure 1
Phenotypic and growth evaluation of Xf and Mm monocultures and co-culture. (A) Phenotypic growth and biofilm formation (indicated by the white arrow) of Xf, Xf+Mm, and Mm after 72 h of culture. (B) Quantification of bacteria growth. Measurements of OD600nm of each treatment before and after co-culture. Measurements were performed after 24 h, 48 h, and 72 h of culture. Xf: X. fastidiosa 9a5c; Xf+Mm: X. fastidiosa 9a5c and M. mesophilicum SR1.6/6; Mm: M. mesophilicum SR1.6/6.
Figure 2
Figure 2
Quantification by qPCR of the number of copies of specific genes in aliquots of bacterial cells used in RNA-Seq analyses (after 24 h of co-culture). M. mesophilicum SR1.6/6 quantification using the pair of primers MMC1/MMC2 [31]; and X. fastidiosa 9a5c quantification using the pair of primers CVC-1/272-2-int [51]. Xf: X. fastidiosa 9a5c monoculture; Xf+Mm: X. fastidiosa 9a5c and M. mesophilicum SR1.6/6 co-culture; Mm: M. mesophilicum SR1.6/6 monoculture. Statistical analyses were performed using the Duncan test. Capital letters show statistical differences when comparing Mm quantification and lower-case letters when comparing Xf quantification, different letters indicate statistically significant different mean.
Figure 3
Figure 3
Volcano plots of differentially expressed genes. (A). Results of the comparison between the Xf+Mm co-culture with the control (Xf monoculture) (B). Results of the comparison between the Xf+Mm co-culture with the control (Mm monoculture). In the x-axis are the log2fold change values; in the y-axis are the −log10 adjusted p-values (padj). Points in red and blue represent genes with padj < 0.1, and thus, considered statistically differentially expressed; red dots represent genes up-regulated, while blue dots represent genes down-regulated. Xf: X. fastidiosa 9a5c; Xf+Mm: X. fastidiosa 9a5c and M. mesophilicum SR1.6/6; Mm: M. mesophilicum SR1.6/6.
Figure 4
Figure 4
Frequency (%) of the categories of differentially expressed genes (up- and down-regulated) in co-culture generated by Blast2GO software. Xf down: genes down-regulated in Xf in the comparison between the co-culture (Xf+Mm) and the control (Xf); Xf up: genes up-regulated in Xf in the comparison between the co-culture (Xf+Mm) and the control (Xf monoculture). Mm down: genes down-regulated in Mm in the comparison between the co-culture (Xf+Mm) and the control (Mm monoculture); Mm up: genes up-regulated in Mm in the comparison between the co-culture (Xf+Mm) and the control (Mm monoculture). Amino acid sequences of differentially expressed genes were used for annotation by “biological process”, “molecular function” and “cellular component”. Xf: X. fastidiosa 9a5c; Xf+Mm: X. fastidiosa 9a5c and M. mesophilicum SR1.6/6; Mm: M. mesophilicum SR1.6/6.
Figure 5
Figure 5
Gene Ontology classifications of secretome proteins. Proteins detected in the secretome analysis were annotated using Blast2GO (version 5.2.5) software in level 2 GO terms for Cellular Component, Molecular Function, and Biological Process ontologies. The percentage of annotated proteins with each indicated GO term level 2 is shown. The classification was applied to the secretomes of the monoculture of X. fastidiosa, X. fastidiosa on co-culture with M. mesophilicum, the monoculture of M. mesophilicum and M. mesophilicum on co-culture with X. fastidiosa.
Figure 6
Figure 6
Integration of transcriptome and secretome analyses. Venn diagrams show the intersection between transcriptome and proteome as well as monoculture and co-culture from Xf (A) and Mm (B). Numbers highlighted outside the Venn diagrams indicate the intersection of genes with the same trend, illustrated by the divergent arrows, in the transcriptome (T) and secretome (S). Xf: X. fastidiosa 9a5c; Xf+Mm: X. fastidiosa 9a5c + M. mesophilicum SR1.6/6; Mm: M. mesophilicum SR1.6/6. GO terms networks of Xf (C) and Mm (D) interaction data. Networks representing gene ontology (GO) terms in molecular function, biological process, or cellular component categories enriched among the integration of transcriptome and secretome analyses, showing genes specifically affected by co-culture between Mm and Xf. Enriched GO terms were identified after a pipeline involving a Mantel correlation test and Blast2Go and visualized with Cytoscape software v3.10.1. The GO terms were connected based on their parent-child relationships. The colors of the circles indicate the GO terms filtered after the interactome pipeline.
Figure 7
Figure 7
(A) Schematic representation of differentially expressed genes and proteins detected in the secretome of Xf and Mm during co-culture. Green represents genes up-regulated during co-culture and red those that are down-regulated during co-culture. The number of differentially expressed genes in the functional categories is indicated in brackets. The bottom box shows the schematic representation of the secretome. Secretome analysis identified four proteins in M. mesophilicum exclusively produced in co-culture with X. fastidiosa, among these, three are related to phosphorous uptake. Orange represents Xf proteins and pink represents Mm proteins detected during co-culture. The number of proteins identified in the functional categories is indicated in brackets. OMVs—Outer membrane vesicles. Xf: X. fastidiosa 9a5c; Xf+Mm: X. fastidiosa 9a5c + M. mesophilicum SR1.6/6; Mm: M. mesophilicum SR1.6/6. (B) Mm ABC transporter operon. Green arrows represent up-regulated genes in Xf+Mm co-culture according to transcriptome analysis, orange arrows represent genes with similar expression in all tested treatments. (*) indicates an up-regulated gene in co-culture which encoded protein was detected in the secretome of Mm monoculture.

Similar articles

Cited by

References

    1. Wells J.M., Raju B.C., Hung H.-Y., Weisburg W.G., Mandelco-Paul L., Brenner D.J. Xylella fastidiosa gen. nov., sp. nov: Gram-negative, xylem-limited, fastidious plant bacteria related to Xanthomonas spp. Int. J. Syst. Bacteriol. 1987;37:136–143. doi: 10.1099/00207713-37-2-136. - DOI
    1. Hopkins D.L. Xylella fastidiosa: Xylem-limited bacterial pathogen of plants. Ann. Rev. Phytopathol. 1989;27:271–290. doi: 10.1146/annurev.py.27.090189.001415. - DOI
    1. Chang C.J., Garnier M., Zreik L., Rossetti V., Bove J.M. Culture and serological detection of the xylem-limited bacterium causing citrus variegated chlorosis and its identification as a strain ofXylella fastidiosa. Curr. Microbiol. 1993;27:137–142. doi: 10.1007/BF01576010. - DOI - PubMed
    1. Hopkins D.L., Purcell A.H. Xylella fastidiosa: Cause of Pierce’s disease of grapevine and other emergent diseases. Plant Dis. 2002;86:1056–1066. doi: 10.1094/PDIS.2002.86.10.1056. - DOI - PubMed
    1. Cariddi C., Saponari M., Boscia D., De Stradis A., Loconsole G., Nigro F., Porcelli F., Potere O., Martelli G.P. Isolation of a Xylella fastidiosa strain infecting olive and oleander in Apulia, Italy. J. Plant Pathol. 2014;96:425–429.