. 2023 Nov 9;16(22):7094.
doi: 10.3390/ma16227094.

Peculiarity of the Structure and Luminescence of Glasses in La2S3-Ga2S3-GeS2:Pr3+ System

Affiliations

Peculiarity of the Structure and Luminescence of Glasses in La2S3-Ga2S3-GeS2:Pr3+ System

Andrey Tverjanovich et al. Materials (Basel). .

Abstract

The effect of modifying the composition of a glass matrix based on the Ga2S3-GeS2:Pr3+ system due to the addition of La2S3 on the structure and the optical and luminescent properties of these glasses has been studied. It has been shown that the addition of La2S3 leads to changes in the nearest structural environment of Ga, Ge, and S and increases the degree of ionicity of the bonds of the Pr3+ ion. Despite the existence of a large glass formation region in the Ga2S3-GeS2-La2S3 system and the structural and chemical similarity of La and Pr, La2S3 does not promote a more uniform distribution of Pr3+ ions in the glass matrix, and thus does not reduce the concentration quenching of the luminescence of Pr3+ ions. However, the addition of La2S3 increases the probability of emission of Pr3+ ions and decreases the radiative lifetime. Additionally, it was shown that, when studying the structure and luminescent properties of glasses with La, it is necessary to take into account a significant concentration of rare earth traces (Pr and Nd).

Keywords: IR materials; chalcogenide glasses; luminescent materials.


Conflict of interest statement

The authors declare no conflict of interest.

Figures

Figure 6
Figure 6
(A) The solid brown line is Raman spectrum of glass composition 3; the dashed orange line is absorption spectrum of glass composition 36.7GaS1.5-63.3GeS2 containing 0.1 at.% Nd recalculated for the dependence on Raman shift. (B) Diagram of Nd3+ ion levels. The arrows indicate the pump and observed luminescence wavelengths used in this work. (C) Luminescence spectrum of Nd3+ in glass composition 3 obtained from a part of the Raman spectrum (A) and the result of its approximation by 5 peaks. (D) Solid lines are Nd3+ luminescence spectra corresponding to the 4F3/2-4I9/2 transition in silicate glass [42] and glass of composition 3. The dotted line indicates the spectrum of silicate glass shifted along the abscissa axis by 11 nm to the long-wavelength region of the spectrum.
Figure 1
Figure 1
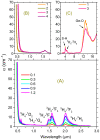
(A) Absorption spectra of glass composition 1 with Pr content from 0.1 to 1.2 at.%. (B) Absorption spectra of glasses of the studied compositions containing 0.3 at.% Pr. (C) Absorption spectra of glasses of compositions 1 and 3 containing 1.2 at.% Pr in the IR range.
Figure 2
Figure 2
Spectral position of the absorption band of the Pr3+ ion due to the transition 3H4-3F3, depending on the composition of the glass.
Figure 3
Figure 3
(A) Raman spectra of glasses of composition 1 and 3. (B) The difference between the normalized Raman spectra of glasses of composition 3 and 1.
Figure 4
Figure 4
(A) The normalized Raman spectra of glasses of compositions 4 and 5. (B) The difference between the normalized Raman spectra of glasses of compositions 5 and 4.
Figure 5
Figure 5
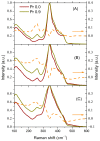
Raman spectra of glasses containing 0.9 at.% Pr. (A) Glass of composition 1; (B) glass of composition 3; (C) glass of composition 5. The dashed orange curve shows the corresponding differences in the Raman spectra of these glasses: the Raman spectrum of the glass containing 0.9 at.% Pr minus the spectrum of the original glass.
Figure 7
Figure 7
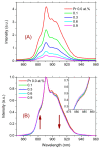
(A) Luminescence spectra of Nd3+ impurity ions in glass of composition 5 with different Pr content. (B) Luminescence spectra of Nd3+ impurity ions in glass of composition 5 at different Pr contents normalized to the peak intensity in the region of 891 nm. The arrows indicate the direction of intensity change with increasing Pr content. The inset shows the region of the spectrum on an enlarged scale.
Figure 8
Figure 8
Luminescence spectrum of glass of composition 1 containing 0.1, 0.3, 0.6, 0.9, and 1.2 at.% Pr. The inset shows the result of spectrum fitting for the glass containing 0.3 at.% Pr. Dots are the experimental data.
Figure 9
Figure 9
Luminescence spectrum of glass of composition 3 containing 0.1, 0.3, 0.6, 0.9, and 1.2 at.% Pr. The inset shows the dependence of the peak intensity at 1040 nm (Pr3+) and 1080 nm (Nd3+) on the added Pr concentration.

References

    1. Guo H., Cui J., Xu C., Xu Y., Farrell G. Mid-Infrared Fluoride and Chalcogenide Glasses and Fibers. Progress in Optical Science and Photonics. Volume 18. Springer; Singapore: 2022. Mid-Infrared Spectral Properties of Rare Earth Ion Doped Chalcogenide Glasses and Fibers. - DOI
    1. Jahromi K.E., Pan Q., Høgstedt L., Friis S.M.M., Khodabakhsh A., Moselund P.M., Harren F.J.M. Mid-infrared supercontinuum-based upconversion detection for trace gas sensing. Opt. Express. 2019;27:24469–24480. doi: 10.1364/OE.27.024469. - DOI - PubMed
    1. Bensaid S., Kachenoura A., Costet N., Bensalah K., Tariel H., Senhadji L. Noninvasive detection of bladder cancer using mid-infrared spectra classification. Expert Syst. Appl. 2017;89:333–342. doi: 10.1016/j.eswa.2017.07.052. - DOI
    1. Lucas P., Coleman G.J., Jiang S.B., Luo T., Yang Z.Y. Chalcogenide glass fibers: Optical window tailoring and suitability for bio-chemical sensing. Opt. Mater. 2015;47:530–536. doi: 10.1016/j.optmat.2015.06.034. - DOI
    1. Kumta P.N., Risbud S.H. Rare-earth chalcogenides—An emerging class of optical materials. J. Mater. Sci. 1994;29:1135–1158. doi: 10.1007/BF00975057. - DOI