. 2023 Nov 16;28(22):7619.
doi: 10.3390/molecules28227619.

Anti-Inflammatory Properties of Eugenol in Lipopolysaccharide-Induced Macrophages and Its Role in Preventing β-Cell Dedifferentiation and Loss Induced by High Glucose-High Lipid Conditions

Affiliations

Anti-Inflammatory Properties of Eugenol in Lipopolysaccharide-Induced Macrophages and Its Role in Preventing β-Cell Dedifferentiation and Loss Induced by High Glucose-High Lipid Conditions

Esmaeel Ghasemi Gojani et al. Molecules. .

Abstract

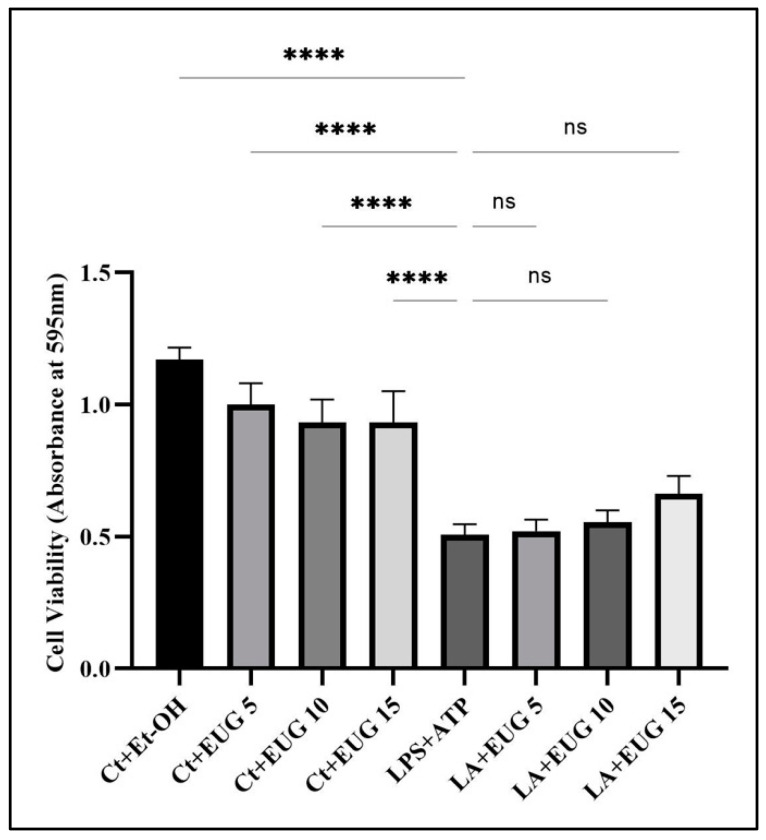
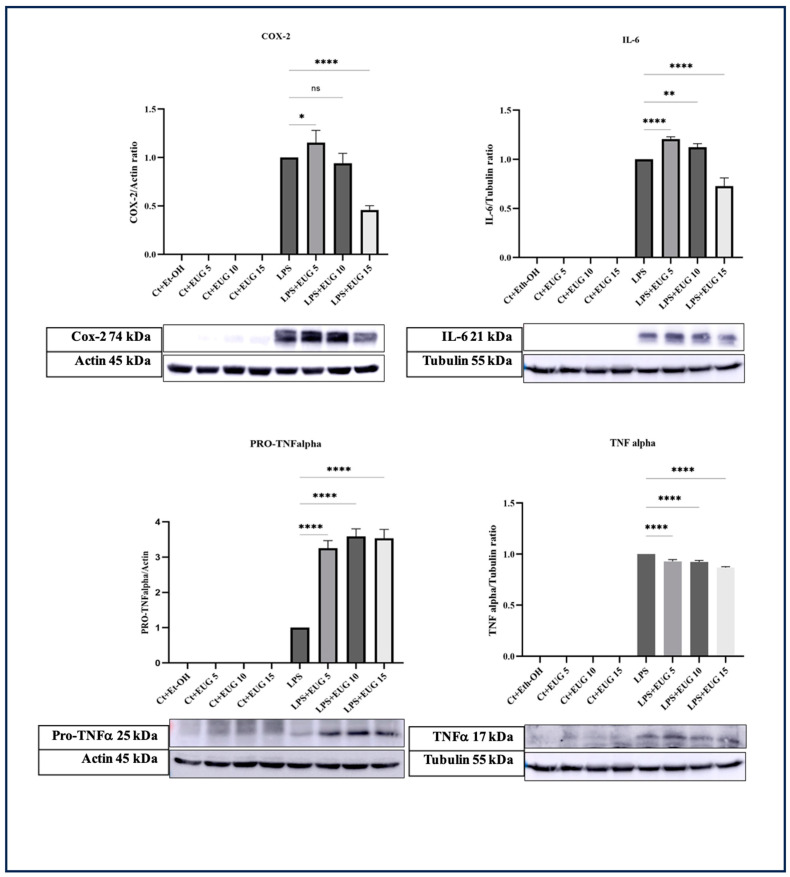
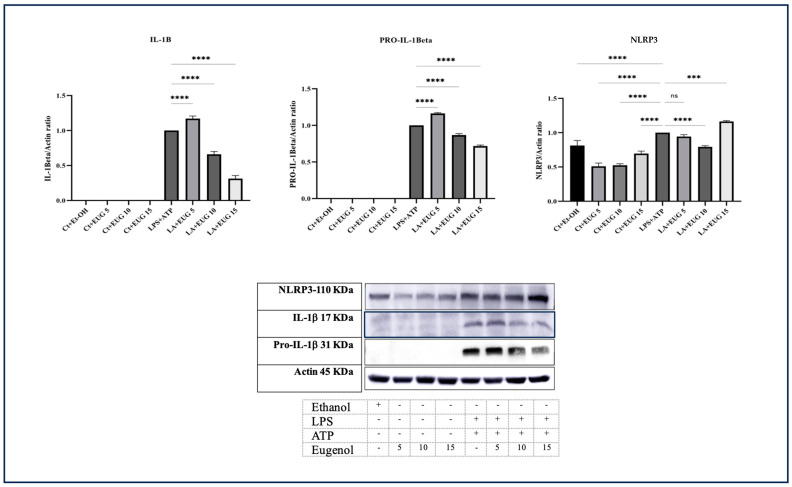
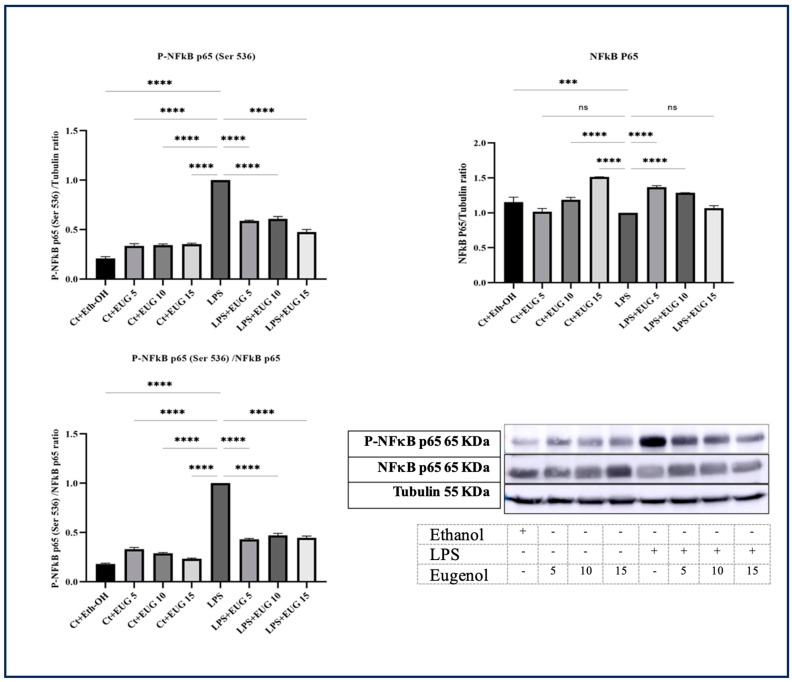
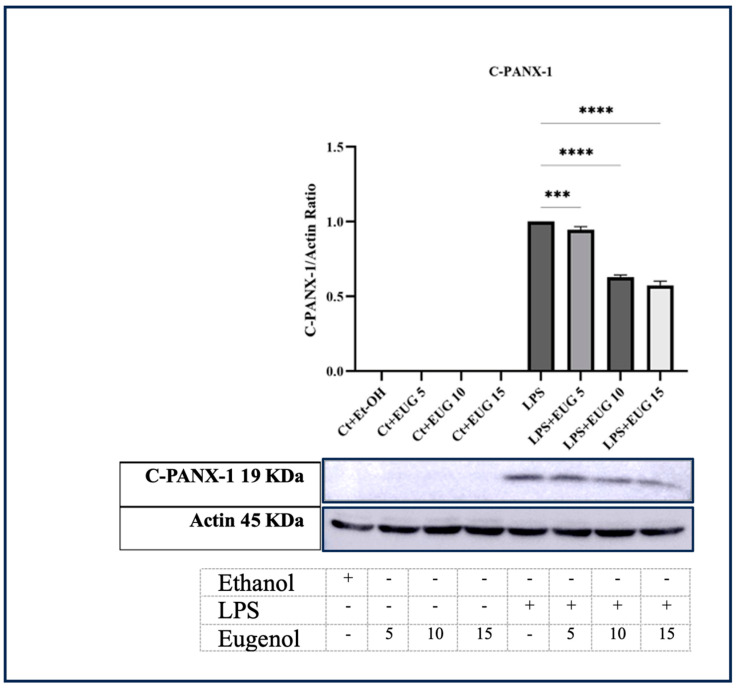
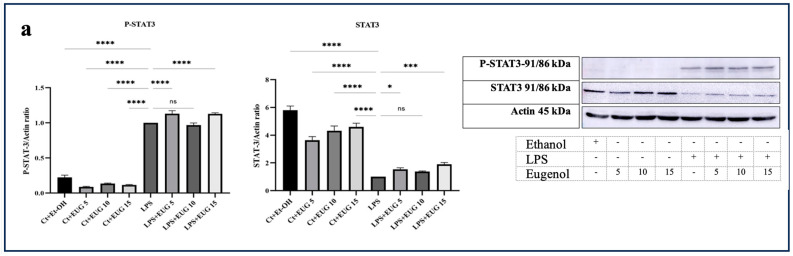
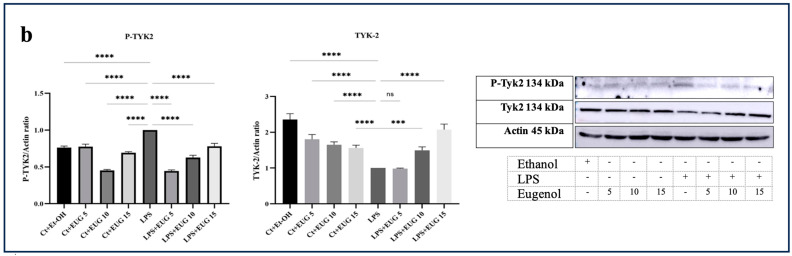
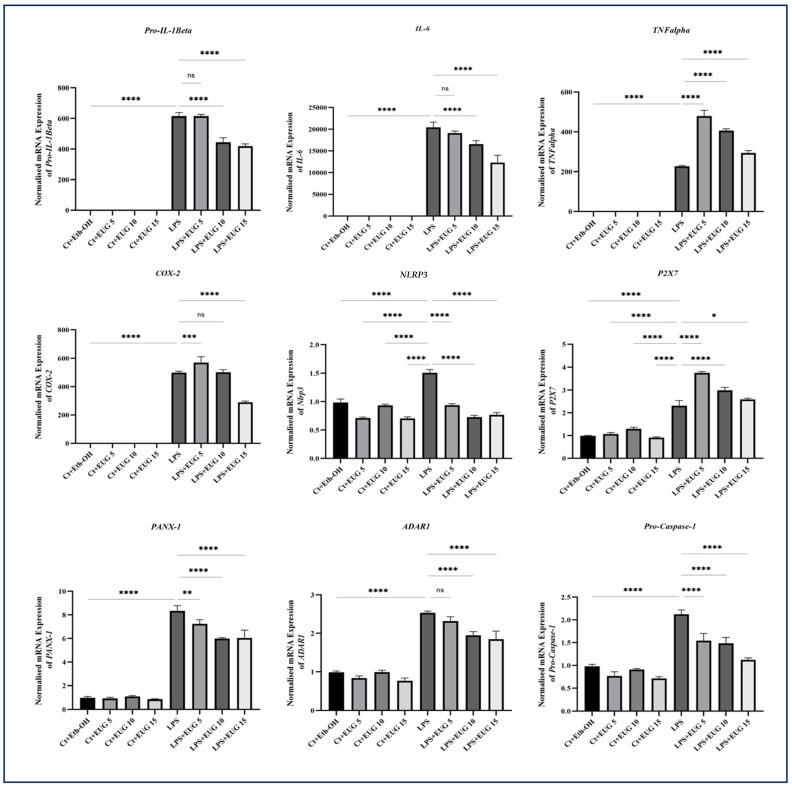
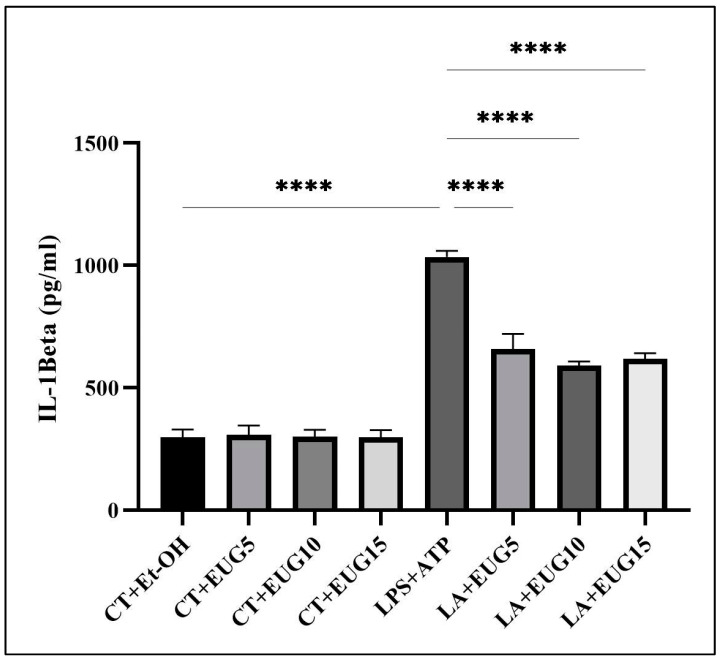
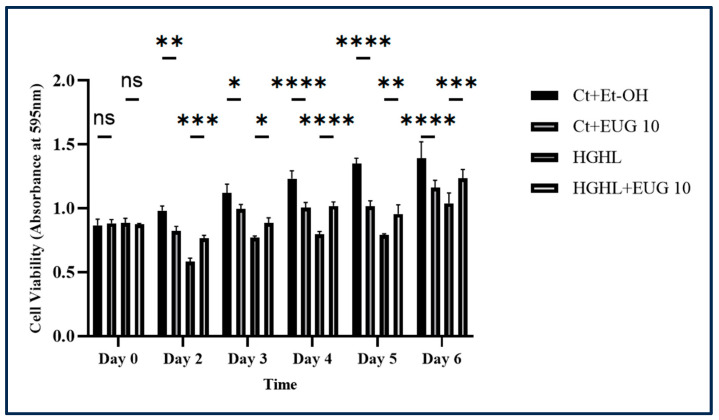
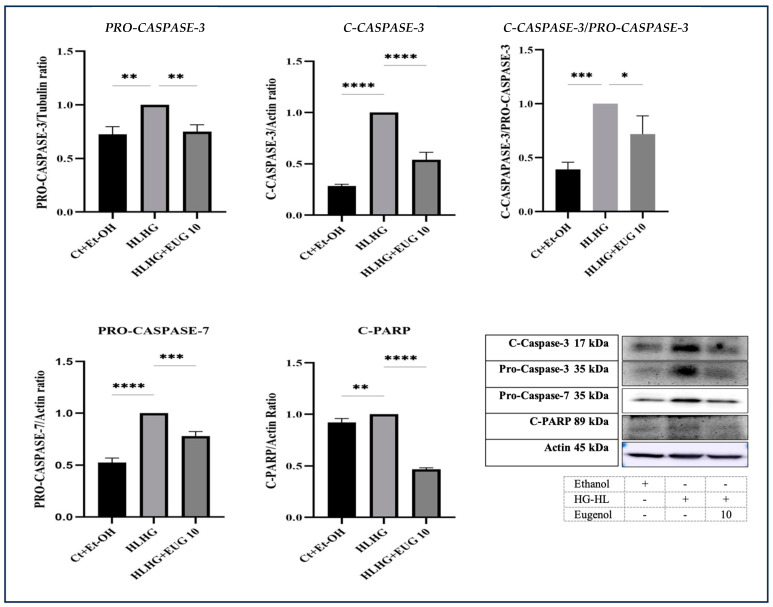
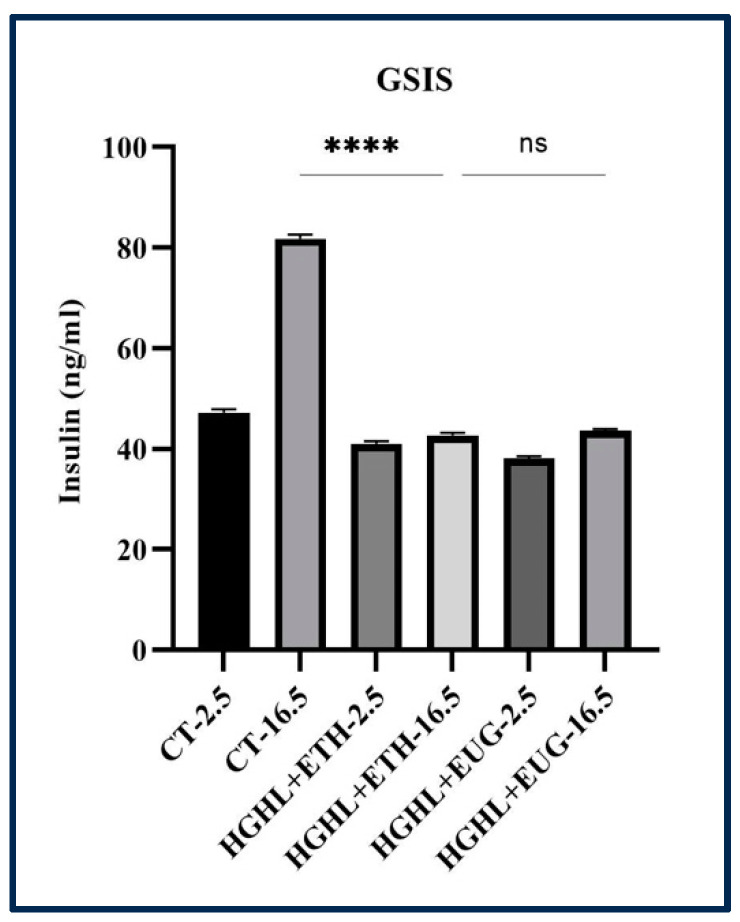
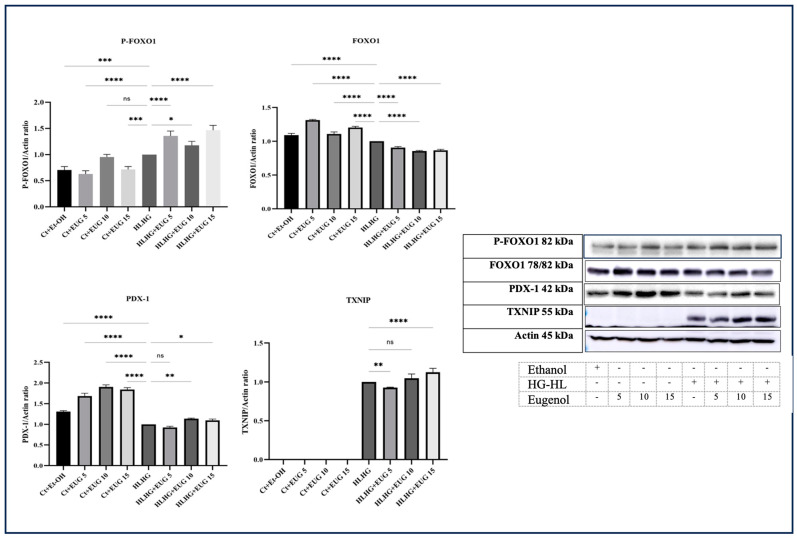
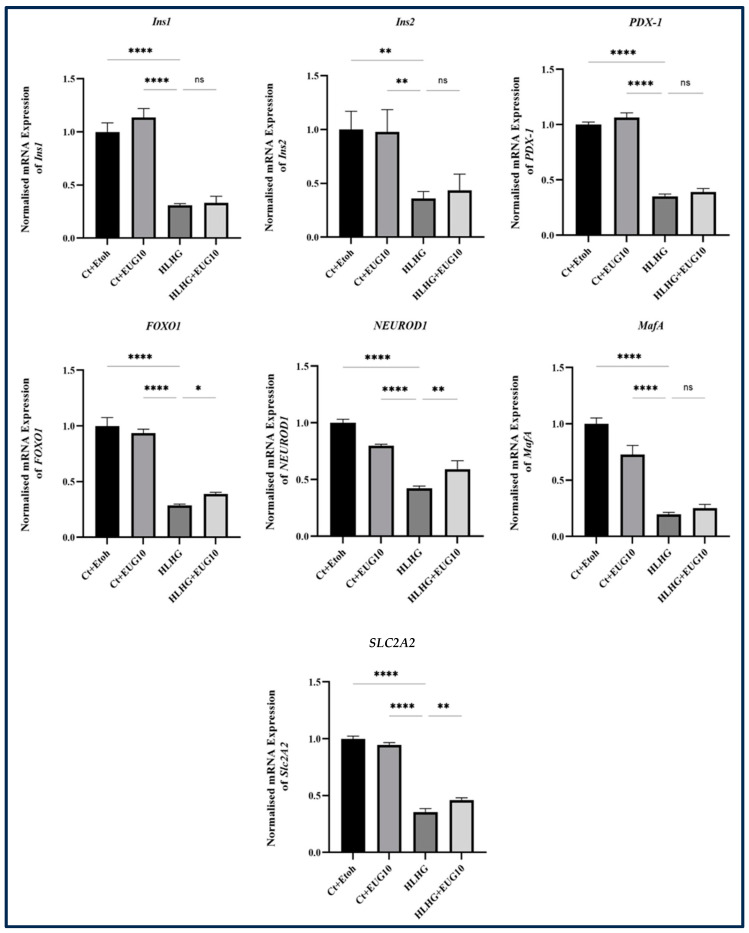
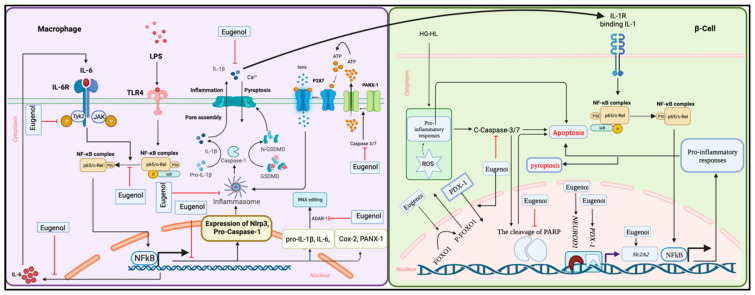
Inflammation is a natural immune response to injury, infection, or tissue damage. It plays a crucial role in maintaining overall health and promoting healing. However, when inflammation becomes chronic and uncontrolled, it can contribute to the development of various inflammatory conditions, including type 2 diabetes. In type 2 diabetes, pancreatic β-cells have to overwork and the continuous impact of a high glucose, high lipid (HG-HL) diet contributes to their loss and dedifferentiation. This study aimed to investigate the anti-inflammatory effects of eugenol and its impact on the loss and dedifferentiation of β-cells. THP-1 macrophages were pretreated with eugenol for one hour and then exposed to lipopolysaccharide (LPS) for three hours to induce inflammation. Additionally, the second phase of NLRP3 inflammasome activation was induced by incubating the LPS-stimulated cells with adenosine triphosphate (ATP) for 30 min. The results showed that eugenol reduced the expression of proinflammatory genes, such as IL-1β, IL-6 and cyclooxygenase-2 (COX-2), potentially by inhibiting the activation of transcription factors NF-κB and TYK2. Eugenol also demonstrated inhibitory effects on the levels of NLRP3 mRNA and protein and Pannexin-1 (PANX-1) activation, eventually impacting the assembly of the NLRP3 inflammasome and the production of mature IL-1β. Additionally, eugenol reduced the elevated levels of adenosine deaminase acting on RNA 1 (ADAR1) transcript, suggesting its role in post-transcriptional mechanisms that regulate inflammatory responses. Furthermore, eugenol effectively decreased the loss of β-cells in response to HG-HL, likely by mitigating apoptosis. It also showed promise in suppressing HG-HL-induced β-cell dedifferentiation by restoring β-cell-specific biomarkers. Further research on eugenol and its mechanisms of action could lead to the development of therapeutic interventions for inflammatory disorders and the preservation of β-cell function in the context of type 2 diabetes.

Keywords: T2DM; cell viability; eugenol; high glucose; high lipid; inflammation; macrophage; β-cell.


Conflict of interest statement

The authors declare no conflict of interest. The funders had no role in the design of the study; in the collection, analyses, or interpretation of data; in the writing of the manuscript; or in the decision to publish the results.

Figures

Figure 1
Figure 1
Impact of eugenol treatment on the viability of LA-induced macrophages. THP-1 macrophages were seeded in a 96-well plate and pretreated with three different doses of eugenol before incubation with LPS and ATP, as described elsewhere (see Methods). The treated cells were then incubated with MTT reagent for 4 h, followed by the addition of a resolving solution. The data are shown as the mean value with SD, n = 3. The abbreviations used in the figure are as follows: Ct + Et-OH (control + ethanol) and LA (LPS + ATP). The asterisks show significant difference: 4 asterisks—p < 0.0001; ns—nonsignificant.
Figure 2
Figure 2
The Western blot analysis of IL-6, TNF-α, and COX-2 in THP-1 macrophages in response to eugenol. THP-1 macrophages pretreated with eugenol were exposed to LPS for 4 h, followed by cellular lysate preparation for Western blot analysis. Eugenol reduced the levels of IL-6 mature TNF-α. All data are presented as mean value +/− SD, n = 3 measurements. Abbreviation: Ct + Et-OH (control + ethanol), Ct + EUG (control + eugenol), LPS + EUG (LPS + eugenol). The asterisks show significant difference: one—p < 0.05; two—p < 0.01; four—p < 0.0001; ns—nonsignificant.
Figure 3
Figure 3
Western blot analysis of pro-IL-1β, mature IL-1β, and NLRP3 in response to eugenol in both LA-induced and uninduced THP-1 macrophages. The response of pro-IL-1β, mature IL-1β, and NLRP3 proteins to three doses of eugenol in both LA-induced and uninduced THP-1 macrophages was determined by Western blot analysis. All data are presented as mean value +/− SD, n = 3 measurements. Abbreviation: Ct + Et-OH (control + ethanol), Ct + EUG (control + eugenol), LPS + EUG (LPS + eugenol), LA (LPS + ATP). The asterisks show significant difference: three—p < 0.001, four—p < 0.0001; ns—nonsignificant.
Figure 4
Figure 4
Western blot analysis of P-NF-κB P65 (Ser536), NF-κB P65, and P-NF-κB P65 (Ser536)/NFκB P65 in LA-induced and uninduced THP-1 macrophages treated with eugenol. Western blot analysis was performed to determine the impact of eugenol on the levels of P-NF-κB P65 (Ser536) and P-NF-κB P65 (Ser536)/NF-κB P65 in THP-1 macrophages induced by LPS. All data are presented as mean value ± SD, n = 3 measurements. Abbreviation: Ct + Et-OH (control + ethanol), Ct + EUG (control + eugenol), LPS + EUG (LPS + eugenol). The asterisks show significant difference, where three—p < 0.001; four—p < 0.0001; ns—nonsignificant.
Figure 5
Figure 5
The response of cleaved PANX-1 (C-PANX-1) to three doses of eugenol in both LA-induced and uninduced THP-1 macrophages. Western blot analysis was performed to determine the effect of eugenol on the elevated level of C-PANX-1 (PANX-1 C-terminal) in THP-1 macrophages stimulated with LPS. All data are presented as mean value ± SD, n = 3 measurements. Abbreviation: Ct + Et-OH (control + ethanol), Ct + EUG (control + eugenol), LPS + EUG (LPS + eugenol). The asterisks show significant difference, where three—p < 0.001; four—p < 0.0001.
Figure 6
Figure 6
The Western blot analysis of P-STAT3, total STAT3, P-TYK2, and TYK2 in response to eugenol in both LA-induced and uninduced THP-1 macrophages. (a) The levels of P-STAT3 and total-STAT3 proteins in both LA-induced and uninduced THP-1 macrophages upon eugenol treatment. (b) The levels of P-TYK2 and TYK2 proteins in both LA-induced and uninduced THP-1 macrophages upon eugenol treatment. All data are presented as mean value ± SD. Abbreviation: Ct + Et-OH (control + ethanol), Ct + EUG (control + eugenol), LPS + EUG (LPS + eugenol). The asterisks show significant difference: one—p < 0.05; three—p < 0.001; four—p < 0.0001; ns—nonsignificant.
Figure 6
Figure 6
The Western blot analysis of P-STAT3, total STAT3, P-TYK2, and TYK2 in response to eugenol in both LA-induced and uninduced THP-1 macrophages. (a) The levels of P-STAT3 and total-STAT3 proteins in both LA-induced and uninduced THP-1 macrophages upon eugenol treatment. (b) The levels of P-TYK2 and TYK2 proteins in both LA-induced and uninduced THP-1 macrophages upon eugenol treatment. All data are presented as mean value ± SD. Abbreviation: Ct + Et-OH (control + ethanol), Ct + EUG (control + eugenol), LPS + EUG (LPS + eugenol). The asterisks show significant difference: one—p < 0.05; three—p < 0.001; four—p < 0.0001; ns—nonsignificant.
Figure 7
Figure 7
The qRT-PCR analysis of IL-1β, IL-6, pro-TNFα, COX-2, NLRP3, PANX-1, P2X7, ADAR-1, and Pro-Caspase-1 in response to eugenol in both LPS-induced and uninduced THP-1 macrophages. The normalized mRNA expression levels of IL-1β, IL-6, pro-TNFα, COX-2, NLRP3, PANX-1, P2X7, ADAR-1, and Pro-Caspase-1 were assessed in response to three doses of eugenol in both LPS-induced and uninduced THP-1 macrophages. GAPDH and β-Actin were used as control genes to normalize the transcript levels. All data are presented as mean value ± SD, n = 3. Abbreviations: Ct: control, Meth: methanol, EUG: eugenol, Et-OH: ethanol. The asterisks show significant difference: one—p < 0.05; two—p < 0.01; three—p < 0.001; four—p < 0.0001; ns—nonsignificant.
Figure 8
Figure 8
The effect of eugenol on IL-1β secretion in LA-induced and uninduced THP-1 macrophages. The impact of eugenol at doses of 5, 10, and 15 μM on the secretion of IL-1β in both LA-induced and uninduced THP-1 macrophages was measured using ELISA. All data are presented as mean value +/− SD, n = 3 measurements. Abbreviation: LA (LPS + ATP), Ct + Et-OH (control + ethanol), EUG (eugenol). The asterisks show significant difference, p < 0.0001.
Figure 9
Figure 9
The effect of 10 μM eugenol on the viability of β-cells under HG-HL conditions for a duration of 6 days. INS-1 832/13 rat insulinoma cells were seeded in 96-well plates and then incubated with 10 μM eugenol and/or HG-HL conditions for specific time periods. After each time point, cells were treated with an MTT reagent for four hours, followed by incubation in solubilization buffer for the next 24 h. All data are presented as the mean value ± SD, n = 3 measurements. Abbreviations: Ct + Meth: control + methanol, HG-HL: high glucose-high lipid, Ct + Et-OH: control + ethanol. The asterisks show significant difference: one—p < 0.05; three—p < 0.001; two—p < 0.01; four—p < 0.0001; ns—nonsignificant.
Figure 10
Figure 10
The Western blot analysis of some crucial apoptotic biomarkers in response to eugenol. INS-1 832/13 rat insulinoma cells were incubated with 10 μM eugenol and/or HG-HL conditions for 48 h, followed by cell lysate preparation for subsequent Western blot analysis. The response of pro-caspase-7, pro-caspase-3, C-caspase-3, C-PARP, and the C-caspase-3/pro-caspase-3 ratio to 10 μM eugenol in both HG-HL-induced and uninduced β-cells was determined using Western blot analysis. All data are presented as the mean value ± SD, n = 3 measurements. Abbreviations: Ct + Et-OH (control + ethanol), HG-HL (high glucose-high lipid), EUG (eugenol). The asterisks show significant difference: one—p < 0.05; two—p < 0.01; three—p < 0.001; four—p < 0.0001; ns—nonsignificant.
Figure 11
Figure 11
The results of GSIS assay conducted on HG-HL-induced β-cells treated with 10 μM eugenol. The GSIS response of HG-HL-induced β-cells to eugenol in medium containing 2.5 mM glucose (to simulate fasting blood glucose) and 16.5 mM glucose (to simulate postprandial blood glucose) was conducted as detailed in “Materials and Methods”. All data are presented as the mean value ± SD, n = 3 measurements. Abbreviations: Ct + Et-OH (control + ethanol) and HG-HL (high glucose-high lipid), EUG (eugenol). The asterisks show significant difference: four—p < 0.0001; ns—nonsignificant.
Figure 12
Figure 12
The Western blot analysis of P-FOXO1, FOXO1, PDX-1, and TXNIP in response to eugenol in both HG-HL-induced and uninduced β-cells. The Western blot analysis was conducted to determine the levels of P-FOX1, FOX1, PDX-1, and TXNIP in HG-HL-induced and uninduced β-cells in response to eugenol. All data are presented as the mean value ± SD, n = 3 measurements. Ct + Et-OH (control + ethanol) and HG-HL (high glucose-high lipid), EUG (eugenol). The asterisks show significant difference: one—p < 0.05; two—p < 0.01; three—p < 0.001; four—p < 0.0001; ns—nonsignificant.
Figure 13
Figure 13
The response of key transcripts involved in β-cell dedifferentiation to 10 µM eugenol in both HG-HL induced and uninduced β-cells. The normalized mRNA levels of Ins1, Ins2, PDX-1, FOXO1, NEUROD1, MafA, and SLC2A2 in both HG-HL-induced and uninduced β-cells treated with 10 µM eugenol were measured using qRT-PCR. α-Tubulin was used as control gene to normalize the transcript levels. All data are presented as the mean value ± SD, n = 3. Abbreviations: Ct + Et-OH (C=control + ethanol) and HG-HL (high glucose-high lipid), EUG (eugenol). The asterisks show significant difference: one—p < 0.05; two—p < 0.01; four—p < 0.0001; ns—nonsignificant.
Figure 14
Figure 14
Eugenol mitigates β-cell loss by suppressing inflammatory responses in infiltrating pancreatic macrophages and β-cell apoptosis. Eugenol exerts its anti-inflammatory effects on macrophages stimulated by LPS by mitigating the activity of NFκB, resulting in the downregulation of proinflammatory cytokines/genes such as IL-1β, IL-6, COX-2, NLRP3, pro-caspase-1, and PANX-1. The mitigation of IL-6/P-TYK2 could be a significant factor in how eugenol inhibits the activation of NFκB. Notably, the inhibition of PANX-1 cleavage and opening by eugenol may play a crucial role in the suppressing effect of eugenol on the NLRP3 inflammasome, pro-caspase-1 activation, and the subsequent production and release of mature IL-1β. This inhibitory impact of eugenol on IL-1β secretion by infiltrating macrophages can indirectly reduce β-cell loss. Furthermore, eugenol exhibits potential in downregulating β-cell loss induced by high glucose and high lipid levels, potentially through the regulation of apoptosis biomarkers. Additionally, eugenol restores decreased levels of NEUROD1 and SLC2A2 transcripts and PDX-1 protein in β-cells exposed to high glucose and high lipid conditions, indicating its potential to counteract β-cell dedifferentiation. Eugenol’s inhibitory effects on β-cell dedifferentiation in high glucose and high lipid conditions also involve the stimulation of P-FOXO1, leading to the nuclear localization of PDX-1.

Similar articles

Cited by

References

    1. Srinivasan S., Sathish G., Jayanthi M., Muthukumaran J., Muruganathan U., Ramachandran V. Ameliorating effect of eugenol on hyperglycemia by attenuating the key enzymes of glucose metabolism in streptozotocin-induced diabetic rats. Mol. Cell. Biochem. 2014;385:159–168. doi: 10.1007/s11010-013-1824-2. - DOI - PubMed
    1. Holt R.I., Cockram C., Flyvbjerg A., Goldstein B.J. Textbook of Diabetes. John Wiley & Sons; Hoboken, NJ, USA: 2017.
    1. Trøseid M., Nestvold T.K., Rudi K., Thoresen H., Nielsen E.W., Lappegård K.T. Plasma lipopolysaccharide is closely associated with glycemic control and abdominal obesity: Evidence from bariatric surgery. Diabetes Care. 2013;36:3627–3632. doi: 10.2337/dc13-0451. - DOI - PMC - PubMed
    1. Teixeira T.F., Collado M.C., Ferreira C.L., Bressan J., Maria do Carmo G.P. Potential mechanisms for the emerging link between obesity and increased intestinal permeability. Nutr. Res. 2012;32:637–647. doi: 10.1016/j.nutres.2012.07.003. - DOI - PubMed
    1. Nordmann T.M., Dror E., Schulze F., Traub S., Berishvili E., Barbieux C., Böni-Schnetzler M., Donath M.Y. The role of inflammation in β-cell dedifferentiation. Sci. Rep. 2017;7:6285. doi: 10.1038/s41598-017-06731-w. - DOI - PMC - PubMed

MeSH terms

Grants and funding