

Soil Particle Size Thresholds in Soil Spectroscopy and Its Effect on the Multivariate Models for the Analysis of Soil Properties
- PMID: 38005556
- PMCID: PMC10675472
- DOI: 10.3390/s23229171
Soil Particle Size Thresholds in Soil Spectroscopy and Its Effect on the Multivariate Models for the Analysis of Soil Properties
Abstract
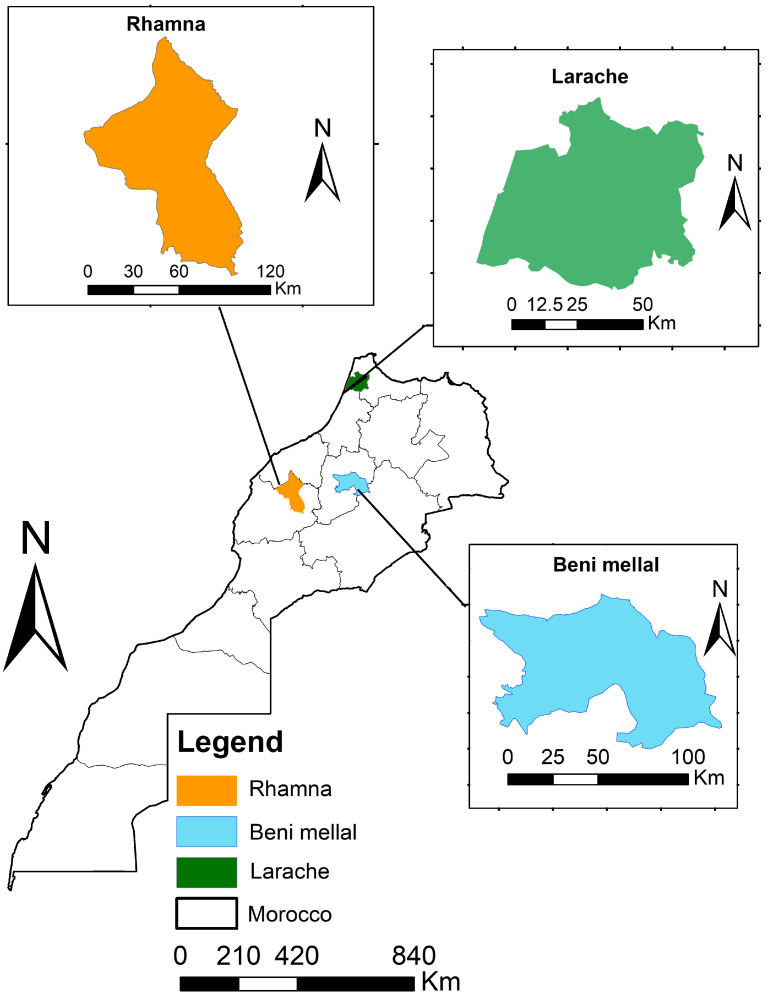
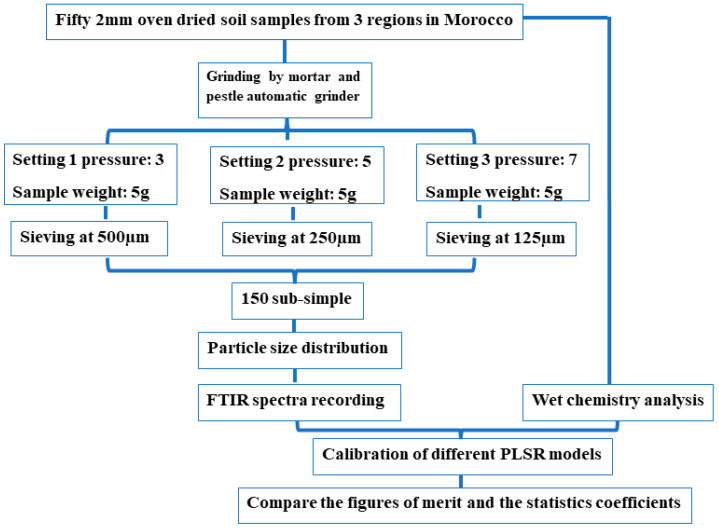
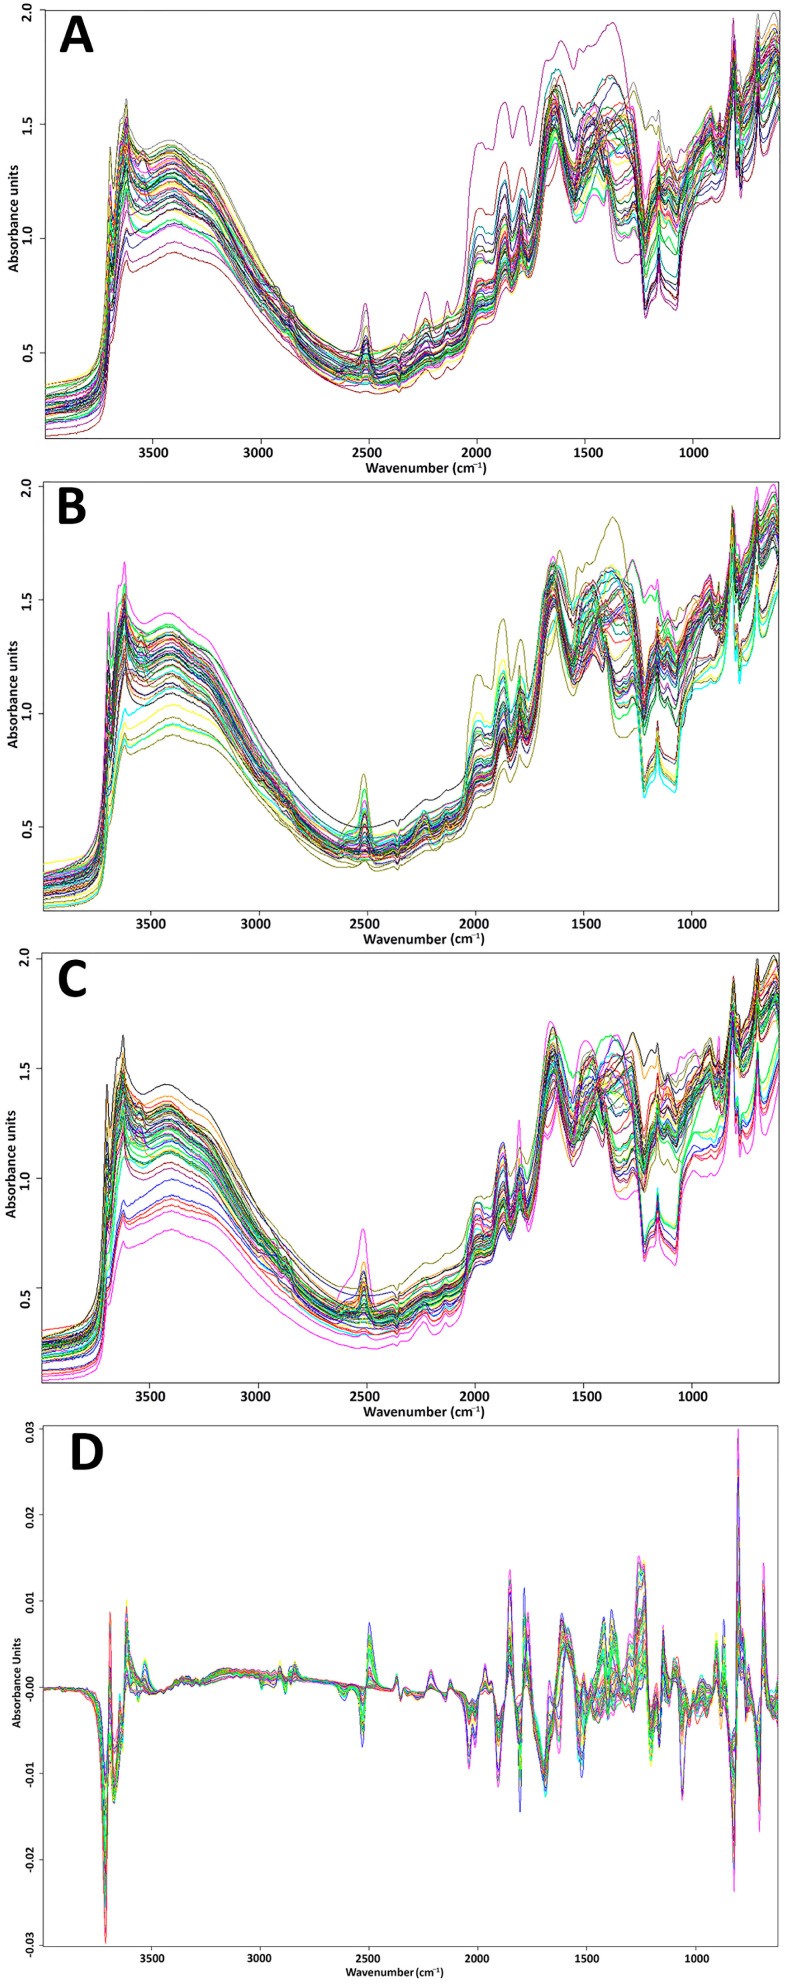
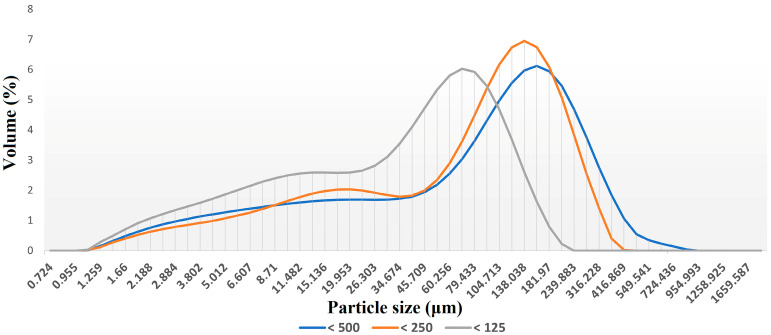
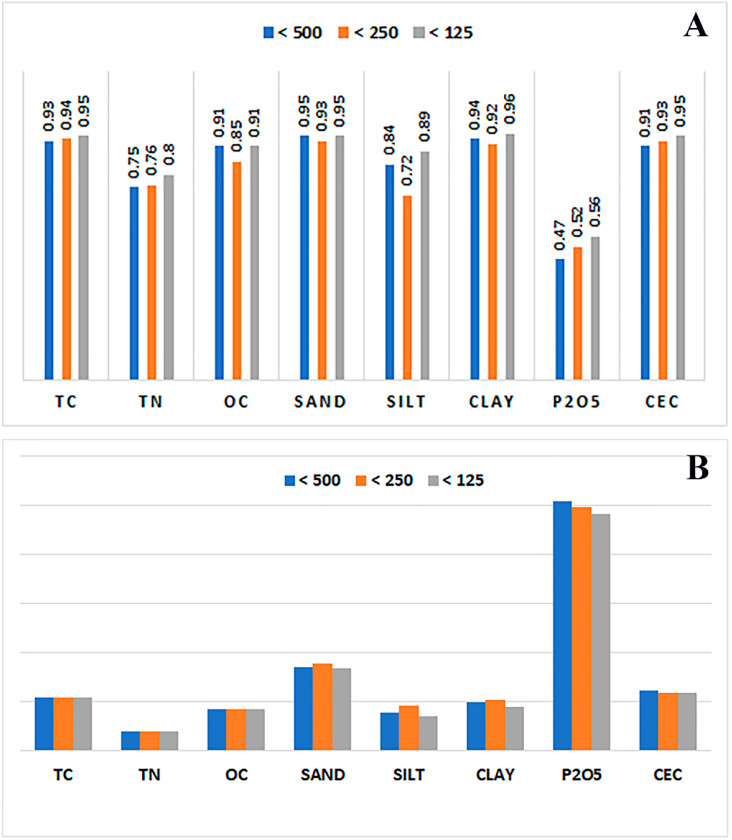
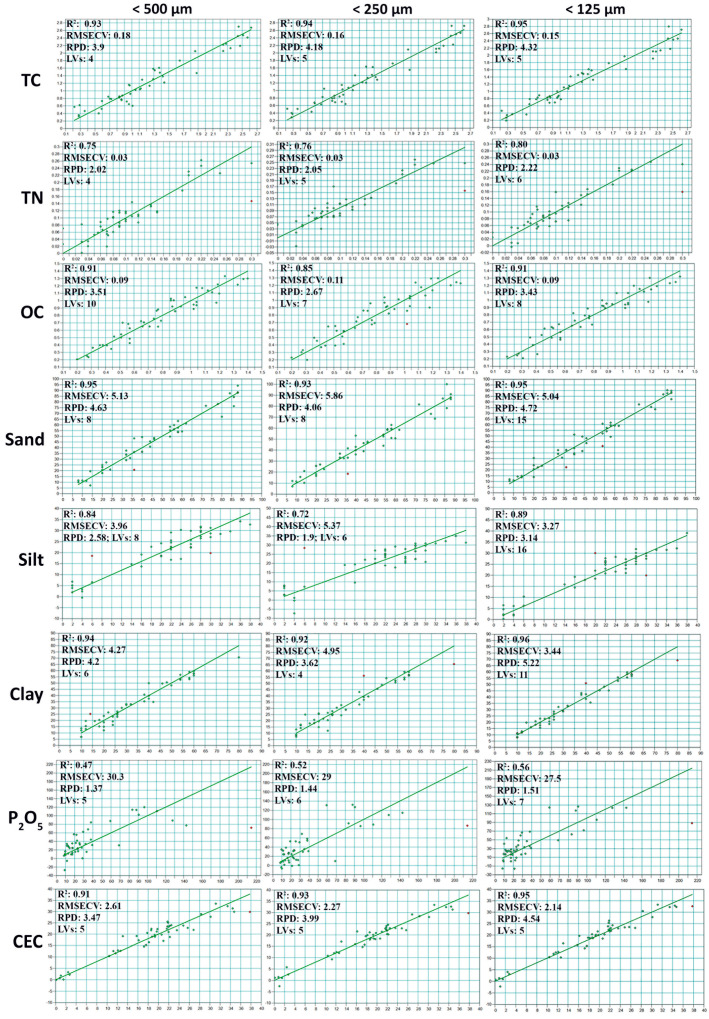
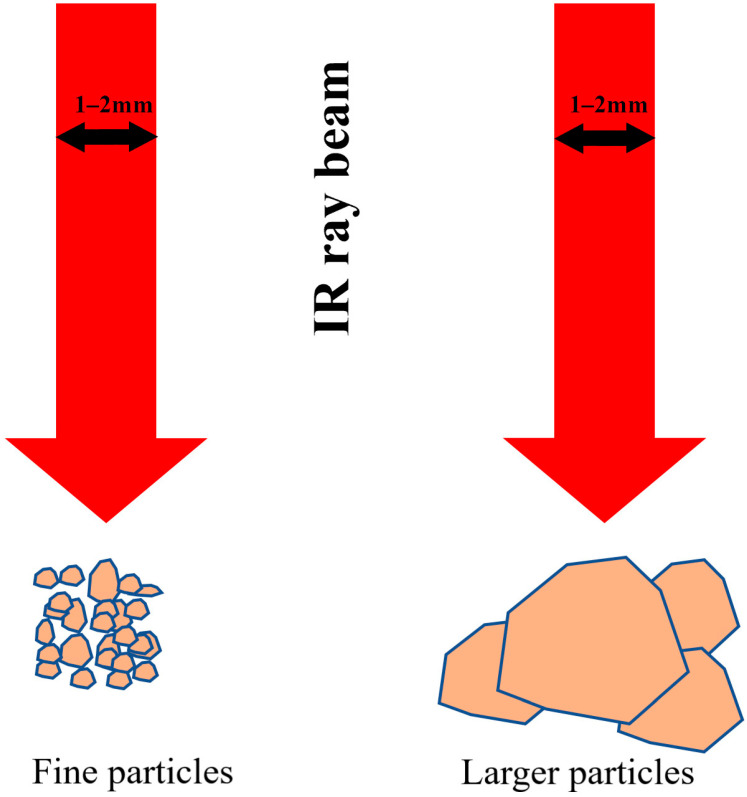
This study focused on one of the few but critical sample preparations required in soil spectroscopy (i.e., grinding), as well as the effect of soil particle size on the FTIR spectral database and the partial least squares regression models for the prediction of eight soil properties (viz., TC, TN, OC, sand, silt, clay, Olsen P, and CEC). Fifty soil samples from three Moroccan region were used. The soil samples underwent three preparations (drying, grinding, sieving) to obtain, at the end of the sample preparation step, three ranges of particle size, samples with sizes < 500 µm, samples with sizes < 250 µm, and a third range with particles < 125 µm. The multivariate models (PLSR) were set up based on the FTIR spectra recorded on the different obtained samples. The correlation coefficient (R2) and the root mean squared error of cross validation (RMSECV) were chosen as figures of merit to assess the quality of the prediction models. The results showed a general trend in improving the R2 as the finer particles were used (from <500 µm to 125 µm), which was clearly observed for TC, TN, P2O5, and CEC, whereas the cross-validation errors (RMSECV) showed an opposite trend. This confirmed that fine soil grinding improved the accuracy of predictive models for soil properties diagnosis in soil spectroscopy.
Keywords: FTIR; partial least squares regression; particle size; soil properties.
Conflict of interest statement
The authors declare no conflict of interest.
Figures
Similar articles
-
Optimizing setup of scan number in FTIR spectroscopy using the moment distance index and PLS regression: application to soil spectroscopy.Sci Rep. 2021 Jun 25;11(1):13358. doi: 10.1038/s41598-021-92858-w. Sci Rep. 2021. PMID: 34172802 Free PMC article.
-
A comparative study of MIR and NIR spectral models using ball-milled and sieved soil for the prediction of a range soil physical and chemical parameters.Spectrochim Acta A Mol Biomol Spectrosc. 2022 Oct 15;279:121441. doi: 10.1016/j.saa.2022.121441. Epub 2022 May 30. Spectrochim Acta A Mol Biomol Spectrosc. 2022. PMID: 35667135
-
Predicting Soil Properties and Interpreting Vis-NIR Models from across Continental United States.Sensors (Basel). 2022 Apr 21;22(9):3187. doi: 10.3390/s22093187. Sensors (Basel). 2022. PMID: 35590876 Free PMC article.
-
Predicting field capacity, wilting point, and the other physical properties of soils using hyperspectral reflectance spectroscopy: two different statistical approaches.Environ Monit Assess. 2014 Aug;186(8):5077-88. doi: 10.1007/s10661-014-3761-2. Epub 2014 Apr 9. Environ Monit Assess. 2014. PMID: 24715616
-
Improved multivariate modeling for soil organic matter content estimation using hyperspectral indexes and characteristic bands.PLoS One. 2023 Jun 14;18(6):e0286825. doi: 10.1371/journal.pone.0286825. eCollection 2023. PLoS One. 2023. PMID: 37315071 Free PMC article.
References
-
- Pepper I.L., Brusseau M.L. Physical-Chemical Characteristics of Soils and the Subsurface. 3rd ed. Elsevier Inc.; Amsterdam, The Netherlands: 2019. - DOI
-
- Morvan X., Saby N.P.A., Arrouays D., Le Bas C., Jones R.J.A., Verheijen F.G.A., Bellamy P.H., Stephens M., Kibblewhite M.G. Soil monitoring in Europe: A review of existing systems and requirements for harmonisation. Sci. Total Environ. 2008;391:1–12. doi: 10.1016/j.scitotenv.2007.10.046. - DOI - PubMed
-
- Sepahvand H., Mirzaeitalarposhti R., Beiranvand K. Prediction of soil carbon levels in calcareous soils of Iran by mid-infrared reflectance spectroscopy. Environ. Pollut. Bioavailab. 2019;31:9–17. doi: 10.1080/09542299.2018.1549961. - DOI
-
- Nelson W.L., Fitts J.W., Kardos L.T., McGeorge W.T., Parks R.Q., Reed J.F. Soil Testing in the United States. US Government Printing Office; Washington, DC, USA: 1951.
-
- Bray R.H. Correlation of soil tests with crop response to added fertilizers and with fertilizer requirement. In: Kitchen B., editor. Diagnostic Techniques for Soils and Crops. American Potash Institute; Washington, DC, USA: 1948. pp. 53–86.
Grants and funding
LinkOut - more resources
Full Text Sources
