

Seaweed Growth Monitoring with a Low-Cost Vision-Based System
- PMID: 38005584
- PMCID: PMC10674634
- DOI: 10.3390/s23229197
Seaweed Growth Monitoring with a Low-Cost Vision-Based System
Abstract
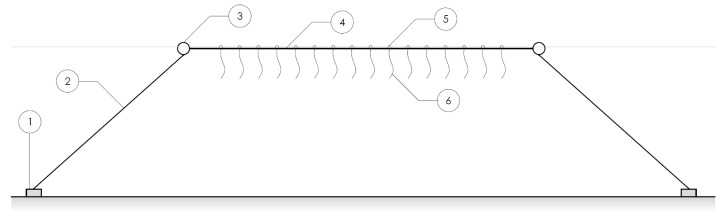
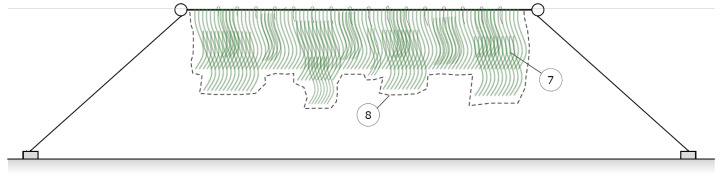
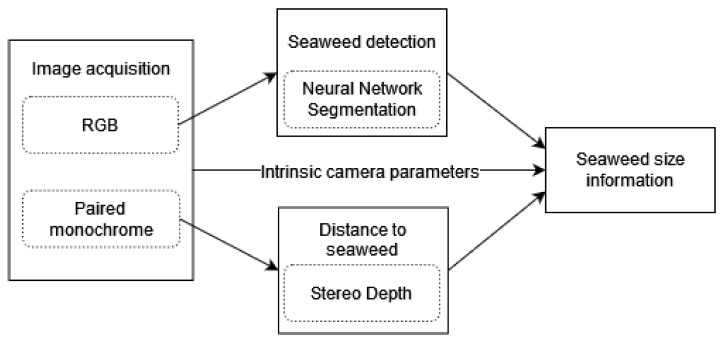
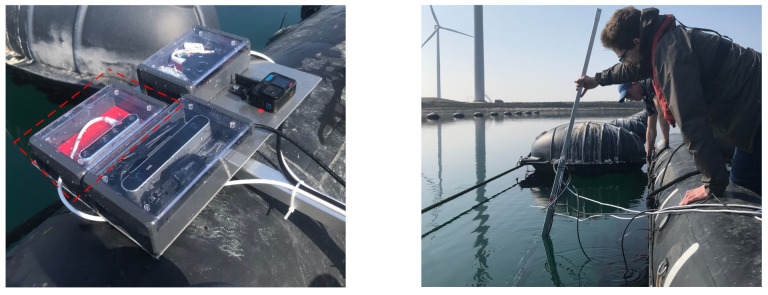
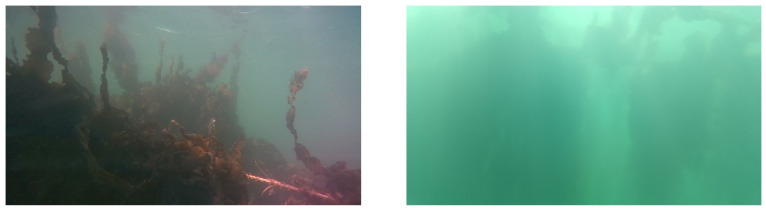
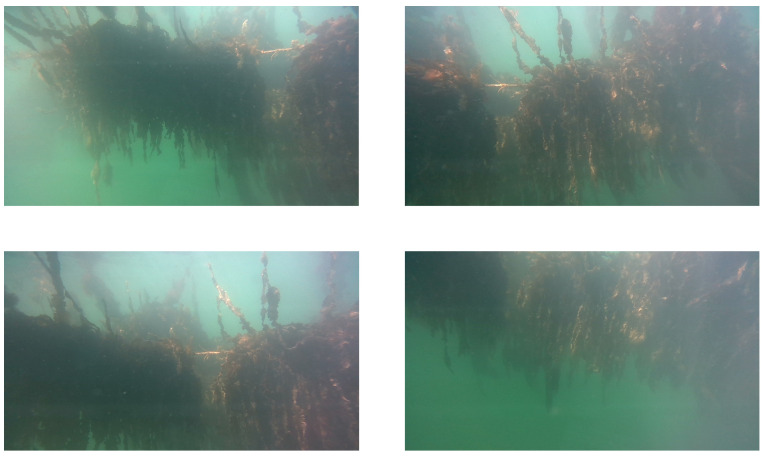
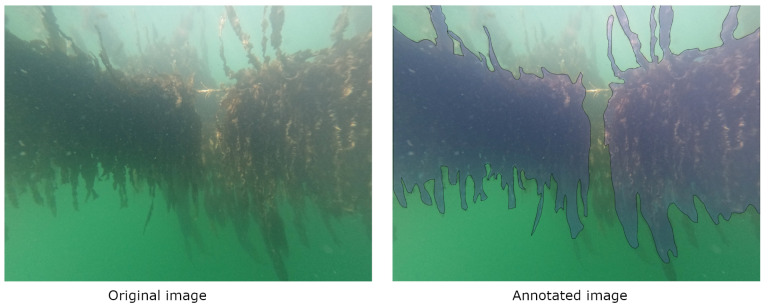
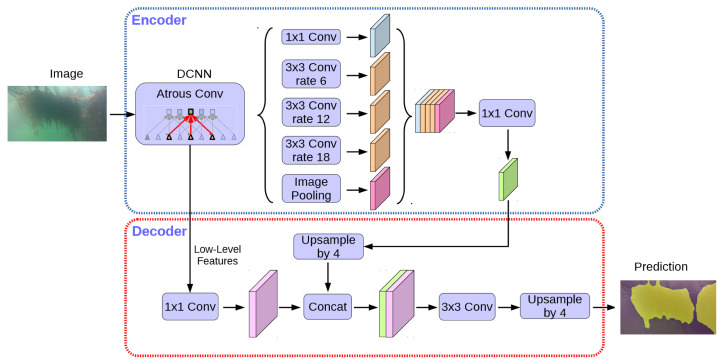
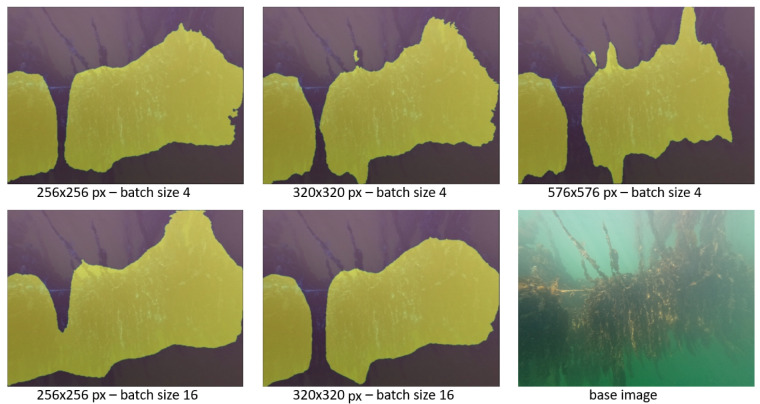
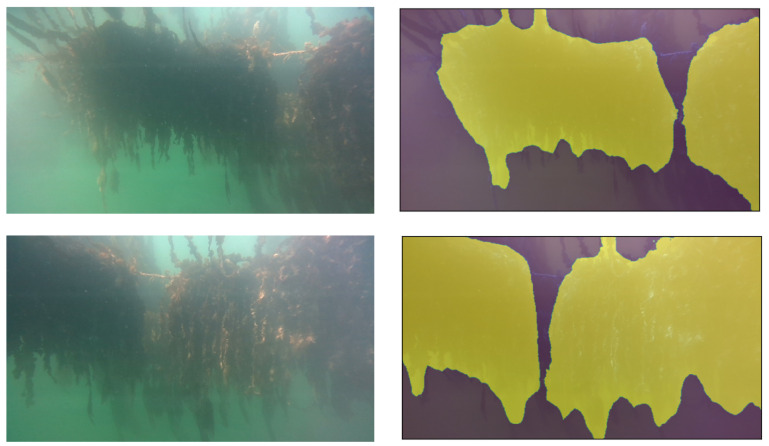
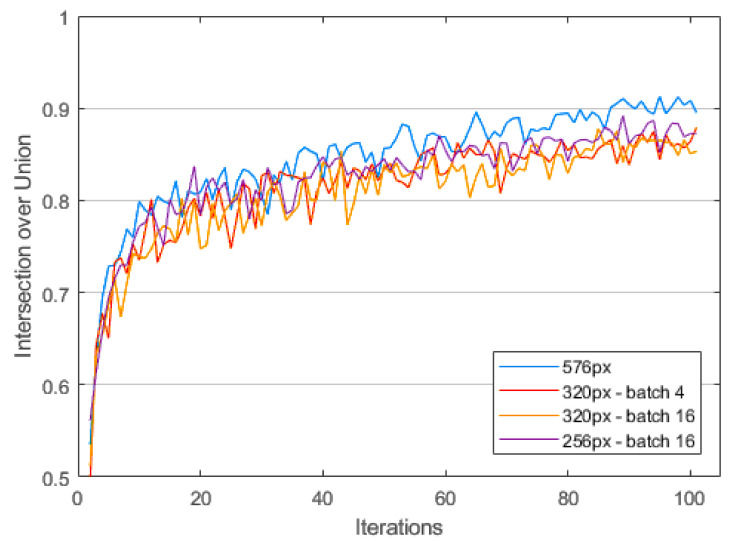
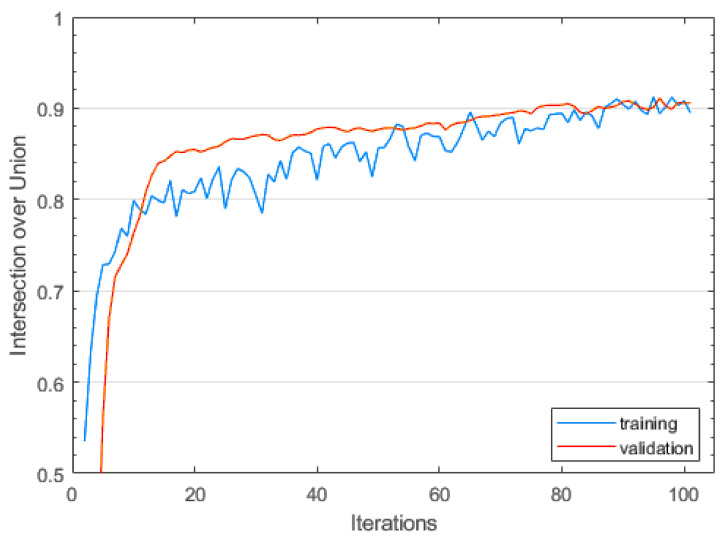
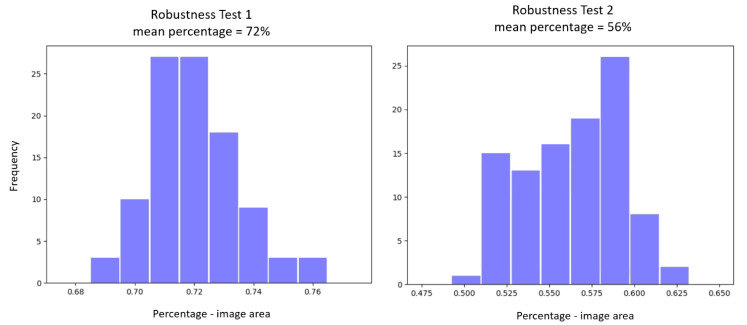
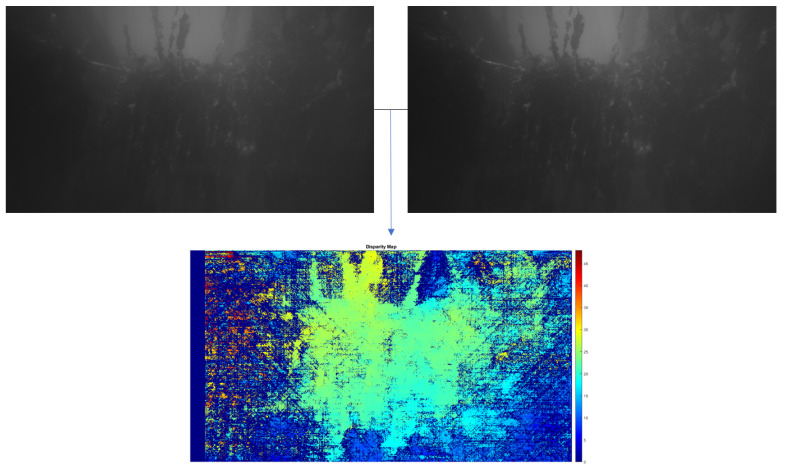
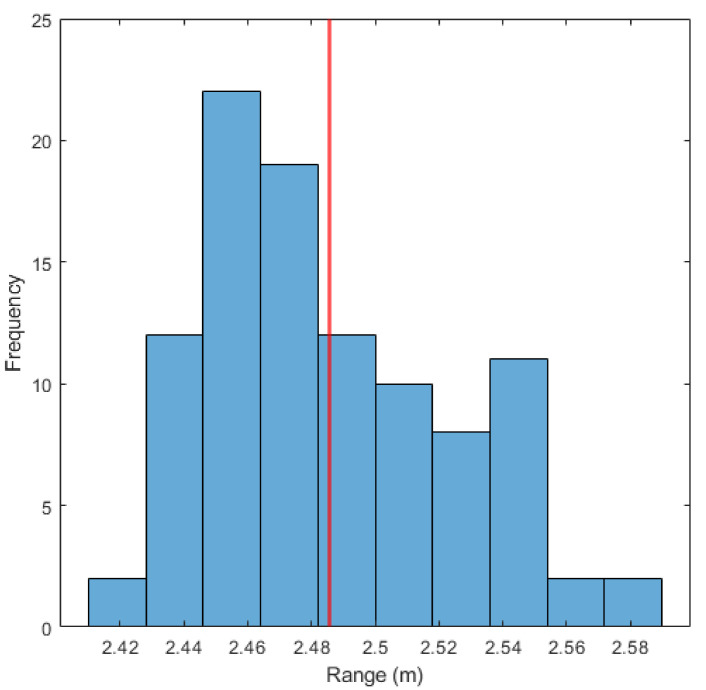
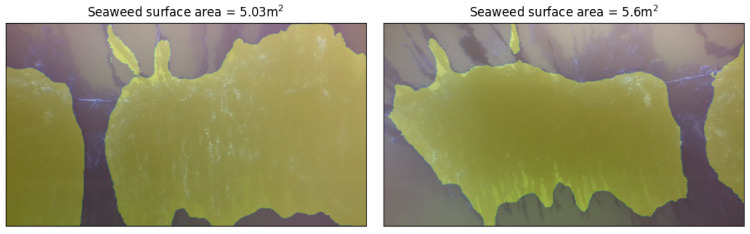
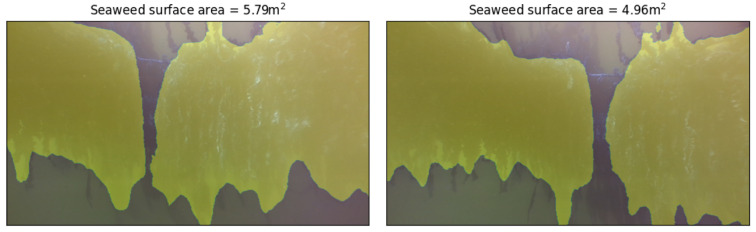
In this paper, we introduce a method for automated seaweed growth monitoring by combining a low-cost RGB and stereo vision camera. While current vision-based seaweed growth monitoring techniques focus on laboratory measurements or above-ground seaweed, we investigate the feasibility of the underwater imaging of a vertical seaweed farm. We use deep learning-based image segmentation (DeeplabV3+) to determine the size of the seaweed in pixels from recorded RGB images. We convert this pixel size to meters squared by using the distance information from the stereo camera. We demonstrate the performance of our monitoring system using measurements in a seaweed farm in the River Scheldt estuary (in The Netherlands). Notwithstanding the poor visibility of the seaweed in the images, we are able to segment the seaweed with an intersection of the union (IoU) of 0.9, and we reach a repeatability of 6% and a precision of the seaweed size of 18%.
Keywords: aquaculture; image segmentation; seaweed monitoring; underwater stereo imaging.
Conflict of interest statement
The authors declare no conflict of interest. The funders had no role in the design of the study; in the collection, analyses, or interpretation of data; in the writing of the manuscript; or in the decision to publish the results. Author Dennis G. Kooijman was employed by the company Intelligent Autonomous Mobility Center. Author Ivo W. Wieling was employed by the company Aqitec. The remaining authors declare that the research was conducted in the absence of any commercial or financial relationships that could be construed as a potential conflict of interest.
Figures
Similar articles
-
A Two-Mode Underwater Smart Sensor Object for Precision Aquaculture Based on AIoT Technology.Sensors (Basel). 2022 Oct 7;22(19):7603. doi: 10.3390/s22197603. Sensors (Basel). 2022. PMID: 36236700 Free PMC article.
-
WE3DS: An RGB-D Image Dataset for Semantic Segmentation in Agriculture.Sensors (Basel). 2023 Mar 1;23(5):2713. doi: 10.3390/s23052713. Sensors (Basel). 2023. PMID: 36904917 Free PMC article.
-
Nutrient removal from Chinese coastal waters by large-scale seaweed aquaculture.Sci Rep. 2017 Apr 21;7:46613. doi: 10.1038/srep46613. Sci Rep. 2017. PMID: 28429792 Free PMC article.
-
Global unbalance in seaweed production, research effort and biotechnology markets.Biotechnol Adv. 2014 Sep-Oct;32(5):1028-36. doi: 10.1016/j.biotechadv.2014.05.002. Epub 2014 May 20. Biotechnol Adv. 2014. PMID: 24858315 Review.
-
A pathway to improve seaweed aquaculture through microbiota manipulation.Trends Biotechnol. 2023 Apr;41(4):545-556. doi: 10.1016/j.tibtech.2022.08.003. Epub 2022 Sep 8. Trends Biotechnol. 2023. PMID: 36089422 Review.
References
-
- European Commission, Directorate General for Maritime Affairs and Fisheries, Joint Research Centre. Addamo A., Calvo Santos A., Guillén J. The EU Blue Economy Report 2022. Publications Office of the European Union; Luxemburg: 2022. - DOI
-
- FOA . Brief to The State of World Fisheries and Aquaculture 2022. Food and Agriculture Organization of the United Nations; Rome, Italy: 2022. - DOI
-
- Campbell I., Macleod A., Sahlmann C., Neves L., Funderud J., Øverland M., Hughes A.D., Stanley M. The Environmental Risks Associated With the Development of Seaweed Farming in Europe—Prioritizing Key Knowledge Gaps. Front. Mar. Sci. 2019;6 doi: 10.3389/fmars.2019.00107. - DOI
-
- Bostock J., Lane A., Hough C., Yamamoto K. An assessment of the economic contribution of EU aquaculture production and the influence of policies for its sustainable development. Aquac. Int. 2016;24:699–733. doi: 10.1007/s10499-016-9992-1. - DOI
MeSH terms
Grants and funding
LinkOut - more resources
Full Text Sources
