

LLM Multimodal Traffic Accident Forecasting
- PMID: 38005612
- PMCID: PMC10674612
- DOI: 10.3390/s23229225
LLM Multimodal Traffic Accident Forecasting
Abstract
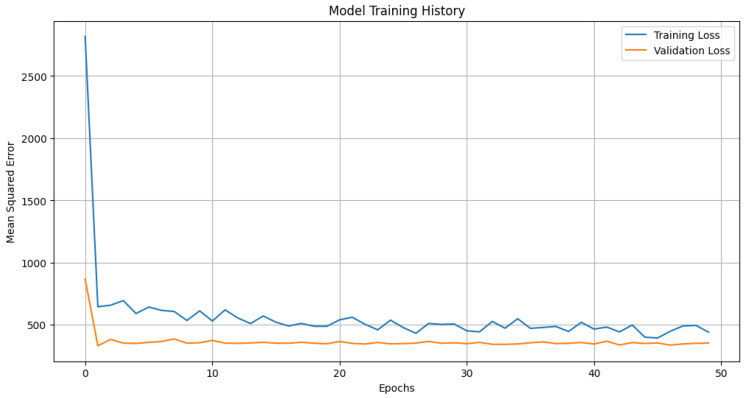
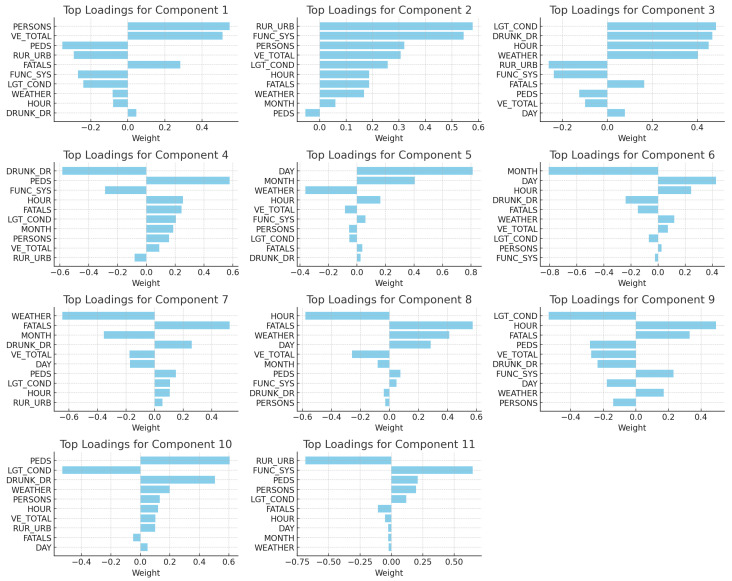
With the rise in traffic congestion in urban centers, predicting accidents has become paramount for city planning and public safety. This work comprehensively studied the efficacy of modern deep learning (DL) methods in forecasting traffic accidents and enhancing Level-4 and Level-5 (L-4 and L-5) driving assistants with actionable visual and language cues. Using a rich dataset detailing accident occurrences, we juxtaposed the Transformer model against traditional time series models like ARIMA and the more recent Prophet model. Additionally, through detailed analysis, we delved deep into feature importance using principal component analysis (PCA) loadings, uncovering key factors contributing to accidents. We introduce the idea of using real-time interventions with large language models (LLMs) in autonomous driving with the use of lightweight compact LLMs like LLaMA-2 and Zephyr-7b-α. Our exploration extends to the realm of multimodality, through the use of Large Language-and-Vision Assistant (LLaVA)-a bridge between visual and linguistic cues by means of a Visual Language Model (VLM)-in conjunction with deep probabilistic reasoning, enhancing the real-time responsiveness of autonomous driving systems. In this study, we elucidate the advantages of employing large multimodal models within DL and deep probabilistic programming for enhancing the performance and usability of time series forecasting and feature weight importance, particularly in a self-driving scenario. This work paves the way for safer, smarter cities, underpinned by data-driven decision making.
Keywords: LLM; LLaVA; PCA loadings; VLM; accident forecasting; time series analysis; transformers.
Conflict of interest statement
The authors declare that they have no conflict of interest. The funders had no role in the design of the study; in the collection, analyses, or interpretation of data; in the writing of the manuscript; or in the decision to publish the results.
Figures


References
-
- Guo Y., Tang Z., Guo J. Could a Smart City Ameliorate Urban Traffic Congestion? A Quasi-Natural Experiment Based on a Smart City Pilot Program in China. Sustainability. 2020;12:2291. doi: 10.3390/su12062291. - DOI
-
- Zonouzi M.N., Kargari M. Modeling uncertainties based on data mining approach in emergency service resource allocation. Comput. Ind. Eng. 2020;145:106485. doi: 10.1016/j.cie.2020.106485. - DOI
-
- Vlahogianni E.I., Karlaftis M.G., Golias J.C. Short-term traffic forecasting: Where we are and where we’re going. Transp. Res. Part Emerg. Technol. 2014;43:3–19. doi: 10.1016/j.trc.2014.01.005. - DOI
-
- Weng W., Fan J., Wu H., Hu Y., Tian H., Zhu F., Wu J. A Decomposition Dynamic graph convolutional recurrent network for traffic forecasting. Pattern Recognit. 2023;142:109670. doi: 10.1016/j.patcog.2023.109670. - DOI
-
- Negash N.M., Yang J. Driver Behavior Modeling Towards Autonomous Vehicles: Comprehensive Review. IEEE Access. 2023;11:22788–22821. doi: 10.1109/ACCESS.2023.3249144. - DOI
Grants and funding
LinkOut - more resources
Full Text Sources
