

A Novel Non-Specific Lipid Transfer Protein Gene, CmnsLTP6.9, Enhanced Osmotic and Drought Tolerance by Regulating ROS Scavenging and Remodeling Lipid Profiles in Chinese Chestnut (Castanea mollissima Blume)
- PMID: 38005813
- PMCID: PMC10675601
- DOI: 10.3390/plants12223916
A Novel Non-Specific Lipid Transfer Protein Gene, CmnsLTP6.9, Enhanced Osmotic and Drought Tolerance by Regulating ROS Scavenging and Remodeling Lipid Profiles in Chinese Chestnut (Castanea mollissima Blume)
Abstract
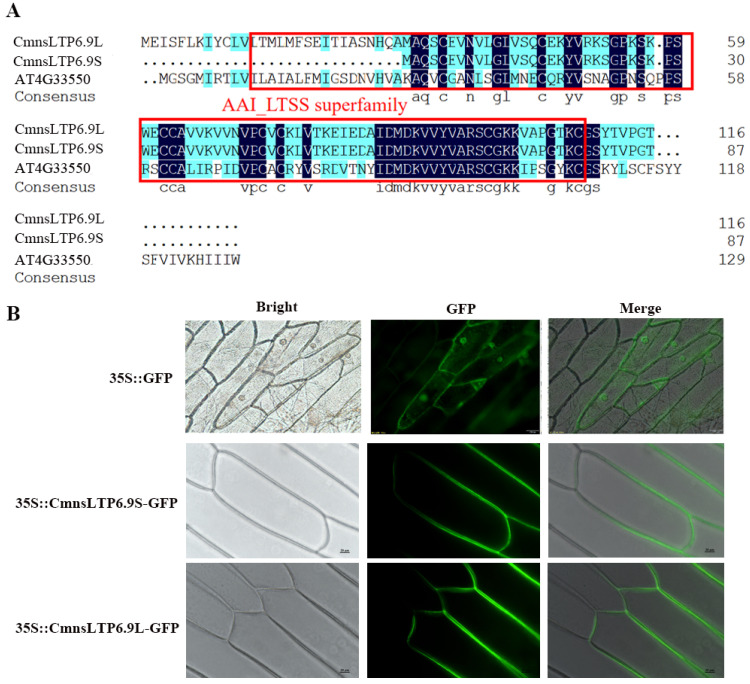
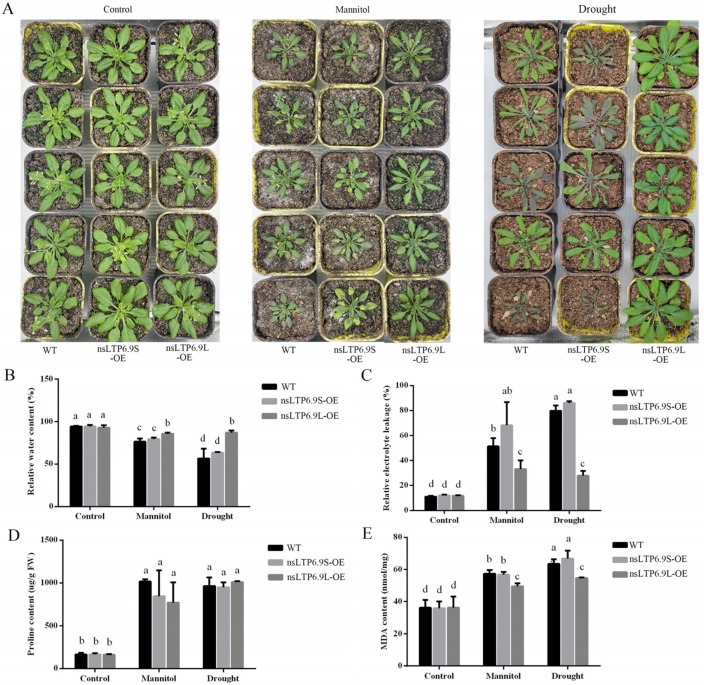
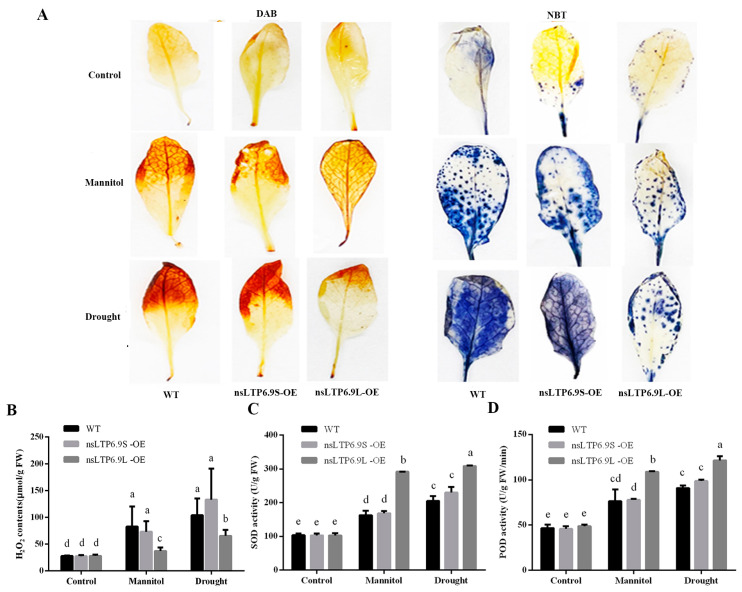
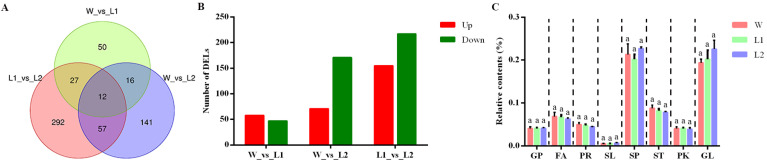
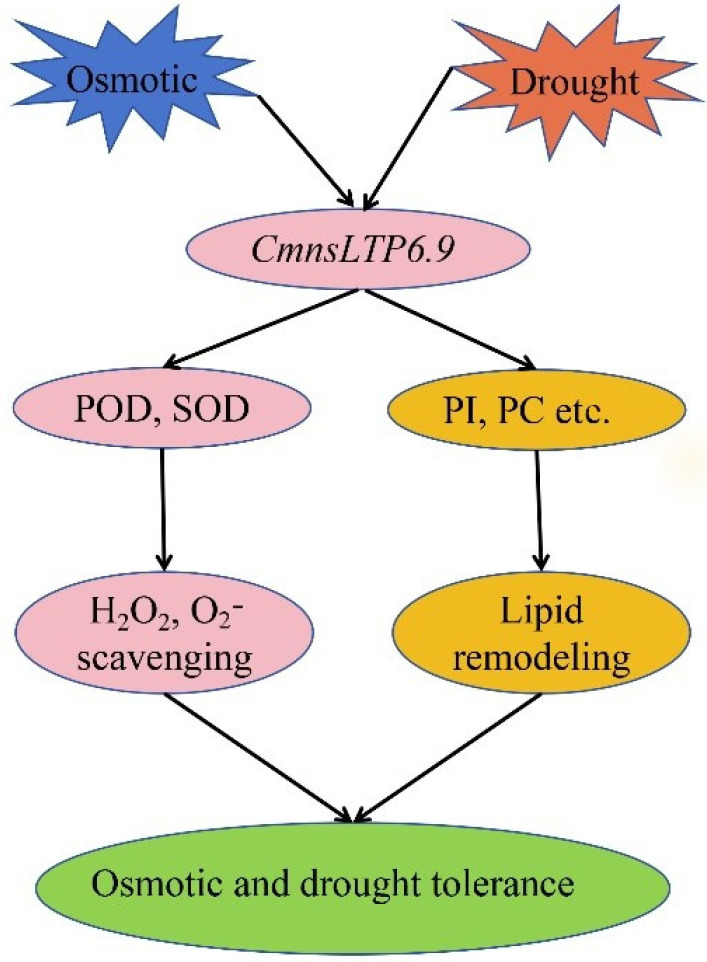
Chestnut (Castanea mollissima Blume) is an important economic tree owing to its tasty fruit and adaptability to environmental stresses, especially drought. Currently, there is limited information about non-specific lipid transfer protein (nsLTP) genes that respond to abiotic stress in chestnuts. Here, a chestnut nsLTP, named CmnsLTP6.9, was identified and analyzed. The results showed that the CmnsLTP6.9 protein localized in the extracellular matrix had two splicing variants (CmnsLTP6.9L and CmnsLTP6.9S). Compared with CmnsLTP6.9L, CmnsLTP6.9S had an 87 bp deletion in the 5'-terminal. Overexpression of CmnsLTP6.9L in Arabidopsis enhanced tolerance to osmotic and drought stress. Upon exposure to osmotic and drought treatment, CmnsLTP6.9L could increase reactive oxygen species (ROS)-scavenging enzyme activity, alleviating ROS damage. However, CmnsLTP6.9S-overexpressing lines showed no significant differences in phenotype, ROS content, and related enzyme activities compared with the wild type (WT) under osmotic and drought treatment. Moreover, lipid metabolism analysis confirmed that, unlike CmnsLTP6.9S, CmnsLTP6.9L mainly altered and upregulated many fatty acyls and glycerophospholipids, which implied that CmnsLTP6.9L and CmnsLTP6.9S played different roles in lipid transference in the chestnut. Taken together, we analyzed the functions of CmnsLTP6.9L and CmnsLTP6.9S, and demonstrated that CmnsLTP6.9L enhanced drought and osmotic stress tolerance through ROS scavenging and lipid metabolism.
Keywords: CmnsLTP; CmnsLTP6.9; chestnut; drought; osmotic.
Conflict of interest statement
The authors declare no conflict of interest. The funders had no role in the design of the study; in the collection, analyses, or interpretation of data; in the writing of the manuscript; or in the decision to publish the results.
Figures
Similar articles
-
Overexpression of a Barley Aquaporin Gene, HvPIP2;5 Confers Salt and Osmotic Stress Tolerance in Yeast and Plants.Front Plant Sci. 2016 Oct 21;7:1566. doi: 10.3389/fpls.2016.01566. eCollection 2016. Front Plant Sci. 2016. PMID: 27818670 Free PMC article.
-
Signatures of Selection in the Genomes of Chinese Chestnut (Castanea mollissima Blume): The Roots of Nut Tree Domestication.Front Plant Sci. 2018 Jun 25;9:810. doi: 10.3389/fpls.2018.00810. eCollection 2018. Front Plant Sci. 2018. PMID: 29988533 Free PMC article.
-
[Effects of exogenous methylglyoxal on chesnut seedlings under drought stress].Ying Yong Sheng Tai Xue Bao. 2022 Jan;33(1):104-110. doi: 10.13287/j.1001-9332.202201.021. Ying Yong Sheng Tai Xue Bao. 2022. PMID: 35224931 Chinese.
-
SpBADH of the halophyte Sesuvium portulacastrum strongly confers drought tolerance through ROS scavenging in transgenic Arabidopsis.Plant Physiol Biochem. 2015 Nov;96:377-87. doi: 10.1016/j.plaphy.2015.08.010. Epub 2015 Aug 30. Plant Physiol Biochem. 2015. PMID: 26368017
-
Current Biological Insights of Castanea sativa Mill. to Improve Crop Sustainability to Climate Change.Plants (Basel). 2025 Jan 23;14(3):335. doi: 10.3390/plants14030335. Plants (Basel). 2025. PMID: 39942897 Free PMC article. Review.
Cited by
-
CTB6 Confers Cold Tolerance at the Booting Stage by Maintaining Tapetum Development in Rice.Adv Sci (Weinh). 2025 Mar;12(10):e2411357. doi: 10.1002/advs.202411357. Epub 2025 Jan 22. Adv Sci (Weinh). 2025. PMID: 39840555 Free PMC article.
-
Integrative Transcriptomic and Small RNA Analysis Uncovers Key Genes for Cold Resistance in Rice.Genes (Basel). 2024 Dec 29;16(1):38. doi: 10.3390/genes16010038. Genes (Basel). 2024. PMID: 39858585 Free PMC article.
-
Exploring the Genetic Basis of Drought Tolerance in Alhagi camelorum: A Comprehensive Transcriptome Study of Osmotic Stress Adaptations.Int J Mol Sci. 2024 Nov 27;25(23):12725. doi: 10.3390/ijms252312725. Int J Mol Sci. 2024. PMID: 39684437 Free PMC article.
-
The Proteomic and Peptidomic Response of Wheat (Triticum aestivum L.) to Drought Stress.Plants (Basel). 2025 Jul 14;14(14):2168. doi: 10.3390/plants14142168. Plants (Basel). 2025. PMID: 40733406 Free PMC article.
References
-
- Fen T., Xie C.Y., Li H.N., Lei S.C., Li J., Huang X.W., Yang F. Effect of in vitro digestion on chestnut outer-skin and inner-skin bioaccessibility: The relationship between biotransformation and antioxidant activity of polyphenols by metabolomics. Food Chem. 2021;363:130277. - PubMed
-
- Zha J.J., Fan B., He J.R., He C.Y., Dong X.D., Feng Y.Y., Liu Y.N., Ji H.Y., Yu S.S., Liu A.J., et al. A novel polysaccharide from Castanea mollissima Blume: Preparation, characteristics and antitumor activities in vitro and in vivo. Carbohydr. Polym. 2020;240:116323. - PubMed
-
- Ma C.L. Valorization of Biomass to Furfural by Chestnut Shell-based Solid Acid in Methyl Isobutyl Ketone-Water-Sodium Chloride System. Appl. Biochem. Biotech. 2022;194:2021–2035. - PubMed
-
- Zhao J.B., Du C.J., Ma C.M., Sun J.C., Han Z.T., Yan D.H., Jiang Z.P., Shi S.Q. Response of photosynthesis and carbon/nitrogen metabolism to drought stress in Chinese chestnut ‘Yanshanzaofeng’ seedlings. J. Appl. Ecol. 2020;31:3674–3680. - PubMed
-
- Wen X.L., Gu C.Q., Zhu D.X., Liu P., Lai Y.P., Zeng Q.Z. Water stress affects on cell membrane lipid oxidation and calcification of chestnut (Castanea mollissima Bl.) Postharvest Biol. Tec. 2017;126:34–39. doi: 10.1016/j.postharvbio.2016.12.005. - DOI
Grants and funding
- 2022BBA153/Key R&D Program of Hubei Province
- E [2023] TG23/Chinese Central Financial Forestry Science and Technology Promotion Demonstration Project
- 2021-620-000-001-023/Hubei Innovation Center of Agricultural Science and Technology
- To Wen-Ming Qiu/the Leading Talent Cultivation Program of Hubei Academy of Agricultural Sciences
LinkOut - more resources
Full Text Sources
