

A Genome-Wide Analysis and Expression Profile of Heat Shock Transcription Factor (Hsf) Gene Family in Rhododendron simsii
- PMID: 38005814
- PMCID: PMC10674592
- DOI: 10.3390/plants12223917
A Genome-Wide Analysis and Expression Profile of Heat Shock Transcription Factor (Hsf) Gene Family in Rhododendron simsii
Abstract
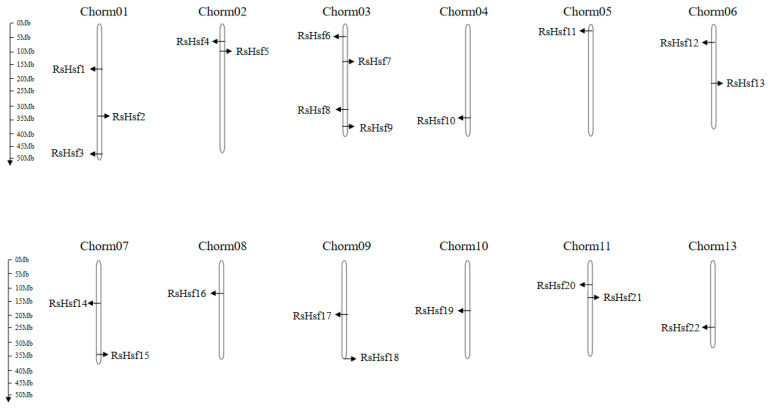
Heat shock transcription factors are key players in a number of transcriptional regulatory pathways that function during plant growth and development. However, their mode of action in Rhododendron simsii is still unclear. In this study, 22 RsHsf genes were identified from genomic data of R. simsii. The 22 genes were randomly distributed on 12 chromosomes, and were divided into three major groups according to their phylogenetic relationships. The structures and conserved motifs were predicted for the 22 genes. Analysis of cis-acting elements revealed stress-responsive and phytohormone-responsive elements in the gene promoter regions, but the types and number varied among the different groups of genes. Transcriptional profile analyses revealed that RsHsfs were expressed in a tissue-specific manner, with particularly high transcript levels in the roots. The transcriptional profiles under abiotic stress were detected by qRT-PCR, and the results further validated the critical function of RsHsfs. This study provides basic information about RsHsf family in R. simsii, and paves the way for further research to clarify their precise roles and to breed new stress-tolerant varieties.
Keywords: Rhododendron; RsHsf family; abiotic stress; gene expression.
Conflict of interest statement
The authors declare no conflict of interest.
Figures


Similar articles
-
Genome-wide characterization and evolutionary analysis of heat shock transcription factors (HSFs) to reveal their potential role under abiotic stresses in radish (Raphanus sativus L.).BMC Genomics. 2019 Oct 24;20(1):772. doi: 10.1186/s12864-019-6121-3. BMC Genomics. 2019. PMID: 31651257 Free PMC article.
-
Comprehensive Genomic Survey, Structural Classification, and Expression Analysis of WRKY Transcription Factor Family in Rhododendron simsii.Plants (Basel). 2022 Nov 3;11(21):2967. doi: 10.3390/plants11212967. Plants (Basel). 2022. PMID: 36365420 Free PMC article.
-
Phylogenetic and expression analysis of HSP20 gene family in Rhododendron species of different altitudes.Int J Biol Macromol. 2025 May;309(Pt 4):143125. doi: 10.1016/j.ijbiomac.2025.143125. Epub 2025 Apr 12. Int J Biol Macromol. 2025. PMID: 40228764
-
Genome-Wide Identification of Eucalyptus Heat Shock Transcription Factor Family and Their Transcriptional Analysis under Salt and Temperature Stresses.Int J Mol Sci. 2022 Jul 21;23(14):8044. doi: 10.3390/ijms23148044. Int J Mol Sci. 2022. PMID: 35887387 Free PMC article.
-
Genome-Wide Analysis of the Rhododendron AP2/ERF Gene Family: Identification and Expression Profiles in Response to Cold, Salt and Drought Stress.Plants (Basel). 2023 Feb 22;12(5):994. doi: 10.3390/plants12050994. Plants (Basel). 2023. PMID: 36903855 Free PMC article.
Cited by
-
Characterization and Functional Analysis of RhHsfA7, a Heat Stress Transcription Factor in Roses (Rosa hybrid 'Samantha').Plants (Basel). 2025 Apr 8;14(8):1155. doi: 10.3390/plants14081155. Plants (Basel). 2025. PMID: 40284043 Free PMC article.
-
Genome-Wide Characterization of the Heat Shock Transcription Factor Gene Family in Betula platyphylla Reveals Promising Candidates for Heat Tolerance.Int J Mol Sci. 2024 Dec 28;26(1):172. doi: 10.3390/ijms26010172. Int J Mol Sci. 2024. PMID: 39796031 Free PMC article.
References
-
- Dorothea B., Ramanjulu S. Drought and Salt Tolerance in Plants. Crit. Rev. Plant Sci. 2005;24:23–58.
-
- Klaus D.S., Thomas B., Ingo E., Lutz N. The plant heat stress transcription factor (Hsf) family: Structure, function and evolution. BBA-Gene Regul. Mech. 2012;1819:104–119. - PubMed
Grants and funding
LinkOut - more resources
Full Text Sources
