Current Trends of HIV Infection in the Russian Federation
- PMID: 38005834
- PMCID: PMC10674383
- DOI: 10.3390/v15112156
Current Trends of HIV Infection in the Russian Federation
Abstract
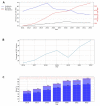
Russia remains one of the areas most affected by HIV in Eastern Europe and Central Asia. The aim of this study was to analyze HIV infection indicators and study trends in Russia using data from the Federal Statistic Form No. 61 "Information about HIV infection". HIV incidence, prevalence, HIV testing and mortality rates (from 2011 to 2022), and treatment success rates (from 2016 to 2022) were analyzed. These indicators were compared across different federal districts (FDs) of Russia. The findings revealed a significant downward trend in HIV incidence, while a significant upward trend was observed for HIV prevalence. The mortality rate has stabilized since 2018. The coverage of HIV testing and antiretroviral therapy increased over time. The number of people living with HIV-1 (PLWH) with a suppressed viral load in Russia as a whole varied between 72% and 77% during the years under observation. The Siberian and Ural federal districts recorded the highest HIV incidence, while the North Caucasian FD reported the lowest. An increase in HIV testing coverage was observed across all FDs. This comprehensive evaluation of HIV infection indicators within the regional context contributes to the timely implementation of measures aimed at preventing the spread of HIV.
Keywords: HIV-1; Russia; antiretroviral therapy; incidence; mortality; prevalence.
Conflict of interest statement
The authors declare no conflict of interest.
Figures


Similar articles
-
HIV in the Russian Federation: mortality, prevalence, risk factors, and current understanding of sexual transmission.AIDS. 2023 Mar 15;37(4):637-645. doi: 10.1097/QAD.0000000000003441. Epub 2022 Dec 6. AIDS. 2023. PMID: 36729857 Free PMC article.
-
A Geospatial Bibliometric Review of the HIV/AIDS Epidemic in the Russian Federation.Front Public Health. 2020 Apr 2;8:75. doi: 10.3389/fpubh.2020.00075. eCollection 2020. Front Public Health. 2020. PMID: 32300580 Free PMC article.
-
HIV/AIDS in Russia: determinants of regional prevalence.Int J Health Geogr. 2007 Jun 6;6:22. doi: 10.1186/1476-072X-6-22. Int J Health Geogr. 2007. PMID: 17553136 Free PMC article.
-
Global epidemiology of HIV.Curr Opin HIV AIDS. 2009 Jul;4(4):240-6. doi: 10.1097/COH.0b013e32832c06db. Curr Opin HIV AIDS. 2009. PMID: 19532059 Review.
-
Syphilis and other sexually transmitted infections in the Russian Federation.Int J STD AIDS. 1999 Oct;10(10):665-8. doi: 10.1258/0956462991913240. Int J STD AIDS. 1999. PMID: 10582634 Review.
Cited by
-
Mortality and comorbidities in a Nationwide cohort of HIV-infected adults: comparison to a matched non-HIV adults' cohort, France, 2006-18.Eur J Public Health. 2024 Oct 1;34(5):879-884. doi: 10.1093/eurpub/ckae031. Eur J Public Health. 2024. PMID: 38409963 Free PMC article.
-
Comparative costs and potential affordability of a multifaceted intervention to improve treatment outcomes among people with HIV who inject drugs in Russia: economic evaluation of the LINC-II randomized controlled trial.J Int AIDS Soc. 2024 Feb;27(2):e26208. doi: 10.1002/jia2.26208. J Int AIDS Soc. 2024. PMID: 38403887 Free PMC article. Clinical Trial.
-
Peer education intervention reduced sexually transmitted infections among male Tajik labor migrants who inject drugs: results of a cluster-randomized controlled trial.BMC Public Health. 2025 Jun 10;25(1):2154. doi: 10.1186/s12889-025-23387-8. BMC Public Health. 2025. PMID: 40495129 Free PMC article. Clinical Trial.
-
Peer Education Intervention Reduced Sexually Transmitted Infections Among Male Tajik Labor Migrants Who Inject Drugs: Results of a Cluster-randomized Controlled Trial.medRxiv [Preprint]. 2025 May 1:2024.08.15.24312070. doi: 10.1101/2024.08.15.24312070. medRxiv. 2025. Update in: BMC Public Health. 2025 Jun 10;25(1):2154. doi: 10.1186/s12889-025-23387-8. PMID: 39185538 Free PMC article. Updated. Preprint.
-
Current Trends in HIV Infection in the Republic of Crimea.Viruses. 2024 Oct 31;16(11):1716. doi: 10.3390/v16111716. Viruses. 2024. PMID: 39599831 Free PMC article.
References
-
- World Health Organization . HIV and AIDS Key Facts. World Health Organization; Geneva, Switzerland: 2022. [(accessed on 17 August 2023)]. Available online: https://www.who.int/news-room/fact-sheets/detail/hiv-aids.
-
- UNAIDS . Fast-Track Cities: Ending the AIDS Epidemic. UNAIDS; Geneva, Switzerland: 2014. [(accessed on 17 August 2023)]. Available online: https://www.unaids.org/en/resources/documents/2014/20141201_Paris_declar....
-
- UNAIDS . UNAIDS Data 2022. UNAIDS; Geneva, Switzerland: 2022. [(accessed on 21 August 2023)]. Available online: https://www.unaids.org/sites/default/files/media_asset/data-book-2022_en....
MeSH terms
LinkOut - more resources
Full Text Sources
Medical

