. 2023 Nov 3;15(11):2209.
doi: 10.3390/v15112209.

Seneca Valley Virus Degrades STING via PERK and ATF6-Mediated Reticulophagy

Affiliations

Seneca Valley Virus Degrades STING via PERK and ATF6-Mediated Reticulophagy

Ling Bai et al. Viruses. .

Abstract

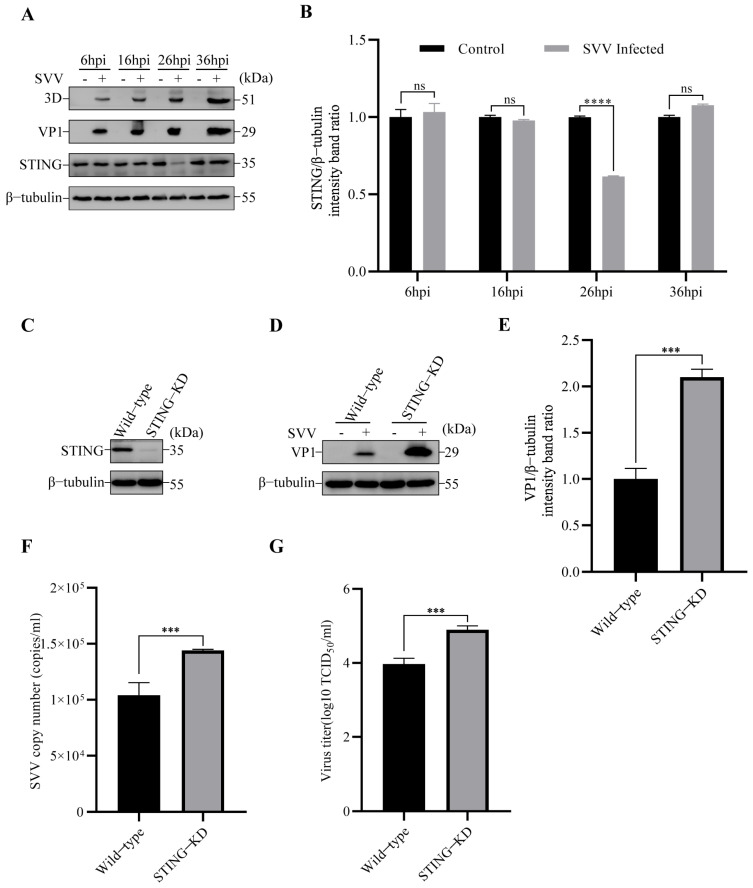
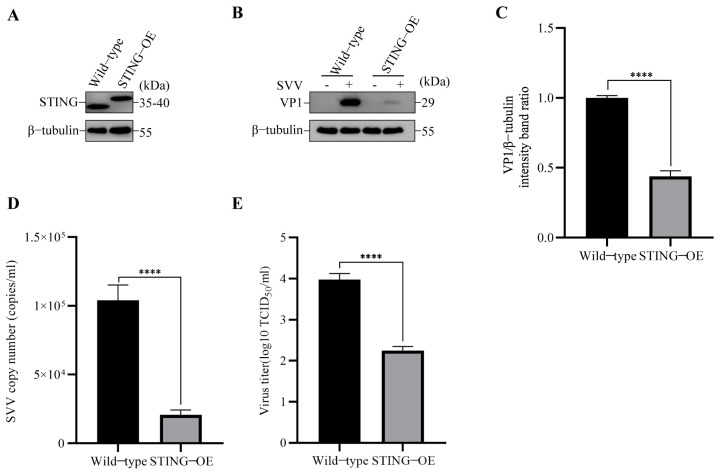
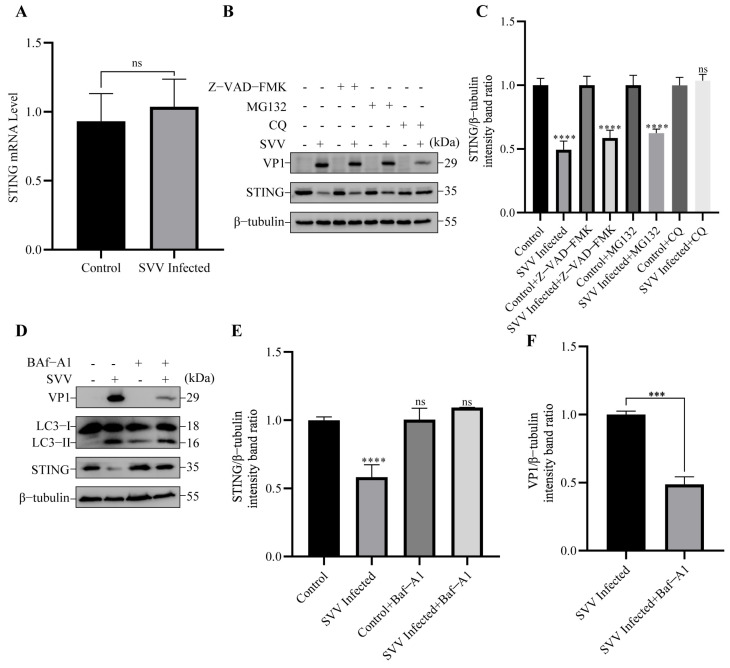
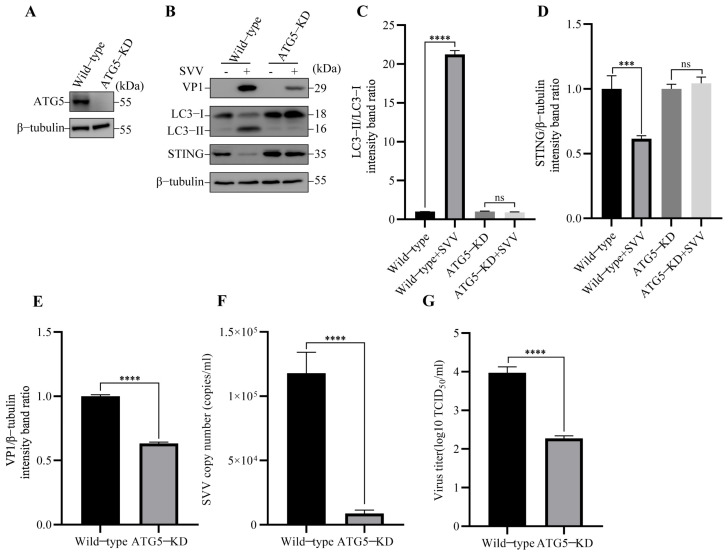
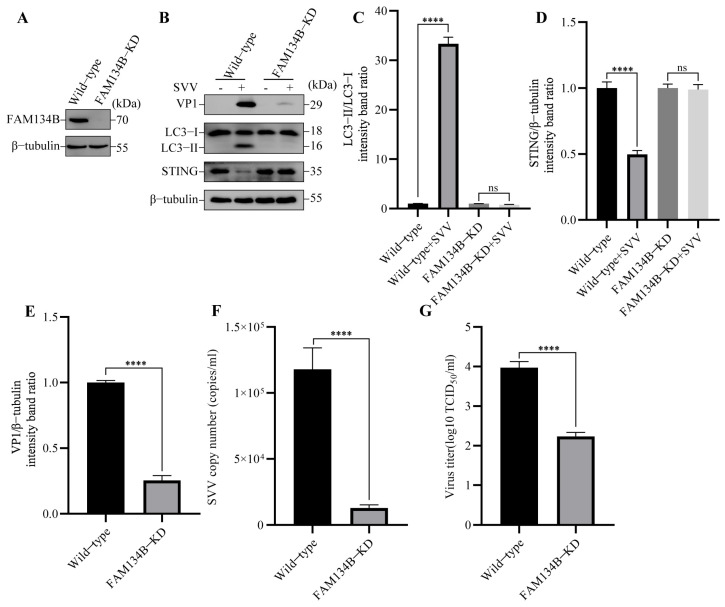
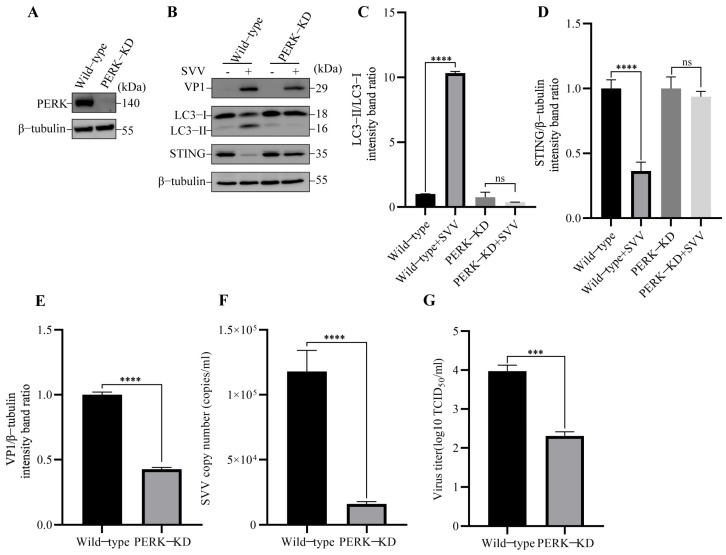
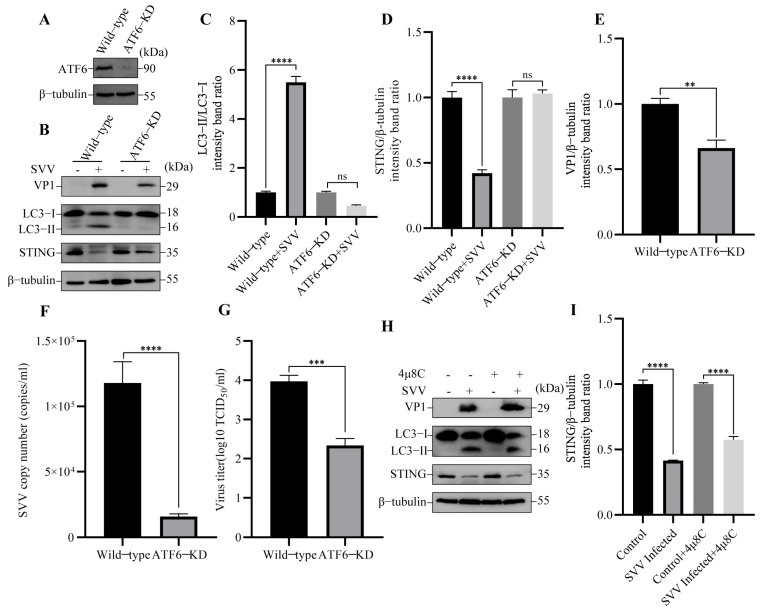
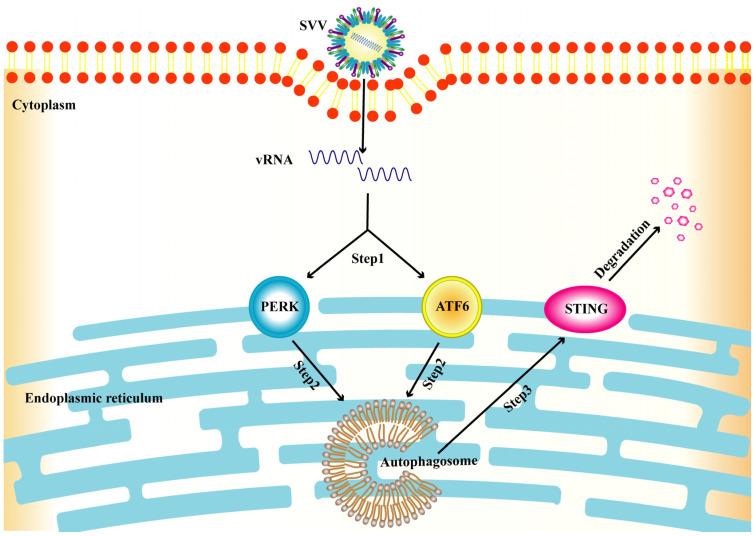
Seneca Valley Virus (SVV), a member of the Picornaviridae family, is an emerging porcine virus that can cause vesicular disease in pigs. However, the immune evasion mechanism of SVV remains unclear, as does its interaction with other pathways. STING (Stimulator of interferon genes) is typically recognized as a critical factor in innate immune responses to DNA virus infection, but its role during SVV infection remains poorly understood. In the present study, we observed that STING was degraded in SVV-infected PK-15 cells, and SVV replication in the cells was affected when STING was knockdown or overexpressed. The STING degradation observed was blocked when the SVV-induced autophagy was inhibited by using autophagy inhibitors (Chloroquine, Bafilomycin A1) or knockdown of autophagy related gene 5 (ATG5), suggesting that SVV-induced autophagy is responsible for STING degradation. Furthermore, the STING degradation was inhibited when reticulophagy regulator 1 (FAM134B), a reticulophagy related receptor, was knocked down, indicating that SVV infection induces STING degradation via reticulophagy. Further study showed that in eukaryotic translation initiation factor 2 alpha kinase 3 (PERK)/activating transcription factor 6 (ATF6) deficient cells, SVV infection failed to induce reticulophagy-medaited STING degradation, indicating that SVV infection caused STING degradation via PERK/ATF6-mediated reticulophagy. Notably, blocking reticulophagy effectively hindered SVV replication. Overall, our study suggested that SVV infection resulted in STING degradation via PERK and ATF6-mediated reticulophagy, which may be an immune escape strategy of SVV. This finding improves the understanding of the intricate interplay between viruses and their hosts and provides a novel strategy for the development of novel antiviral drugs.

Keywords: STING; SVV; UPR; autophagy.


Conflict of interest statement

The authors declare no conflict of interest. The funders had no role in the design of the study; in the collection, analyses, or interpretation of data; in the writing of the manuscript; or in the decision to publish the results.

Figures

Figure 1
Figure 1
SVV infection reduced STING protein level, and SVV replication increased in STING-KD PK-15 cells. (A) PK-15 cells were infected or uninfected with SVV (MOI = 1) for 6 h, 16 h, 26 h, and 36 h. The levels of β-tubulin, STING (Stimulator of interferon genes), VP1, and 3D protein were detected by Western blot. (B) Intensity of STING and β-tubulin bands in (A) were analyzed by Image J, and the intensity ratio of STING/β-tubulin was shown (mean ± SD; n = 3; ns, no significance, **** p < 0.0001). (C) The cell lysates of wild-type and STING-KD PK-15 cells were collected. The levels of β-tubulin and STING protein were detected by Western blot. (D) Wild-type and STING-KD PK-15 cells were infected or uninfected with SVV (MOI = 1) for 26 h. The levels of β-tubulin and VP1 protein were detected by Western blot. (E) Intensity of VP1 and β-tubulin bands in (D) were analyzed by Image J, and the intensity ratio of VP1/β-tubulin was shown (mean ± SD; n = 3; *** p < 0.001). (F) Wild-type and STING-KD PK-15 cells were infected with SVV (MOI = 1, 26 hpi). The copy numbers of SVV in these cells were detected by qPCR (mean ± SD; n = 3; *** p < 0.001). (G) Wild-type and STING-KD PK-15 cells were infected with SVV (MOI = 1, 26 hpi). The virus titers of SVV in these cells were detected by TCID50 (mean ± SD; n = 3; *** p < 0.001).
Figure 2
Figure 2
SVV replication was inhibited in STING-3×Flag OE PK-15 cells. (A) The cell lysates of wild-type and STING-3×Flag OE PK-15 cells were collected. The levels of β-tubulin and STING protein were detected by Western blot. (B) Wild-type and STING-3×Flag OE PK-15 cells were infected or uninfected with SVV (MOI = 1) for 26 h. The levels of β-tubulin and VP1 protein were detected by Western blot. (C) Intensity of VP1 and β-tubulin bands in (B) were analyzed by Image J, and the intensity ratio of VP1/β-tubulin was shown (mean ± SD; n = 3; **** p < 0.0001). (D) Wild-type and STING-3 × Flag OE PK-15 cells were infected with SVV (MOI = 1, 26 hpi). The copy numbers of SVV in these cells were detected by qPCR (mean ± SD; n = 3; **** p < 0.0001). (E) Wild-type and STING-3 × Flag OE PK-15 cells were infected with SVV (MOI = 1, 26 hpi). The virus titers of SVV in these cells were detected by TCID50 (mean ± SD; n = 3; **** p < 0.0001).
Figure 3
Figure 3
SVV-induced autophagy degraded STING. (A) PK-15 cells were infected or uninfected with SVV (MOI = 1) for 26 h. The relative expression of STING mRNA levels was measured by qPCR (mean ± SD; n = 3; ns, no significance). (B) PK-15 cells were infected or uninfected with SVV (MOI = 1) in the presence or absence of Z-VAD-FMK, MG-132, or chloroquine (CQ) for 26 h. The levels of β-tubulin, STING, and VP1 protein were detected by Western blot. (C) Intensity of STING and β-tubulin bands in (B) were analyzed by Image J, and the intensity ratio of STING/β-tubulin was shown (mean ± SD; n = 3; ns, no significance, **** p < 0.0001). (D) PK-15 cells were infected or uninfected with SVV (MOI = 1) in the presence or absence of bafilomycin A1 (Baf-A1) for 26 h. The levels of β-tubulin, STING, microtubule associated protein 1 light chain 3 beta (LC3), and VP1 protein were detected by Western blot. (E) Intensity of STING and β-tubulin bands in (D) were analyzed by Image J, and the intensity ratio of STING/β-tubulin was shown (mean ± SD; n = 3; ns, no significance, **** p < 0.0001). (F) Intensity of VP1 and β-tubulin bands in (D) were analyzed by Image J, and the intensity ratio of VP1/β-tubulin was shown (mean ± SD; n = 3; *** p < 0.001).
Figure 4
Figure 4
SVV-induced autophagy degraded STING via ATG5. (A) The cell lysates of wild-type and autophagy related gene 5 (ATG5)-KD PK-15 cells were collected. The levels of β-tubulin and ATG5 protein were detected by Western blot. (B) Wild-type and ATG5-KD PK-15 cells were infected or uninfected with SVV (MOI = 1) for 26 h. The levels of β-tubulin, STING, LC3, and VP1 protein were detected by Western blot. (C) Intensity of LC3-I and LC3-II bands in (B) were analyzed by Image J, and the intensity ratio of LC3-II/LC3-I was shown (mean ± SD; n = 3; ns, no significance, **** p < 0.0001). (D) Intensity of STING and β-tubulin bands in (B) were analyzed by Image J, and the intensity ratio of STING/β-tubulin was shown (mean ± SD; n = 3; ns, no significance, *** p < 0.001). (E) Intensity of VP1 and β-tubulin bands in (B) were analyzed by Image J, and the intensity ratio of VP1/β-tubulin was shown (mean ± SD; n = 3; **** p < 0.0001). (F) Wild-type and ATG5-KD PK-15 cells were infected with SVV (MOI = 1, 26 hpi). The copy numbers of SVV in these cells were detected by qPCR (mean ± SD; n = 3; **** p < 0.0001). (G) Wild-type and ATG5-KD PK-15 cells were infected with SVV (MOI = 1, 26 hpi). The virus titers of SVV in these cells were detected by TCID50 (mean ± SD; n = 3; **** p < 0.0001).
Figure 5
Figure 5
SVV degraded STING via reticulophagy. (A) The cell lysates of wild-type and reticulophagy regulator 1 (FAM134B)-KD PK-15 cells were collected. The levels of β-tubulin and FAM134B protein were detected by Western blot. (B) Wild-type and FAM134B-KD PK-15 cells were infected or uninfected with SVV (MOI = 1) for 26 h. The levels of β-tubulin, STING, LC3, and VP1 protein were detected by Western blot. (C) Intensity of LC3-I and LC3-II bands in (B) were analyzed by Image J, and the intensity ratio of LC3-II/LC3-I was shown (mean ± SD; n = 3; ns, no significance, **** p < 0.0001). (D) Intensity of STING and β-tubulin bands in (B) were analyzed by Image J, and the intensity ratio of STING/β-tubulin was shown (mean ± SD; n = 3; ns, no significance, **** p < 0.0001). (E) Intensity of VP1 and β-tubulin bands in (B) were analyzed by Image J, and the intensity ratio of VP1/β-tubulin was shown (mean ± SD; n = 3; **** p < 0.0001). (F) Wild-type and FAM134B-KD PK-15 cells were infected with SVV (MOI = 1, 26 hpi). The copy numbers of SVV in these cells were detected by qPCR (mean ± SD; n = 3; **** p < 0.0001). (G) Wild-type and FAM134B-KD PK-15 cells were infected with SVV (MOI = 1, 26 hpi). The virus titers of SVV in these cells were detected by TCID50 (mean ± SD; n = 3; **** p < 0.0001).
Figure 6
Figure 6
SVV induced reticulophagy via PERK to degrade STING. (A) The cell lysates of wild-type and eukaryotic translation initiation factor 2 alpha kinase 3 (PERK)-KD PK-15 cells were collected. The levels of β-tubulin and PERK protein were detected by Western blot. (B) Wild-type and PERK-KD PK-15 cells were infected or uninfected with SVV (MOI = 1) for 26 h. The levels of β-tubulin, STING, LC3, and VP1 protein were detected by Western blot. (C) Intensity of LC3-I and LC3-II bands in (B) were analyzed by Image J, and the intensity ratio of LC3-II/LC3-I was shown (mean ± SD; n = 3; ns, no significance, **** p < 0.0001). (D) Intensity of STING and β-tubulin bands in (B) were analyzed by Image J, and the intensity ratio of STING/β-tubulin was shown (mean ± SD; n = 3; ns, no significance, **** p < 0.0001). (E) Intensity of VP1 and β-tubulin bands in (B) were analyzed by Image J, and the intensity ratio of VP1/β-tubulin was shown (mean ± SD; n = 3; **** p < 0.0001). (F) Wild-type and PERK-KD PK-15 cells were infected with SVV (MOI = 1, 26 hpi). The copy numbers of SVV in these cells were detected by qPCR (mean ± SD; n = 3; **** p < 0.0001). (G) Wild-type and PERK-KD PK-15 cells were infected with SVV (MOI = 1, 26 hpi). The virus titers of SVV in these cells were detected by TCID50 (mean ± SD; n = 3; *** p < 0.001).
Figure 7
Figure 7
SVV induced reticulophagy via ATF6 to degrade STING. (A) The cell lysates of wild-type and activating transcription factor 6 (ATF6)-KD PK-15 cells were collected. The levels of β-tubulin and ATF6 protein were detected by Western blot. (B) Wild-type and ATF6-KD PK-15 cells were infected or uninfected with SVV (MOI = 1) for 26 h. The levels of β-tubulin, STING, LC3, and VP1 protein were detected by Western blot. (C) Intensity of LC3-I and LC3-II bands in (B) were analyzed by Image J, and the intensity ratio of LC3-II/LC3-I was shown (mean ± SD; n = 3; ns, no significance, **** p < 0.0001). (D) Intensity of STING and β-tubulin bands in (B) were analyzed by Image J, and the intensity ratio of STING/β-tubulin was shown (mean ± SD; n = 3; ns, no significance, **** p < 0.0001). (E) Intensity of VP1 and β-tubulin bands in (B) were analyzed by Image J, and the intensity ratio of VP1/β-tubulin was shown (mean ± SD; n = 3; ** p < 0.01). (F) Wild-type and ATF6-KD PK-15 cells were infected with SVV (MOI = 1, 26 hpi). The copy numbers of SVV in these cells were detected by qPCR (mean ± SD; n = 3; **** p < 0.0001). (G) Wild-type and ATF6-KD PK-15 cells were infected with SVV (MOI = 1, 26 hpi). The virus titers of SVV in these cells were detected by TCID50 (mean ± SD; n = 3; *** p < 0.001). (H) PK-15 cells were infected or uninfected with SVV (MOI = 1) in the presence or absence of 4μ8C for 26 h. The levels of β-tubulin, STING, LC3, and VP1 protein were detected by Western blot. (I) Intensity of STING and β-tubulin bands in (H) were analyzed by Image J, and the intensity ratio of STING/β-tubulin was shown (mean ± SD; n = 3; **** p < 0.0001).
Figure 8
Figure 8
A model of SVV-induced STING degradation via PERK and ATF6-mediated reticulophagy. Step 1, SVV induces UPR via PERK and ATF6. Step 2, activation of PERK and ATF6 leads to reticulophagy. Step 3, STING is finally degraded through reticulophagy.

Similar articles

Cited by

References

    1. Hales L.M., Knowles N.J., Reddy P.S., Xu L., Hay C., Hallenbeck P.L. Complete genome sequence analysis of Seneca Valley virus-001, a novel oncolytic picornavirus. J. Gen. Virol. 2008;89:1265–1275. doi: 10.1099/vir.0.83570-0. - DOI - PubMed
    1. Buckley A., Kulshreshtha V., van Geelen A., Montiel N., Guo B., Yoon K.J., Lager K. Experimental Seneca Valley virus infection in market-weight gilts. Vet. Microbiol. 2019;231:7–10. doi: 10.1016/j.vetmic.2019.02.019. - DOI - PubMed
    1. Liu F., Wang Q., Huang Y., Wang N., Shan H. A 5-Year Review of Senecavirus A in China since Its Emergence in 2015. Front. Vet. Sci. 2020;7:567792. doi: 10.3389/fvets.2020.567792. - DOI - PMC - PubMed
    1. Zhang L., Mo J., Swanson K.V., Wen H., Petrucelli A., Gregory S.M., Zhang Z., Schneider M., Jiang Y., Fitzgerald K.A., et al. NLRC3, a member of the NLR family of proteins, is a negative regulator of innate immune signaling induced by the DNA sensor STING. Immunity. 2014;40:329–341. doi: 10.1016/j.immuni.2014.01.010. - DOI - PMC - PubMed
    1. Ishikawa H., Ma Z., Barber G.N. STING regulates intracellular DNA-mediated, type I interferon-dependent innate immunity. Nature. 2009;461:788–792. doi: 10.1038/nature08476. - DOI - PMC - PubMed

Substances

Supplementary concepts