. 2023 Nov 9;15(11):2233.
doi: 10.3390/v15112233.

In Vivo and In Vitro Characterization of the Recently Emergent PRRSV 1-4-4 L1C Variant (L1C.5) in Comparison with Other PRRSV-2 Lineage 1 Isolates

Affiliations

In Vivo and In Vitro Characterization of the Recently Emergent PRRSV 1-4-4 L1C Variant (L1C.5) in Comparison with Other PRRSV-2 Lineage 1 Isolates

Gaurav Rawal et al. Viruses. .

Abstract

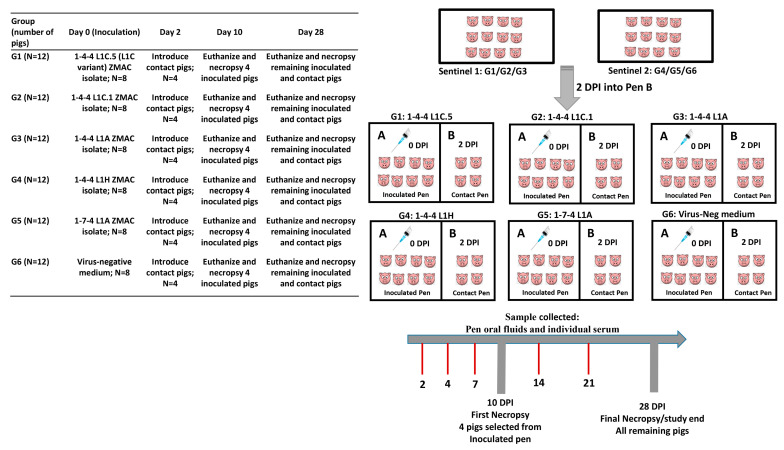
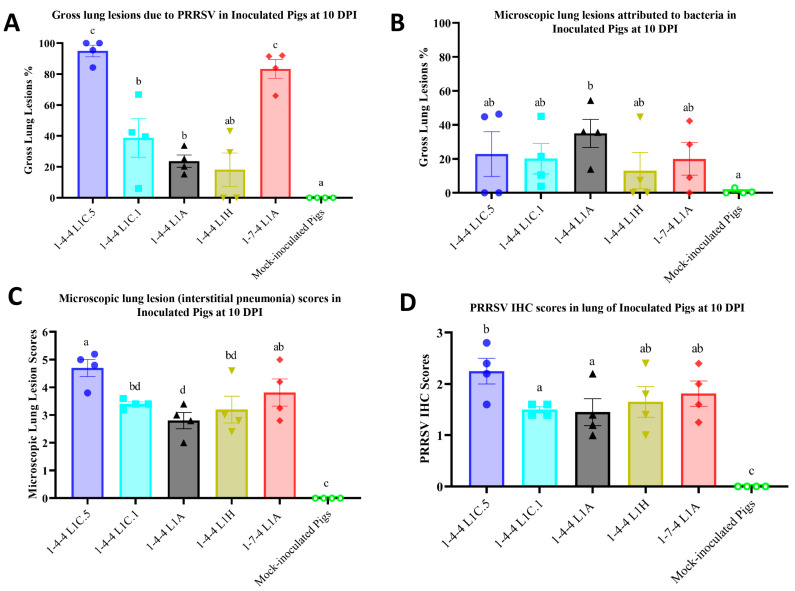
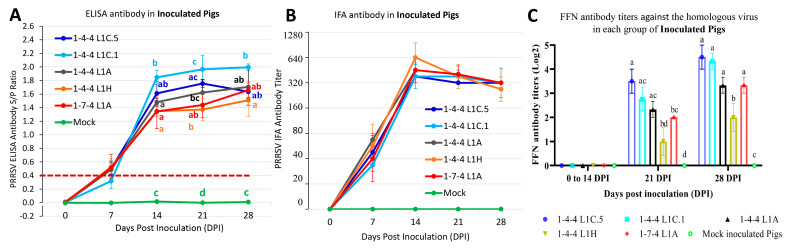
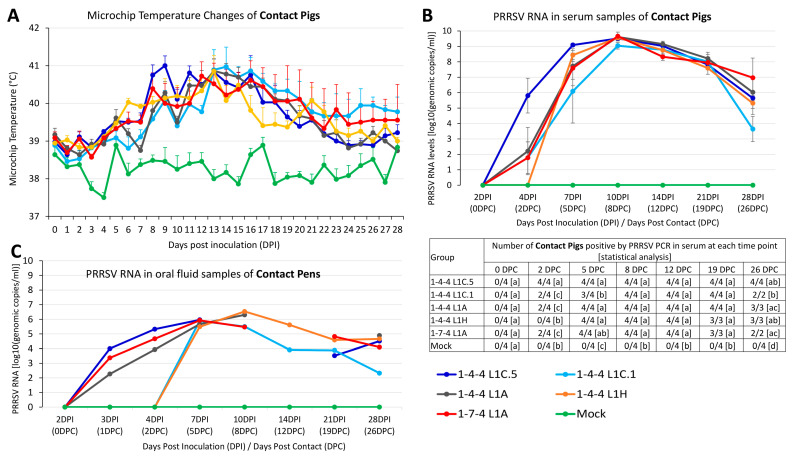
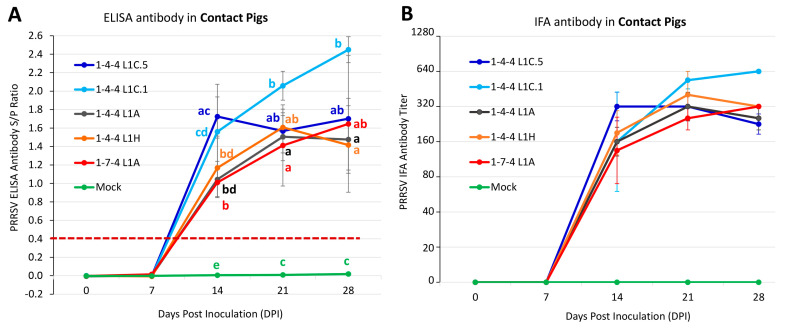
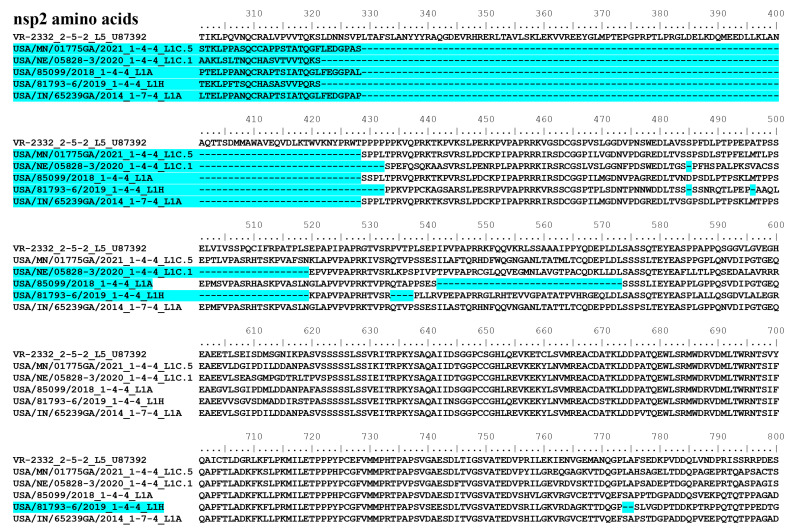
The recently emerged PRRSV 1-4-4 L1C variant (L1C.5) was in vivo and in vitro characterized in this study in comparison with three other contemporary 1-4-4 isolates (L1C.1, L1A, and L1H) and one 1-7-4 L1A isolate. Seventy-two 3-week-old PRRSV-naive pigs were divided into six groups with twelve pigs/group. Forty-eight pigs (eight/group) were for inoculation, and 24 pigs (four/group) served as contact pigs. Pigs in pen A of each room were inoculated with the corresponding virus or negative media. At two days post inoculation (DPI), contact pigs were added to pen B adjacent to pen A in each room. Pigs were necropsied at 10 and 28 DPI. Compared to other virus-inoculated groups, the L1C.5-inoculated pigs exhibited more severe anorexia and lethargy, higher mortality, a higher fraction of pigs with fever (>40 °C), higher average temperature at several DPIs, and higher viremia levels at 2 DPI. A higher percentage of the contact pigs in the L1C.5 group became viremic at two days post contact, implying the higher transmissibility of this virus strain. It was also found that some PRRSV isolates caused brain infection in inoculation pigs and/or contact pigs. The complete genome sequences and growth characteristics in ZMAC cells of five PRRSV-2 isolates were further compared. Collectively, this study confirms that the PRRSV 1-4-4 L1C variant (L1C.5) is highly virulent with potential higher transmissibility, but the genetic determinants of virulence remain to be elucidated.

Keywords: 1-4-4 L1C variant; L1C.1; L1C.5; PRRSV; brain infection; experimental study; porcine reproductive and respiratory syndrome virus; transmissibility; virulence.


Conflict of interest statement

The authors declare no conflict of interest.

Figures

Figure 1
Figure 1
Phylogenetic tree based on ORF5 nucleotides of PRRSV-2 lineage 1 sequences. The representative L1A, L1B, L1C (LC.1, LC.2, L1C.3, L1C.4, L1C.5, and L1C-unclade), L1D, L1E, L1F, L1H, L1I, and L1J are depicted. The five PRRSV-2 isolates included in this study are shown using solid black bullet points.
Figure 2
Figure 2
Experimental design of the pig study. On the (left), information of groups and the corresponding virus inoculum is provided. On the (right), a schematic diagram describes the pen in each room and the corresponding inoculation pigs and contact pigs.
Figure 3
Figure 3
Clinical observations in inoculated pigs. (A) The overall average anorexia and lethargy scores in different groups from 0 to 21 DPI. For each group, the available pigs were averaged for their anorexia and lethargy scores for each day. Therefore, there are 22 spots for each group corresponding to each day from 0 to 21 DPI. (B) Percentage of pigs showing fever (>40 °C) in each group at each time point. (C) Microchip body-temperature changes of inoculated pigs over time. The mean microchip temperature in degree Celsius is shown on the Y-axis. (D) Mean average daily weight gain (ADG) of inoculated pigs between −1 DPI and 10 DPI, with significance denoted by letters. Pigs that died or were euthanized due to severe body conditions before 10 DPI are shown by * in (D). Labels with different letters indicate significant differences; for example, a and b have a significant difference, but a and ab have no significant difference.
Figure 4
Figure 4
PRRSV RNA load in different specimens of inoculated pigs. (A) PRRSV RNA detected in serum samples of inoculated pigs by quantitative real-time RT-PCR. The average PRRSV RNA levels in the unit of log10(genomic copies/mL) of each group in serum samples at each time point are shown. The number of pigs confirmed positive by PRRSV PCR and statistical analysis are shown in the bottom. Pigs that died or euthanized between 8 and 10 DPI were included for counting at 10 DPI. Similarly, dead pigs between 11 and 14 DPI were counted at 14 DPI, dead pigs between 15 and 21 DPI were counted at 21 DPI, and dead pigs between 21 and 28 DPI were counted at 28 DPI. Labels with different letters indicate significant differences; for example, a and b have a significant difference, but a and ab have no significant difference. (B) PRRSV RNA log10(genomic copies/mL) in pen-based oral fluids of inoculated pigs. Oral fluids could not be collected at some time points due to the inactivity of pigs.
Figure 5
Figure 5
Gross lesions, microscopic lesions, and PRRSV immunohistochemistry (IHC) scores in lung tissues of inoculated pigs at 10 DPI. Percentage of macroscopic lung lesions due to PRRSV in inoculated pigs (A) and percentage of macroscopic lung lesions due to bacteria in inoculated pigs (B) are shown. (C) Microscopic lung lesion scores (in the range of 0–6) in inoculated pigs at 10 DPI. (D) PRRSV IHC staining scores (in the range of 0–3) in lung tissues of inoculated pigs at 10 DPI. A cluster graph was used to present the data with standard error of the mean. The statistical analysis was conducted between groups, with significance denoted by letters on the individual plot. Labels with different letters indicate significant differences; for example, a and b have a significant difference, but a and ab have no significant difference.
Figure 6
Figure 6
Representative images showing gross lesions, microscopic lesions, and PRRSV immunohistochemistry (IHC) staining in lung tissues at 10 days post inoculation (DPI). The inoculation groups are shown at the top. Gross lung pathology, microscopic lung lesions, and PRRSV IHC staining in lung tissues are exemplified in (AF), (GL), and (MR), respectively.
Figure 7
Figure 7
PRRSV RNA load in different specimens of inoculated pigs. (A) PRRSV RNA log10(genomic copies/mL) in lung, tonsil, and brain tissues of inoculated pigs necropsied at 10 DPI or during 9–10 DPI. (B) PRRSV RNA log10(genomic copies/mL) in lung, tonsil, and brain tissues of inoculated pigs necropsied at 28 DPI or during 10–28 DPI. Number of pigs confirmed positive by PRRSV PCR is indicated on top of each histogram.
Figure 8
Figure 8
Representative images showing microscopic lesions and PRRSV immunohistochemistry (IHC) staining in brain tissues at 10 days post inoculation (DPI). The inoculation groups are shown at the top. Histopathological changes and PRRSV IHC staining in brain tissues are exemplified in (AF) and (GL), respectively.
Figure 9
Figure 9
PRRSV antibody responses in serum samples of inoculated pigs over time. (A) PRRSV ELISA antibody detected by HerdChek® PRRS X3 ELISA (IDEXX). The average PRRSV ELISA antibody serum to positive (S/P) ratio of each group in serum samples at each time point is shown on the Y-axis. (B) PRRSV IFA antibody detected in serum samples of inoculated pigs. The average PRRSV IFA antibody titer of each group in serum samples at each time point is shown on the Y-axis. (C) Homologous PRRSV fluorescent focus neutralization (FFN) antibody titer (log2 format) is shown on the Y-axis. The statistical analysis was conducted between groups at each time point, with significance denoted by letters. Labels with different letters indicate significant differences; for example, a and b have a significant difference, but a and ab have no significant difference.
Figure 10
Figure 10
Microchip body-temperature and PCR data in serum and oral fluid samples collected from contact pigs. (A) The mean microchip body temperature in degree Celsius is shown on the Y-axis for contact pigs over time. (B) PRRSV RNA detected in serum samples of contact pigs by quantitative real-time RT-PCR. The number of pigs confirmed positive by PRRSV PCR and statistical analysis are shown in the bottom. The statistical analysis was conducted between groups at each time point, with significance denoted by letters. Labels with different letters indicate significant differences; for example, a and b have a significant difference, but a and ab have no significant difference. (C) PRRSV RNA log10(genomic copies/mL) in pen-based oral fluids of contact pigs. Oral fluids could not be collected at some time points from some groups due to the inactivity of pigs.
Figure 11
Figure 11
PRRSV antibody responses in contact pigs. (A) PRRSV ELISA antibody detected in serum samples of contact pigs. (B) PRRSV IFA antibody detected in serum samples of contact pigs. The statistical analysis was conducted between groups at each time point, with significance denoted by letters. Labels with different letters indicate significant differences; for example, a and b have a significant difference, but a and ab have no significant difference.
Figure 12
Figure 12
Partial nsp2 protein sequences of five PRRSV-2 isolates included in this study in comparison with the PRRSV-2 prototype isolate VR-2332. The positions evident in the figure represent positions of the nsp2 amino acid sequence in reference to that of VR-2332. The deletion of the amino acids in each PRRSV isolate is highlighted in blue.
Figure 13
Figure 13
Multistep growth curve analysis of five PRRSV-2 isolates in ZMAC cells. (Top) The virus titers Log10(TCID50/mL) are shown on the Y-axis with the standard error of the mean presented. (Bottom) The statistical analysis was conducted on the mean Log10(TCID50/mL) between groups at each hour post infection (hpi). Labels with different letters indicate significant differences; for example, a and b have a significant difference, but a and ab have no significant difference.

Similar articles

Cited by

References

    1. Brinton M.A., Gulyaeva A.A., Balasuriya U.B.R., Dunowska M., Faaberg K.S., Goldberg T., Leung F.C.C., Nauwynck H.J., Snijder E.J., Stadejek T., et al. ICTV Virus Taxonomy Profile: Arteriviridae 2021. J. Gen. Virol. 2021;102:001632. doi: 10.1099/jgv.0.001632. - DOI - PMC - PubMed
    1. Lunney J.K., Fang Y., Ladinig A., Chen N., Li Y., Rowland B., Renukaradhya G.J. Porcine Reproductive and Respiratory Syndrome Virus (PRRSV): Pathogenesis and Interaction with the Immune System. Annu. Rev. Anim. Biosci. 2016;4:129–154. doi: 10.1146/annurev-animal-022114-111025. - DOI - PubMed
    1. Fang Y., Treffers E.E., Li Y., Tas A., Sun Z., van der Meer Y., de Ru A.H., van Veelen P.A., Atkins J.F., Snijder E.J., et al. Efficient -2 frameshifting by mammalian ribosomes to synthesize an additional arterivirus protein. Proc. Natl. Acad. Sci. USA. 2012;109:E2920–E2928. doi: 10.1073/pnas.1211145109. - DOI - PMC - PubMed
    1. Zimmerman J., Dee S., Holtkamp D.J., Murtaugh M., Stadejek T., Stevenson G., Torremorell M., Yang H., Zhang J. Diseases of Swine. 11th ed. John Wiley & Sons, Inc.; Hoboken, NJ, USA: 2019. Porcine reproductive and respiratory syndrome viruses (porcine arteriviruses) pp. 685–708.
    1. Yim-im W., Anderson T.K., Paploski I., VanderWaal K., Gauger P., Kreuger K., Shi M., Main R., Zhang J. Refining PRRSV-2 genetic classification based on global ORF5 sequences and investigation of their geographic distributions and temporal changes. Microbiol. Spectr. 2023:e0291623. doi: 10.1128/spectrum.02916-23. - DOI - PMC - PubMed

Substances

LinkOut - more resources