. 2023 Oct 30;11(11):1662.
doi: 10.3390/vaccines11111662.

In Vivo Treatment with Insulin-like Growth Factor 1 Reduces CCR5 Expression on Vaccine-Induced Activated CD4+ T-Cells

Affiliations

In Vivo Treatment with Insulin-like Growth Factor 1 Reduces CCR5 Expression on Vaccine-Induced Activated CD4+ T-Cells

Massimiliano Bissa et al. Vaccines (Basel). .

Abstract

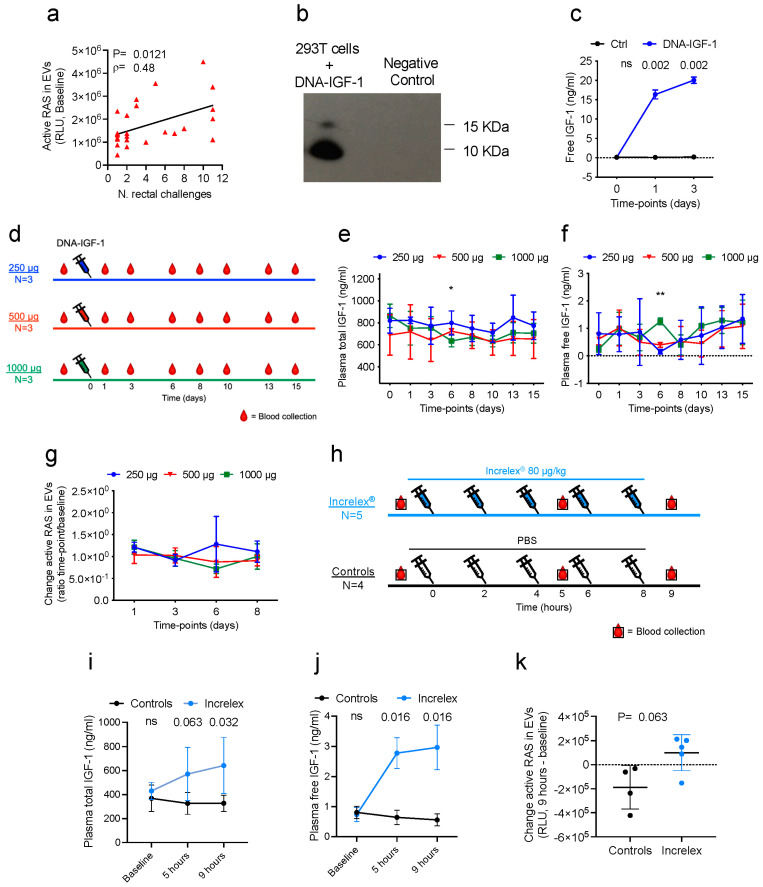
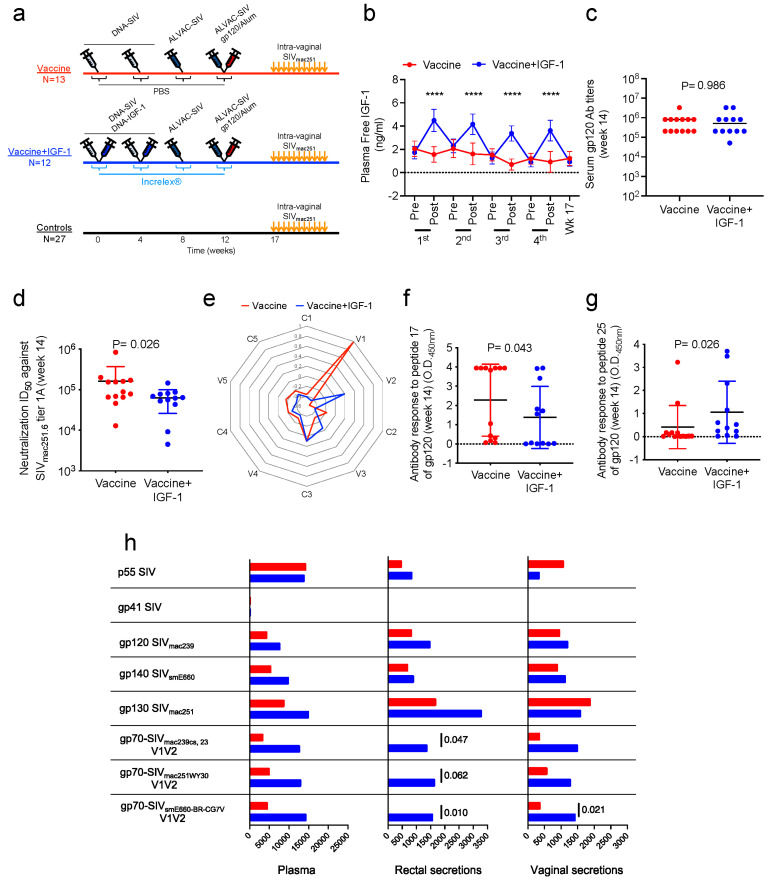
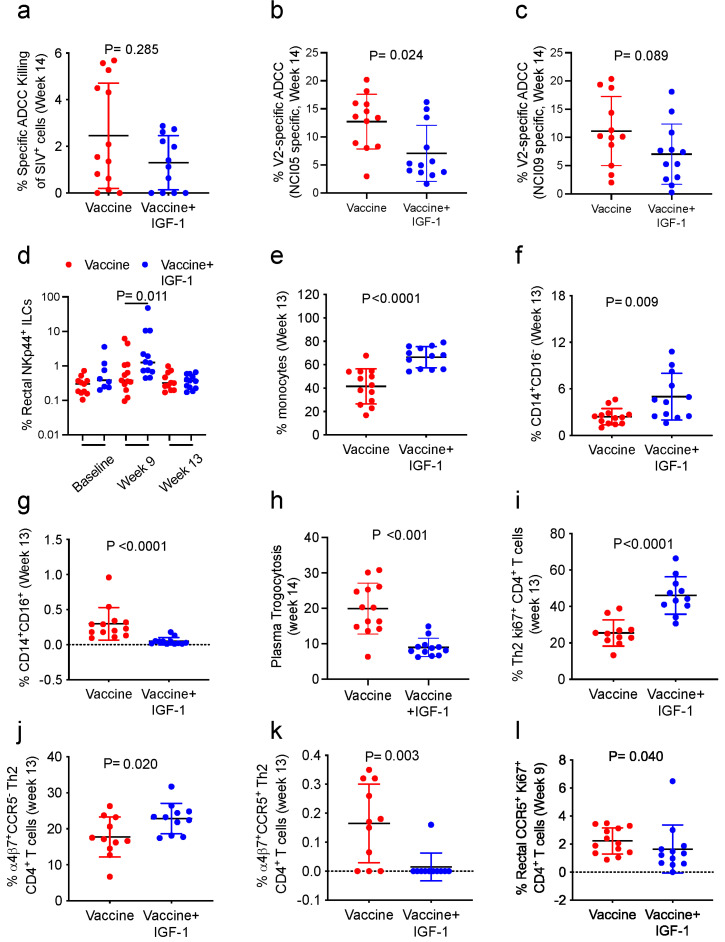
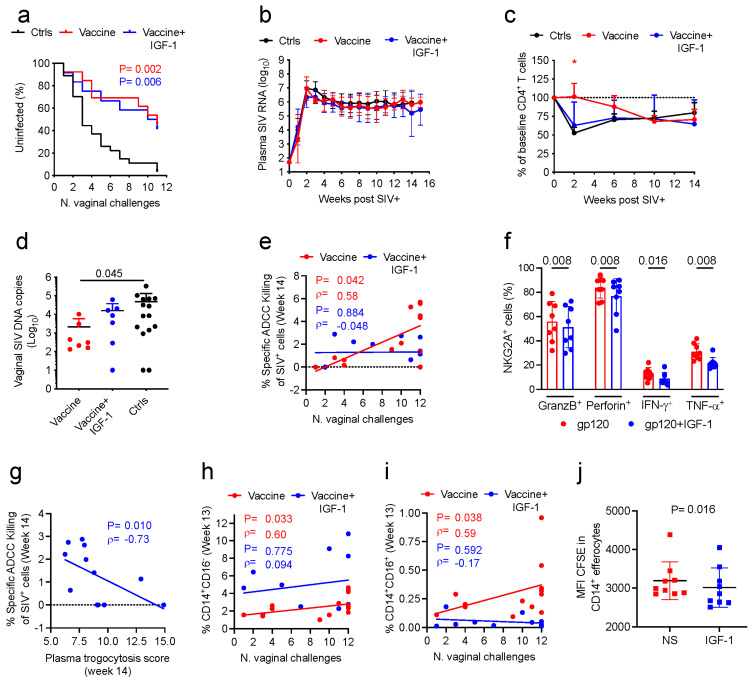
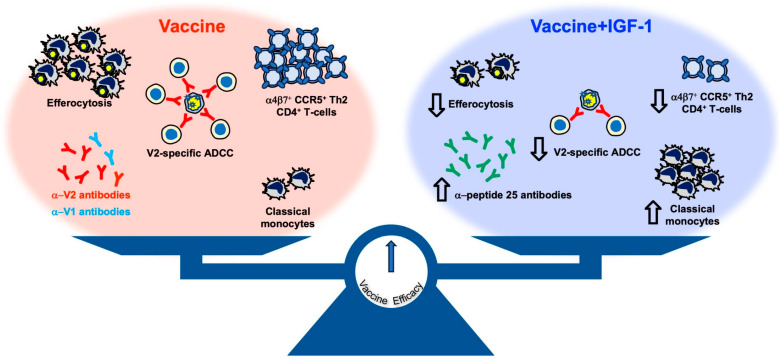
At the heart of the DNA/ALVAC/gp120/alum vaccine's efficacy in the absence of neutralizing antibodies is a delicate balance of pro- and anti-inflammatory immune responses that effectively decreases the risk of SIVmac251 acquisition in macaques. Vaccine efficacy is linked to antibodies recognizing the V2 helical conformation, DC-10 tolerogenic dendritic cells eliciting the clearance of apoptotic cells via efferocytosis, and CCR5 downregulation on vaccine-induced gut homing CD4+ cells. RAS activation is also linked to vaccine efficacy, which prompted the testing of IGF-1, a potent inducer of RAS activation with vaccination. We found that IGF-1 changed the hierarchy of V1/V2 epitope recognition and decreased both ADCC specific for helical V2 and efferocytosis. Remarkably, IGF-1 also reduced the expression of CCR5 on vaccine-induced CD4+ gut-homing T-cells, compensating for its negative effect on ADCC and efferocytosis and resulting in equivalent vaccine efficacy (71% with IGF-1 and 69% without).

Keywords: CCR5; CD4; HIV; IGF-1; SIV; T-cells; insulin-like growth factor.


Conflict of interest statement

The authors declare no conflict of interest.

Figures

Figure 1
Figure 1
Geneious Prime® alignment of the amino acid sequences of the IGF-1 proteins of rhesus macaque (Macaca mulatta) and human (Homo sapiens). The top row indicates consensus between the two sequences. The difference in position 44 (I—Isoleucine vs. M—Methionine) is highlighted.
Figure 2
Figure 2
IGF-1 administration and RAS activation. (a) Two-tailed Spearman correlation and simple linear regression between the levels of active RAS (relative light units; RLU) in plasma extracellular vesicles (EVs) at baseline and the time of acquisition (TOA) in ALVAC-SIV/gp120/alum-vaccinated animals (n = 26) [5]. (b) SDS-PAGE analysis of the IGF-1 protein in the supernatant of 293T cells transfected with DNA-IGF-1 (left; densitometry band of interest: 59.8) or a negative plasmid (right; densitometry band of interest: −1.1). The molecular weight of 15 and 10 KDa ladder bands are indicated. (c) Free IGF-1 levels (ng/mL) in the supernatant of 293T cells transfected with DNA-IGF-1 (n = 6; blue) or a negative plasmid (n = 6; black) at baseline and 1 and 3 days following transfection. (d) Schematic study design of plasmid DNA-IGF-1 administration and blood sample collections in three groups of 3 animals each (250 μg [blue], 500 μg [red], and 1000 μg [green]). (e,f) Plasma levels of (e) total and (f) free IGF-1 (ng/mL) at baseline and following DNA-IGF-1 administration in macaques administered different amounts of plasmid. (g) Variation in levels of active RAS in plasma EVs isolated from macaques administered different amounts of DNA-IGF-1 plasmid. For each animal, the variation at each timepoint was calculated as the ratio with the baseline level. (h) Schematic study design of 5 Increlex® (cerulean; n = 5) or PBS (black; n = 4) administrations and blood sample collections in macaques. Blood was collected at baseline and following 3 and 5 administrations. (i,j) Plasma levels of (i) total and (j) free IGF-1 (ng/mL) at baseline and following 3 and 5 Increlex® or PBS administrations. (k) Variation in levels of active RAS (RLU) in plasma EVs isolated from macaques administered of 5 Increlex® or PBS injections. For each animal, the variation was calculated as the subtraction of the active RAS levels following 5 injections and at baseline. Comparisons: (c,ik) the comparisons between the groups were performed as two-tailed Mann–Whitney U tests at each timepoint; (eg) the comparisons between the three groups were performed as Kruskal–Wallis ANOVA tests at each timepoint. The mean and SD are displayed. Statistical significance: * p < 0.05; ** p < 0.01. (c,f,k) dotted lines represent the zero value. (d,h) red triangular drops represent blood collections.
Figure 3
Figure 3
Vaccination in association with IGF-1 administration and antibody responses. (a) Schematic study design with immunization schedule, in association (blue) or not (red) with DNA-IGF-1 and Increlex® administration (weeks 0–12) and SIVmac251 challenges (weeks 17–27). (b) Plasma levels of free IGF-1 (ng/mL) in animals vaccinated in association or not with IGF-1 administration. Levels were tested prior to and following each immunization, and at the first challenge (week 17). (c) Serum IgG antibody titers to whole SIVm766 gp120 in vaccinated (n = 13) and vaccinated+IGF-1 (n = 12) animals at week 14. (d) Neutralizing antibody responses (ID50) to tier-1A SIVmac251.6 in serum of vaccinated (n = 13) and vaccinated+IGF-1 (n = 12) animals in week 14. (e) Radar plots showing the antibody responses to constant and variable regions of SIVm766 gp120 in serum of vaccinated (n = 13) and vaccinated+IGF-1 (n = 12) animals in week 14. Data are plotted as median of normalized z-scores for each region across all the animals. Comparisons were performed using the Mann–Whitney U test on the absolute values (optical densities, ODs) between vaccine and vaccine+IGF-1 groups. (f,g) Antibody response (OD) to peptides (f) 17 and (g) 25 of SIVm766 gp120 in serum of vaccinated and vaccinated+IGF-1 animals in week 14. (h) Summary graph representing the IgG antibody responses to p55 gag, gp41, and gp120 proteins and gp70 V1/V2 scaffolds in plasma, and rectal and vaginal secretions of vaccinated and vaccinated+IGF-1 animals in week 14. For vaginal secretions, 3 vaccinated animals and 4 vaccinated+IGF-1 animals were excluded due to blood contaminations. Data are represented as the median of the absolute values of the MFI for plasma and the specific activity for rectal and vaginal secretions. Comparisons were performed using the two-tailed Mann–Whitney U test on the absolute values between vaccine and vaccine+IGF-1 groups. Comparisons: (b,h) two-tailed Mann–Whitney U test with mean and SD; (c) two-tailed Mann–Whitney U test and median; (d,f,g) two-tailed Mann–Whitney U test and mean with SD. Statistical significance: **** p < 0.0001. (b,f,g) dotted lines represent the zero value.
Figure 4
Figure 4
Effect of IGF-1 on ADCC, monocytes, and CD4+ T-cells. (a) Specific ADCC killing of SIV-infected cells in plasma of vaccinated (n = 13) and vaccinated+IGF-1 (n = 12) animals in week 14. (b,c) V2-specific ADCC against gp120-coated cells in plasma of vaccinated (n = 13) and vaccinated+IGF-1 (n = 12) animals in week 14. V2-specific ADCC was assessed using F(ab′)2 of (b) NCI05 and (c) NCI09 antibodies targeting V2. (d) Frequencies of innate lymphoid cells expressing NKp44 receptor in rectal mucosa of vaccinated and vaccinated+IGF-1 animals at baseline (n = 11 and n = 8, respectively), week 9 (n = 13 and n = 12), and week 13 (n = 11 and n = 12). (eg) Frequencies of (e) total, (f) classical, and (g) intermediate monocytes in blood of vaccinated (n = 13) and vaccinated+IGF-1 (n = 12) animals in week 13. (h) Trogocytosis score in plasma of vaccinated (n = 13) and vaccinated+IGF-1 (n = 12) animals in week 14. (ik) Frequencies of type 2 T helper CD4+ T-cells (CXCR3CCR6) expressing (i) Ki67, (j) α4β7 but not CCR5, and (k) α4β7 and CCR5, in blood of vaccinated (n = 11) and vaccinated+IGF-1 (n = 11) animals following last immunization (week 13). (l) Frequency of Ki67+ CD4+ T-cells expressing CCR5 assessed in rectal mucosa of vaccinated (n = 13) and vaccinated+IGF-1 (n = 12) animals following the 3rd immunization (ALVAC-SIV boost; week 9). Comparisons: (ac,el) two-tailed Mann–Whitney U test with mean and SD; (d) two-tailed Mann–Whitney U test and median (unadjusted p values). (g,k,l) dotted lines represent the zero value.
Figure 5
Figure 5
Effect of IGF-1 on vaccine efficacy and correlates of risk of viral acquisition. (a) SIVmac251 acquisition. The number of intravaginal exposures before infection was assessed in animals vaccinated with IGF-1 (n = 13) or without IGF-1 (n = 12) and relative to controls (n = 27; Log-rank Mantel-Cox test). (b) SIV RNA levels in plasma over time following SIVmac251 infection (weeks; geometric mean with error and 95% CI) in vaccinated (n = 7), vaccinated+IGF-1 (n = 7), and control (n = 26) animals. (c) Percentage of CD4+ T-cell changes in blood over time following SIVmac251 infection (weeks; mean ± s.e.m.) in vaccinated (n = 7), vaccinated+IGF-1 (n = 7), and control animals (n = 18). Asterisk (*) indicates two-tailed Mann–Whitney comparison test between the vaccine (red *) or vaccine+IGF-1 (none) groups and the control group p < 0.05 or p > 0.05, respectively. (d) Log10 of SIV-DNA copies in vaginal mucosa 2–3 weeks after infection in vaccinated (n = 7), vaccinated+IGF-1 (n = 7), and control (n = 15) animals. (e) Correlations between the specific ADCC killing of SIV-infected cells in plasma of vaccinated (n = 13; red) and vaccinated+IGF-1 (n = 12; blue) animals in week 14 and at the time of acquisition (TOA). (f) Frequencies of NKG2A+ NK cells expressing Granzyme B, Perforin, IFN-γ, or TNF-α following gp120 or gp120+IGF-1 stimulation in PBMCs collected from vaccinated animals (n = 8) following last immunization (week 14). Comparisons: two-tailed Wilcoxon signed rank test between gp120 and gp120+IGF-1 treated cells for each secreted protein (unadjusted p values) with mean and SD. (g) Correlation between the specific ADCC killing of SIV-infected cells in plasma of vaccinated+IGF-1 (n = 12) animals in week 14 and the Trogocytosis score in plasma in week 14. (h,i) Correlations between the frequencies of (h) classical or (i) intermediate monocytes in blood of vaccinated (n = 13; red) and vaccinated+IGF-1 (n = 12; blue) animals in week 13 and the TOA. (j) Levels of apoptotic neutrophils engulfed by CD14+ efferocytes following 24 h in vitro incubation without (NS) or with IGF-1 stimulation (IGF-1) in CD14+ cells isolated from naïve macaques (n = 9). The levels are expressed as the MFI of CFSE used to mark the neutrophils. Comparisons: (d) two-tailed Mann–Whitney U test and mean with SD; (f,j) two-tailed Wilcoxon signed rank test with mean and SD. Correlations: (e,gi) two-tailed Spearman correlation with simple linear regression. Statistical significance: * p < 0.05. (c,e,g) dotted lines represent the zero value.
Figure 6
Figure 6
Schematic representation of immune responses increased (up arrow) and decreased (down arrow) through the coadministration of IGF-1 and anti-SIV DNA/ALVAC/gp120/alum vaccine. The left side of the image portrays correlates of decreased/increased risk of SIV acquisition identified in prior and current DNA/ALVAC/gp120/alum vaccine studies, whereas the right side represents the effect of the coadministration of IGF-1 and the vaccine on the same correlates. The balance between the increase and decrease in immune correlates due to IGF-1 administration results in a similar vaccine efficacy in vaccinated and vaccinated+IGF-1 non-human primates.

Similar articles

Cited by

References

    1. UNAIDS . In Danger: UNAIDS Global AIDS Update 2022. Joint United Nations Programme on HIV/AIDS (UNAIDS); Geneva, Switzerland: 2022. p. 373.
    1. Kim J., Vasan S., Kim J.H., Ake J.A. Current approaches to HIV vaccine development: A narrative review. J. Int. AIDS Soc. 2021;24((Suppl. S7)):e25793. doi: 10.1002/jia2.25793. - DOI - PMC - PubMed
    1. Johnson & Johnson Johnson & Johnson and Global Partners Announce Results from Phase 2b Imbokodo HIV Vaccine Clinical Trial in Young Women in Sub-Saharan Africa. PR Newswire. Aug 31, 2021.
    1. Hsu D.C., O’Connell R.J. Progress in HIV vaccine development. Hum. Vaccin. Immunother. 2017;13:1018–1030. doi: 10.1080/21645515.2016.1276138. - DOI - PMC - PubMed
    1. Vaccari M., Gordon S.N., Fourati S., Schifanella L., Liyanage N.P., Cameron M., Keele B.F., Shen X., Tomaras G.D., Billings E., et al. Adjuvant-dependent innate and adaptive immune signatures of risk of SIVmac251 acquisition. Nat. Med. 2016;22:762–770. doi: 10.1038/nm.4105. - DOI - PMC - PubMed