

Trends in Influenza Vaccination Rates among a Medicaid Population from 2016 to 2021
- PMID: 38006044
- PMCID: PMC10675465
- DOI: 10.3390/vaccines11111712
Trends in Influenza Vaccination Rates among a Medicaid Population from 2016 to 2021
Abstract
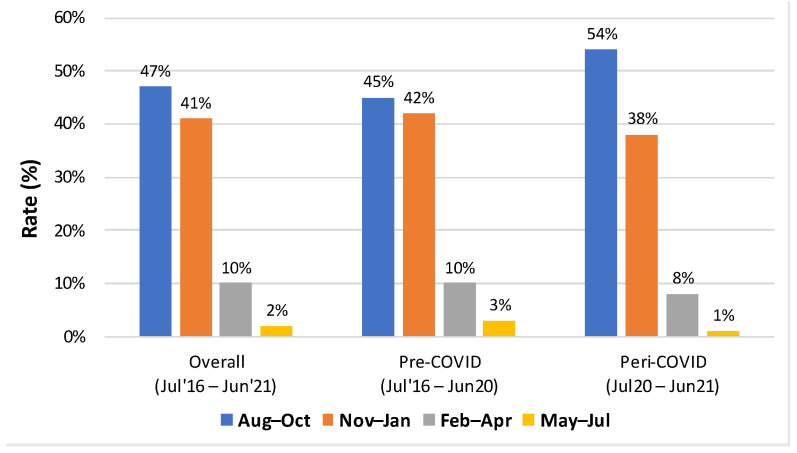
Seasonal influenza is a leading cause of death in the U.S., causing significant morbidity, mortality, and economic burden. Despite the proven efficacy of vaccinations, rates remain notably low, especially among Medicaid enrollees. Leveraging Medicaid claims data, this study characterizes influenza vaccination rates among Medicaid enrollees and aims to elucidate factors influencing vaccine uptake, providing insights that might also be applicable to other vaccine-preventable diseases, including COVID-19. This study used Medicaid claims data from nine U.S. states (2016-2021], encompassing three types of claims: fee-for-service, major Medicaid managed care plan, and combined. We included Medicaid enrollees who had an in-person healthcare encounter during an influenza season in this period, excluding those under 6 months of age, over 65 years, or having telehealth-only encounters. Vaccination was the primary outcome, with secondary outcomes involving in-person healthcare encounters. Chi-square tests, multivariable logistic regression, and Fisher's exact test were utilized for statistical analysis. A total of 20,868,910 enrollees with at least one healthcare encounter in at least one influenza season were included in the study population between 2016 and 2021. Overall, 15% (N = 3,050,471) of enrollees received an influenza vaccine between 2016 and 2021. During peri-COVID periods, there was an increase in vaccination rates among enrollees compared to pre-COVID periods, from 14% to 16%. Children had the highest influenza vaccination rates among all age groups at 29%, whereas only 17% were of 5-17 years, and 10% were of the 18-64 years were vaccinated. We observed differences in the likelihood of receiving the influenza vaccine among enrollees based on their health conditions and medical encounters. In a study of Medicaid enrollees across nine states, 15% received an influenza vaccine from July 2016 to June 2021. Vaccination rates rose annually, peaking during peri-COVID seasons. The highest uptake was among children (6 months-4 years), and the lowest was in adults (18-64 years). Female gender, urban residency, and Medicaid-managed care affiliation positively influenced uptake. However, mental health and substance abuse disorders decreased the likelihood. This study, reliant on Medicaid claims data, underscores the need for outreach services.
Keywords: COVID-19; Medicaid; influenza vaccine; vaccination uptake; vaccine.
Conflict of interest statement
Dr. Chen has received research funding support in part by: NIH/National Institute of Allergy and Infectious Diseases (1R01AI17812101); NIH/National Institute on Drug Abuse Clinical Trials Network (UG1DA015815-CTN-0136); Gordon and Betty Moore Foundation (Grant #12409); Stanford Artificial Intelligence in Medicine and Imaging—Human-Centered Artificial Intelligence (AIMI-HAI) Partnership Grant; Doris Duke Charitable Foundation—COVID19 Fund to Retain Clinical Scientists (20211260); Google, Inc. Research collaboration Co-I to leverage EHR data to predict a range of clinical outcomes; American Heart Association—Strategically Focused Research Network—Diversity in Clinical Trials; Co-founder of Reaction Explorer LLC that develops and licenses organic chemistry education software. Paid consulting fees from Sutton Pierce, Younker Hyde MacFarlane, and Sykes McAllister as a medical expert witness. The other authors declare no conflict of interest.
Figures


References
-
- Xu J., Murphy S., Kochanek K., Arias E. Deaths: Final Data 2019. [(accessed on 26 July 2021)];Natl. Vital Stat. Rep. 2021 70:8. Available online: https://stacks.cdc.gov/view/cdc/106058.
-
- Centers for Disease Control and Prevention Past Seasons Estimated Influenza Disease Burden. [(accessed on 1 October 2020)]; Available online: https://www.cdc.gov/flu/about/burden/past-seasons.html.
Grants and funding
LinkOut - more resources
Full Text Sources
