. 2023 Dec 6;25(12):euad350.
doi: 10.1093/europace/euad350.

Complex repolarization dynamics in ex vivo human ventricles are independent of the restitution properties

Affiliations

Complex repolarization dynamics in ex vivo human ventricles are independent of the restitution properties

Shahriar Iravanian et al. Europace. .

Abstract

Aims: The mechanisms of transition from regular rhythms to ventricular fibrillation (VF) are poorly understood. The concordant to discordant repolarization alternans pathway is extensively studied; however, despite its theoretical centrality, cannot guide ablation. We hypothesize that complex repolarization dynamics, i.e. oscillations in the repolarization phase of action potentials with periods over two of classic alternans, is a marker of electrically unstable substrate, and ablation of these areas has a stabilizing effect and may reduce the risk of VF. To prove the existence of higher-order periodicities in human hearts.

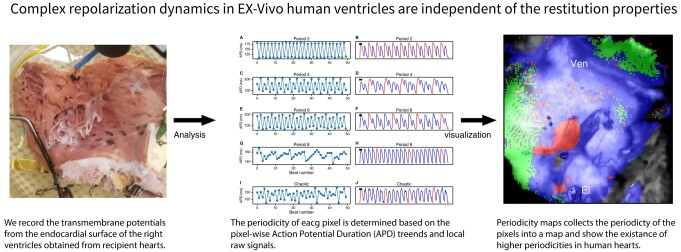
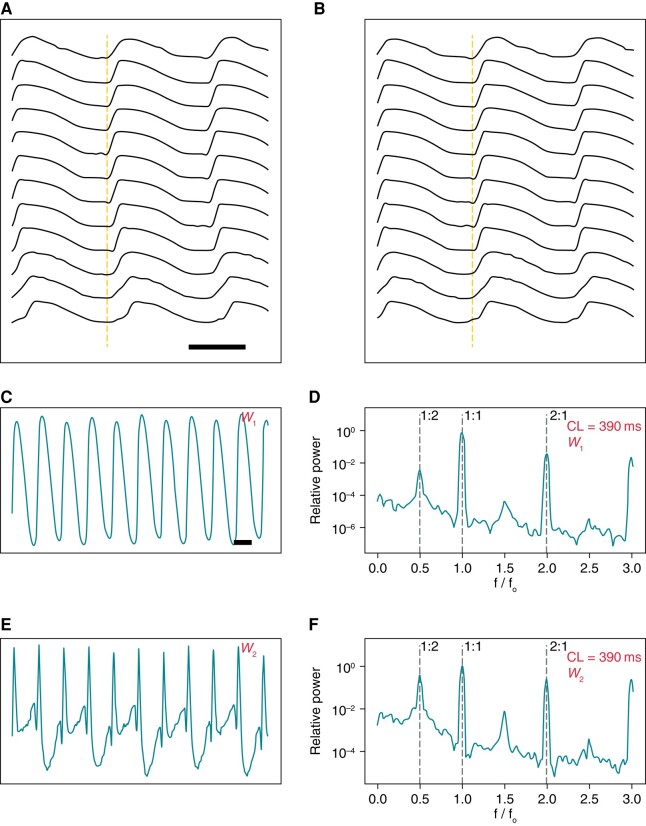
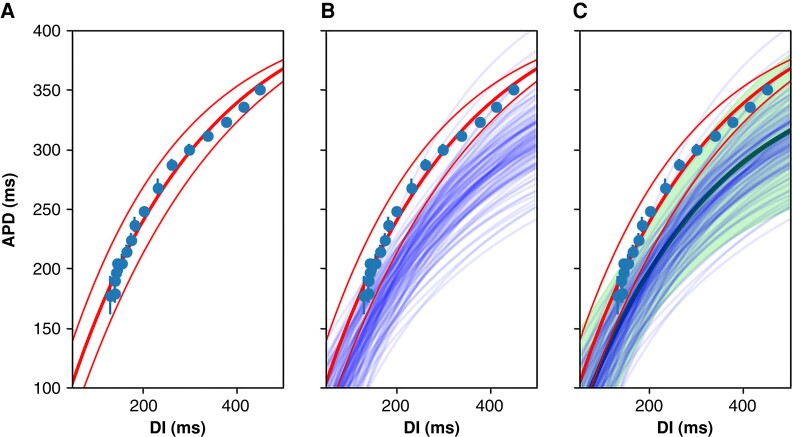
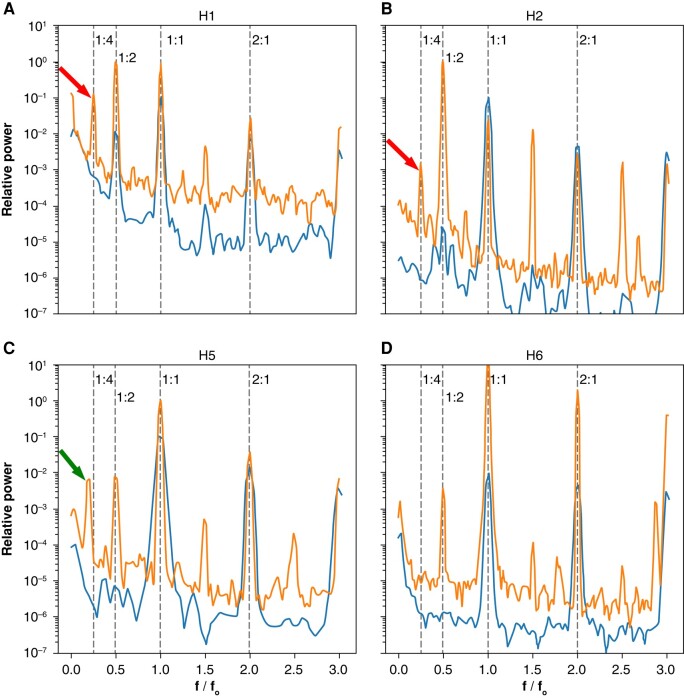
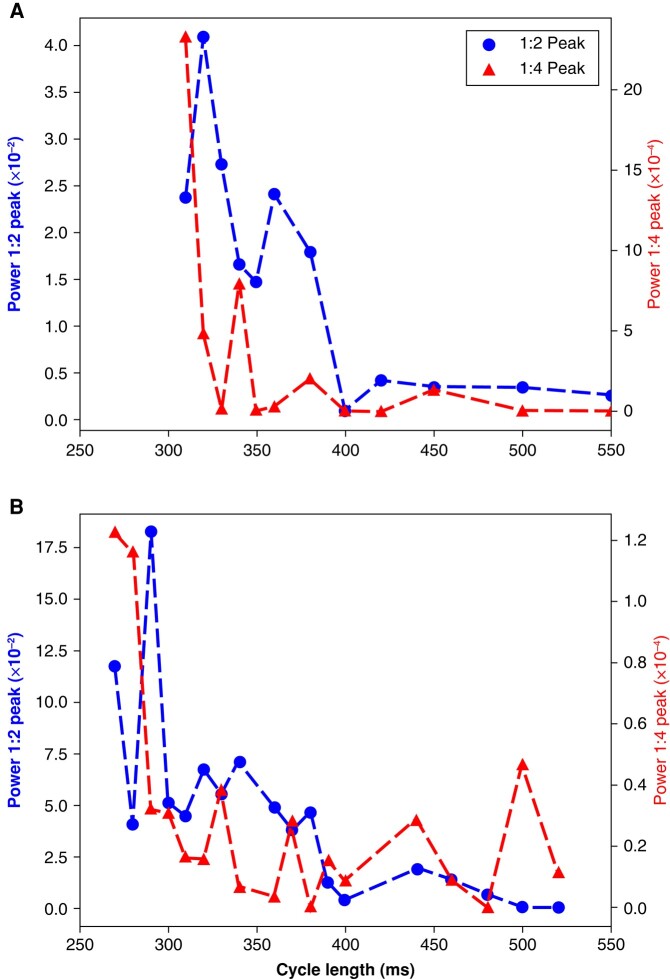
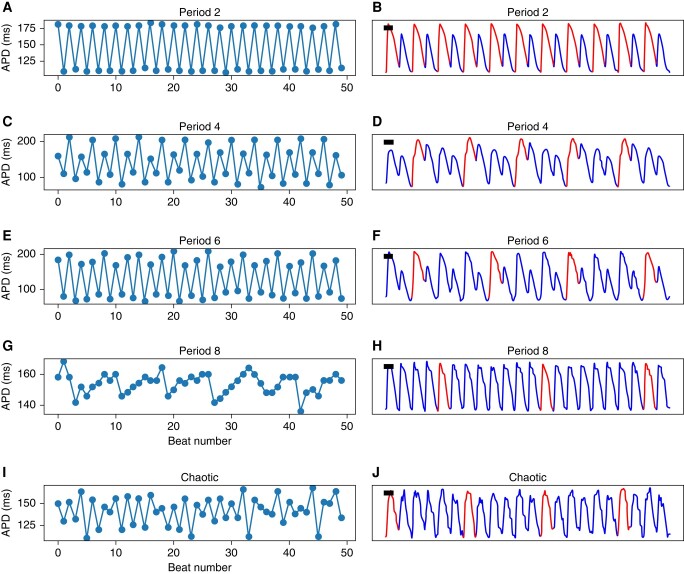
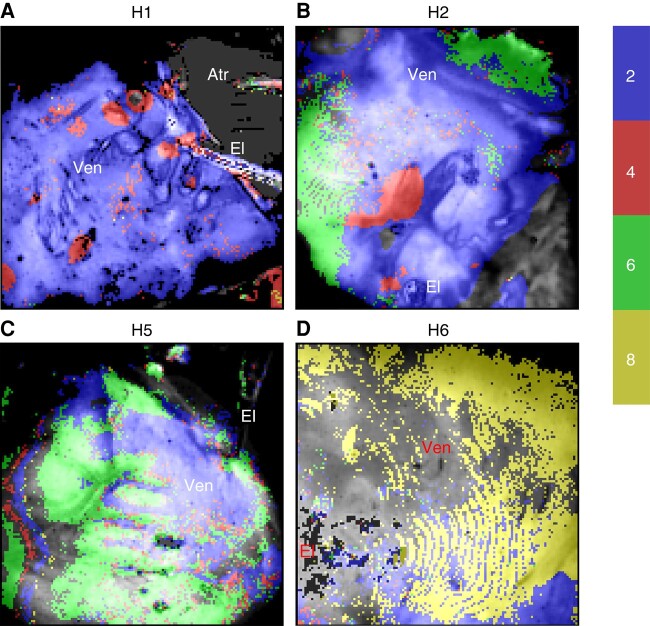
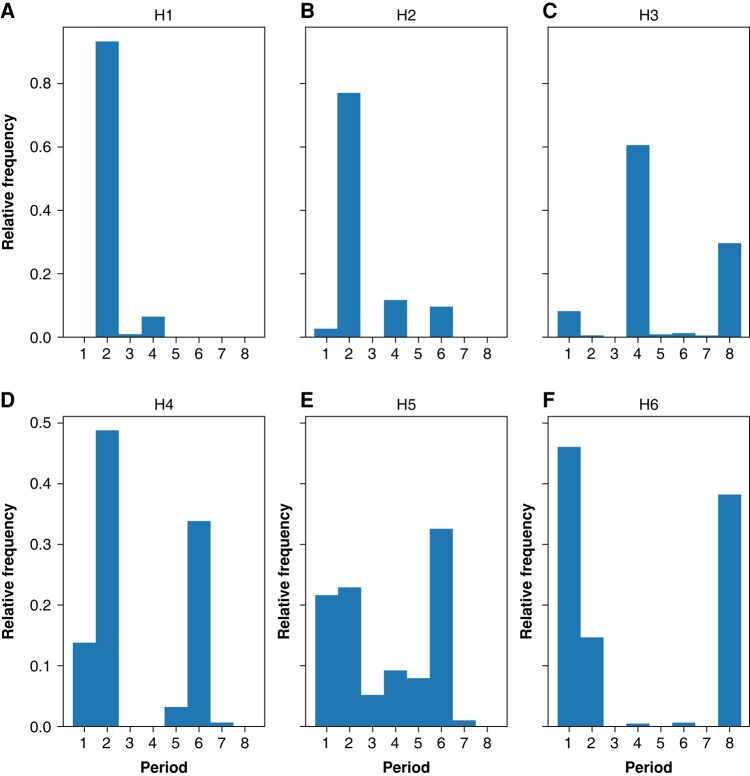
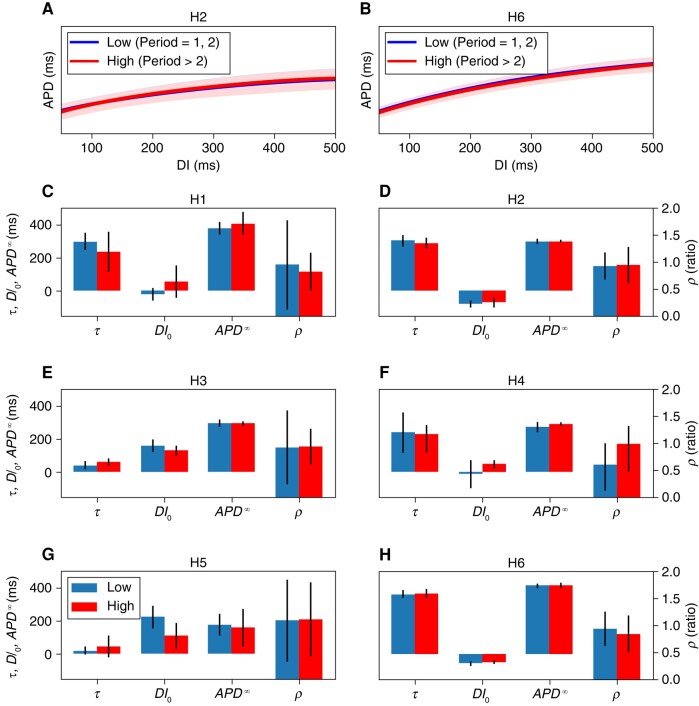
Methods and results: We performed optical mapping of explanted human hearts obtained from recipients of heart transplantation at the time of surgery. Signals recorded from the right ventricle endocardial surface were processed to detect global and local repolarization dynamics during rapid pacing. A statistically significant global 1:4 peak was seen in three of six hearts. Local (pixel-wise) analysis revealed the spatially heterogeneous distribution of Periods 4, 6, and 8, with the regional presence of periods greater than two in all the hearts. There was no significant correlation between the underlying restitution properties and the period of each pixel.

Conclusion: We present evidence of complex higher-order periodicities and the co-existence of such regions with stable non-chaotic areas in ex vivo human hearts. We infer that the oscillation of the calcium cycling machinery is the primary mechanism of higher-order dynamics. These higher-order regions may act as niduses of instability and may provide targets for substrate-based ablation of VF.

Keywords: Heart transplantation; Nonlinear dynamics; Optical mapping; Signal processing; Ventricular fibrillation.


Conflict of interest statement

Conflict of interest: None declared.

Figures

Graphical Abstract
Graphical Abstract
Figure 1
Figure 1
(A) The schematics of global analysis. Spatiotemporally processed signals recorded from multiple points on a line, showing staggered action potentials upstrokes consistent with wavefront propagation. (B) Same signals as A shifted to align the upstrokes. (C) The first principle component ( W1) displays alternans. (D) Spectrogram of C, showing a 1:2 peak of alternans. The second principle component ( W2) displays more pronounced alternans larger than C (E). Spectrogram of E, shows a prominent 1:2 peak of alternans (F). The bar in A depicts 200 ms.
Figure 2
Figure 2
The schematic of composite restitution-curve generation. An exponential curve fits a set of (DI, APD) data points for one pixel. (A) The 95% confidence-interval curves are also shown. (B) The restitution curves for all the pixels in a region of interest (say, with Period-2 on the local analysis) are calculated (only 100 curves are shown here). (C) Monte Carlo sampling is performed to generate a composite restitution curve (the thick central line) and the confidence interval (shown as a continuum). APD, action potential duration; DI, diastolic interval.
Figure 3
Figure 3
Comparison of baseline and pre-VF spectrograms using global analysis. The lower spectrograms are the baseline (stimulation cycle length of 500 ms except for H4 at 800 ms) and the upper spectrograms are obtained just before VF induction. (A and B) H1, H2 exhibit prominent 1:4 peaks, while no discernable 1:4 peak is seen for (D) H6. H4 has a ∼0.18 peak, corresponding to mainly (C) Period-6 activity. The baseline signals are multiplied by 0.1 to offset the signals for better visualization.
Figure 4
Figure 4
The pacing frequency dependence of 1:2 and 1:4 peaks. In both panels, the 1:2 peak (the classic APD alternans) starts when the cycle length decreases to ∼400 ms. On the other hand, the 1:4 peak only rises above the baseline once the cycle length decreases to 300–350 ms. Also, note the different scaling of the 1:4 peak compared with the 1:2 peak, which is 2–3 orders of magnitude smaller than the 1:2 peak. These results significantly reduce the chance that the observed 1:4 peaks are processing artefacts and point to their dynamical origin.
Figure 5
Figure 5
Examples of signals with different periodicities. Representative pixel-level optical-mapping signals with (A and B) Period-2, (C and D) Period-4, (E and F) Period-6, (G and H) Period-8, and (I and J) higher-order/chaotic are shown. Note the intermittency of Period-8. APD, action potential duration.
Figure 6
Figure 6
The distribution of higher-order areas. (A) In H1, there are multiple Period-4 areas in a sea of classic alternans. (B) H2 shows both 1:4 and 1:6 areas. (C) H5 has large areas of Period-6 without significant Period-4. (D) The main feature of H6 is a large area of Period-8 without significant 1:2 or 1:4 regions . The background images represent anatomy. The pixels are colored based on their periodicitiy according to the colorbar on the right. Atr, atrial; El, pacing electrode; Ven, ventricles.
Figure 7
Figure 7
The relative frequency of different periodicities. Each histogram shows the relative proportions of pixels with a given period (in the range of 1–8) for each of the six hearts.
Figure 8
Figure 8
The electrophysiological characteristics of areas with different periodicities. The top row (A and B) shows the overlapped restitution curves for two hearts. The curves depict regions of Periods 1 and 2 (low) and areas of Periods 3–8 (high). The restitution curves are so similar that it is difficult to separate the two curves. (CH) The electrophysiological properties (restitution-curve parameters and conduction velocity) between each heart’s low and high periods regions. Restitution curves are parameterized by APD, DI0, and τ (see the Methods section). The ratio of conduction velocity at fast pacing rates (the last three recordings before fibrillation) to the conduction velocity during slow pacing (remaining recordings) is denoted ρ.

Update of

References

    1. Weiss JN, Qu Z, Chen P-S, Lin S-F, Karagueuzian HS, Hayashi H et al. The dynamics of cardiac fibrillation. Circulation 2005;112:1232–40. - PubMed
    1. Fenton FH, Cherry EM, Hastings HM, Evans SJ. Multiple mechanisms of spiral wave breakup in a model of cardiac electrical activity. Chaos 2002;12:852–92. - PubMed
    1. Jalife J. Ventricular fibrillation: mechanisms of initiation and maintenance. Annu Rev Physiol 2000;62:25–50. - PubMed
    1. Pastore JM, Girouard SD, Laurita KR, Akar FG, Rosenbaum DS. Mechanism linking T-wave alternans to the genesis of cardiac fibrillation. Circulation 1999;99:1385–94. - PubMed
    1. Pastore JM, Rosenbaum DS. Role of structural barriers in the mechanism of alternans-induced reentry. Circ Res 2000;87:1157–63. - PubMed