. 2023 Dec 5;35(12):2183-2199.e7.
doi: 10.1016/j.cmet.2023.11.001. Epub 2023 Nov 24.

PRMT1 orchestrates with SAMTOR to govern mTORC1 methionine sensing via Arg-methylation of NPRL2

Affiliations

PRMT1 orchestrates with SAMTOR to govern mTORC1 methionine sensing via Arg-methylation of NPRL2

Cong Jiang et al. Cell Metab. .

Abstract

Methionine is an essential branch of diverse nutrient inputs that dictate mTORC1 activation. In the absence of methionine, SAMTOR binds to GATOR1 and inhibits mTORC1 signaling. However, how mTORC1 is activated upon methionine stimulation remains largely elusive. Here, we report that PRMT1 senses methionine/SAM by utilizing SAM as a cofactor for an enzymatic activity-based regulation of mTORC1 signaling. Under methionine-sufficient conditions, elevated cytosolic SAM releases SAMTOR from GATOR1, which confers the association of PRMT1 with GATOR1. Subsequently, SAM-loaded PRMT1 methylates NPRL2, the catalytic subunit of GATOR1, thereby suppressing its GAP activity and leading to mTORC1 activation. Notably, genetic or pharmacological inhibition of PRMT1 impedes hepatic methionine sensing by mTORC1 and improves insulin sensitivity in aged mice, establishing the role of PRMT1-mediated methionine sensing at physiological levels. Thus, PRMT1 coordinates with SAMTOR to form the methionine-sensing apparatus of mTORC1 signaling.

Keywords: GATOR1; NPRL2; PRMT1; arginine methylation; mTOR; methionine sensing; nutrient sensing.


Conflict of interest statement

Declaration of interests W.W. is a co-founder and consultant for ReKindle Therapeutics.

Figures
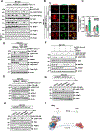
Figure 1.
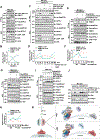
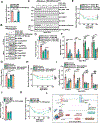
Figure 1.. PRMT1 signals methionine availability to regulate mTORC1 activation in a SAM-dependent manner.
A, Control and PRMT1 deficient HEK293 cells were deprived of methionine for 2 hours (h) and restimulated with methionine (100 μM) for 20 min. HEK293 cells were infected with either tet-on-shLuc or tet-on-shPRMT1 lentiviruses and selected with puromycin for 3 days. The stable cell lines were pretreated with or without doxycycline (DOX) for an additional 2 days before methionine starvation and restimulation. Whole-cell lysates (WCL) or r-GTP- immunoprecipitates were analyzed by immunoblotting with the indicated antibodies. pS6K(S): short-term exposure, pS6K(L): long-term exposure. Due to space limitations, we only present the short-term exposure of pS6K in the remaining figures. B, HEK 293 cells were treated as in A, and the co-localization of mTORC1 and LAMP2 was analyzed via immunostaining. Scale bar, 10 μm. C, Pearson’s correlation analysis of mTOR and LAMP2 signals in B. 10 cells were analyzed for each condition, ***p<0.001, unpaired, two-tailed Student’s t-test. D, Control and PRMT1 deficient HEK293 cells were transfected with constructs to express either Metap2 (control) or RagAQ66L+RagCS75N. Cells were treated as described in A, and cell lysates were analyzed by immunoblotting with the indicated antibodies. E, Wild-type or NPRL2 knockout HEK293 cells were infected with the indicated lentivirus and treated as in A, and cell lysates were analyzed via immunoblotting with the indicated antibodies. F, PRMT1 is required to signal methionine sufficiency to mTORC1 via MAT2A-mediated SAM production. The MAT2A Dox-off cell line was generated as described in the previous study and transfected with siRNA targeting PRMT1, as indicated. Cells were treated with or without DOX for 48 hours, followed by deprivation of methionine for 2 hours and restimulation with methionine (100 μM) for 20 min or SAM (100 μM) for 6 hours. Cell lysates were analyzed via immunoblotting with the indicated antibodies. G-H, Wild-type PRMT1, but not the SAM-binding-deficient mutants (G98R and E162Q), restored mTORC1 activation upon methionine (G) or SAM (H) stimulation. HEK293 cells expressing tet-on-shPRMT1 targeting the PRMT1–3’UTR were infected with either PRMT1 wild-type, G98R, or E162Q lentiviruses. The stable cell lines were pre-treated with or without DOX for an additional 2 days, deprived of methionine for 2 hours, and restimulated with methionine (100 μM) for 20 min or SAM (100 μM) for 6 hours. Cell lysates were analyzed via immunoblotting with the indicated antibodies. I, A schematic illustration showing that PRMT1 signals methionine availability to govern mTORC1 activation through the GATOR1 complex. See also Figure S1.
Figure 2.
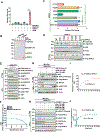
Figure 2.. PRMT1 coordinates with SAMTOR to dictate mTORC1 activation.
A-B, NPRL2Flag knock-in HEK293T cells were starved of methionine for 2 hours and restimulated with methionine (100 μM) for the indicated time. Whole-cell lysis (WCL) and anti-FLAG immunoprecipitates (IPs) were analyzed via immunoblotting with the indicated antibodies. Quantified values of the immunoblotting of A were shown as in B. Data are representative one repeat. C-D, NPRL2Flag knock-in HEK293T MAT2A Dox-off cell lines were generated as described in the previous study. The stable cell lines were pre-treated with or without doxycycline (DOX) for an additional 2 days, starved of methionine for 2 hours, and restimulated with either methionine (100 μM) or SAM (100 μM) for the indicated time. WCL and anti-FLAG IPs were analyzed via immunoblotting with the indicated antibodies. Quantified values of the immunoblotting of C were shown in D. Data are representative one repeat. E-H, HEK293 SAMTOR-null cells were transfected with Flag-NPRL2 and wild-type SAMTOR or the indicated D190A (E) or F135A (G) mutants, starved of methionine for 2 hours and restimulated with methionine (100 μM) for the indicated times. The WCL and anti-FLAG IPs were analyzed via immunoblotting with the indicated antibodies. Quantified values of the immunoblotting of E and G were shown as in F, H. Data are representative one repeat. I, NPRL2Flag knock-in HEK293T cells expressing with or without sgSAMTOR were starved of methionine for 2 hours and restimulated with methionine (100 μM) for 20 min. The WCL and anti-FLAG IPs were analyzed via immunoblotting with the indicated antibodies. J, SAMTOR and PRMT1 function in parallel to sense methionine availability to mTORC1. HEK293 cells were infected with sgControl, sgSAMTOR, or tet-on-shPRMT1 as indicated and selected with puromycin (1 μg/mL) for 4 days. Cells were pre-treated with or without DOX for 2 days to suppress PRMT1 expression and then challenged as in I, followed by lysis and immunoblotting with the indicated antibodies. K, A schematic illustration of PRMT1-GATOR1-SAMTOR interaction and mTORC1 regulation in response to methionine signals. See also Figure S2.
Figure 3.
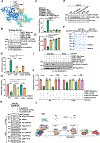
Figure 3.. PRMT1 methylates NPRL2 at R78 residue.
A, PRMT1, but not SAMTOR, promotes the methylation of the GATOR1 complex. Purified GATOR1 (250 nM) was subjected to in vitro methylation assays for 1 hour in the presence of SAM (1 μM), PRMT1 (100 ng) and SAMTOR (100 ng), and the generation of SAH was analyzed via the MTase-Glo Methyltransferase Assay kit. B, Immunoblotting with the ADMA levels of GATOR1 complex components from A using a panADMA antibody. C, GST-NPRL2 (wild-type and mutants) were subjected to in vitro methylation analysis as in A. D, The methylation of NPRL2 (wild-type and mutant) was analyzed with ADMA antibody in cells. E, Methionine removal inhibited NPRL2 R78me2a methylation. Cells were subjected to anti-Flag immunoprecipitation and analyzed via immunoblotting with NPRL2 R78me2 antibody. F, The correlation of cytosolic SAM levels, NPRL2 R78me2, and mTORC1 activity (pS6K) from E are presented in F. Data are representative one repeat. G, NPRL2Flag knock-in MAT2A Dox-off HEK293T cell lines were generated as described in the previous study. Cells were pretreated with doxycycline (DOX) for 2 days, starved of methionine for 2 hours, and restimulated with methionine (100 μM) or SAM (100 μM) for the indicated time. The WCL and anti-Flag IPs were analyzed via immunoblotting with the indicated antibodies, including a homemade-specific antibody against NPRL2 R78me2a. H, NPRL2Flag knock-in HEK293T cells expressing tet-on-shPRMT1 were pretreated with DOX for 2 days to knockdown PRMT1, starved of methionine for 2 hours, and restimulated with methionine (100 μM) for 20 min or SAH (100 μM), SAM (100 μM), and Hcy (100 μM) for 6 hours. The WCL and anti-Flag IPs were analyzed via immunoblotting with the indicated antibodies. I-J, The Km of SAM for human PRMT1 to mediate the methylation of NPRL2 (I) and H4 (J). Purified NPRL2 proteins (10 ng) were incubated with PRMT1 (20 ng) together with the indicated concentrations of SAM, and the level of SAH generation was analyzed as described in A. n=3 biological repeats. See also Figure S3.
Figure 4.
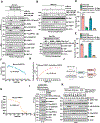
Figure 4.. PRMT1 inhibits the GAP activity of GATOR1.
A, Structure of the GATOR1 complex (Protein Data Bank code 6CET) displayed by PyMOL. B-C, PRMT1 methylates NPRL2 and antagonizes the GAP activity of the GATOR1 complex. Purified GATOR1 complex was subjected to in vitro methylation assays with PRMT1 WT or mutants (G98R, E166Q), with or without PRMT1 inhibitors, and analyzed via the MTase-Glo Methyltransferase Assay kit (B) or immunoblotting with the specific antibody for NPRL2 R78me2a (C). n=3 biological repeats, ***p<0.001, unpaired, two-tailed Student’s t-test. D, PRMT1-mediated asymmetric di-methylation of NPRL2 impairs the GAP activity of the GATOR1 complex. The purified GATOR1 complex was subjected to in vitro methylation assays as in f and was further subjected to GAP activity analysis. n=3 biological repeats, ***p<0.001, unpaired, two-tailed Student’s t-test. E, The activation of mTORC1 by methionine is decreased in cells expressing the NPRL2 K75A and L82A mutants. NPRL2 null HEK293T cells were infected with either wild-type NPRL2 or the indicated mutants, starved of methionine for 2 hours, restimulated with methionine (100 μM) for 20 min, and analyzed via immunoblotting with the indicated antibodies. F, Coomassie blue staining of the purified GATOR1 complex containing either wild-type NPRL2 or the indicated mutants. G, Mutation of the flanking residues near R78 in NPRL2 protein attenuated PRMT1-mediated methylation. The purified GATOR1 complex containing either wild-type NPRL2 or the indicated mutants were subjected to in vitro methylation assays as described in B. n=3 biological repeats, ***p<0.001, unpaired, two-tailed Student’s t-test. H, Methylation of R78 in NPRL2 protein is essential for PRMT1-mediated inhibition of the GAP activity of GATOR1. The purified GATOR1 complex containing either wild-type NPRL2 or the indicated mutants were subjected to in vitro methylation assays as described in B. n=3 biological repeats, ***p<0.001,**p<0.01, unpaired, two-tailed Student’s t-test. I-J, SAMTOR blocked PRMT1-mediated inhibitory effect on GATOR1 activity in vitro. The purified GATOR1 complex was subjected to in vitro methylation assays as indicated and was analyzed via the MTase-Glo Methyltransferase Assay kit (I) or immunoblotting with the specific antibody for NPRL2 R78me2a (J). n=3 biological repeats, ns, no significant difference, ***p<0.001, **p<0.01, unpaired, two-tailed Student’s t-test. K, SAMTOR D190A mutant, but not wild-type, blunted PRMT1-mediated NPRL2 asymmetric di-methylation in cells. L, A schematic model depicting PRMT1-mediated NPRL2 asymmetric di-methylation in methionine sensing of mTORC1 signaling. See also Figure S4.
Figure 5.
Figure 5.. PRMT1 is a physiological methionine/SAM sensor for mTORC1.
A, Primary hepatocytes expressing Flag-Nprl2/HA-Samtor were infected with TBG-shLuc or TBG-shMat1a shRNA. At 72 hours post-infection, cells were deprived of methionine for 2 hour and restimulated with methionine (100 μM) or SAM (100 μM) for the indicated time. The WCL and anti-FLAG IPs were analyzed via immunoblotting with the indicated antibodies. B, Primary hepatocytes were infected with the indicated shRNA. Cells were then deprived of methionine for 2 hours and restimulated with methionine (100 μM) for 20 mins or SAM (100 μM) for 6 hours. Cell lysates were analyzed by immunoblotting with the indicated antibodies. C, Primary hepatocytes were infected as indicated. After 72 hours, cells were treated and analyzed as described in A. D-E, Methionine deprivation significantly reduced SAM levels in the liver. Mice were fasted for 24 hours and refed with 3% or 0% methionine diet for 24 hours. Plasma methionine levels were analyzed via ELISA. (D) Liver tissues were collected for cytosolic SAM level measurement by ELISA (E) (n=6 per group, ***p<0.001, unpaired, two-tailed Student’s t-test). F-G, The Kd of mouse SAM-SAMTOR and SAM-PRMT1 as determined by the MST assay. n=3 biological repeats were presented. H, The Km of SAM for mouse PRMT1 to mediate the methylation of NPRL2. Purified NPRL2 proteins (10 ng) were incubated with mouse PRMT1 (20 ng) together with the indicated concentrations of SAM, and the level of SAH generation was analyzed via the MTase-Glo Methyltransferase Assay kit. n=3 biological repeats were presented. I, Dietary methionine regulates Prmt1-Nprl2-Samtor interaction and Prmt1-mediated Nprl2 methylation in the liver. Wild-type male mice with hepatic expression of TBG-Flag-Nprl2 and TBG-HA-Samtor were treated as in D, and the liver lysates were subjected to anti-Flag immunoprecipitation (IP). WCL and IPs were analyzed by immunoblotting with the indicated antibodies. J-K, A schematic illustration of the experimental setup for studying methionine sensing in vivo. Mice were injected with the respective adenovirus for 21 days to knock down endogenous Prmt1 and overexpress Nprl2 (wild-type or R78F mutant) in the liver as indicated. Mice were then fasted for 24 hours and refed with 3% or 0% methionine diet for 24 hours (J). Liver tissues prepared from the indicated mice were analyzed by immunoblotting with the indicated antibodies (K) (n=2 per group). See also Figure S5.
Figure 6.
Figure 6.. Hepatic Prmt1-Nprl2-mTORC1 dictates insulin sensitivity to dietary methionine restriction in aged mice.
A, Mice with a hepatic expression of TBG-Flag-Nprl2/TBG-HA-Samtor were fed with the indicated methionine diet (0.84% or 0.18%) or orally administrated with PRMT1 inhibitor (GSK3368715) for 50 days The liver lysates were prepared for SAM level measurement by ELISA (n=6 per group, ***p<0.001, unpaired, two-tailed Student’s t-test). B, The WCL and IPs of the liver lysates from A were analyzed by immunoblotting with the indicated antibodies. C-F, Aged mice (13-month-old) were injected with shLuc or shPrmt1 adenoviruses to knock down endogenous Prmt1. The mice were fed 0.84% or 0.18% methionine diets for 50 days. Liver lysates were subjected to immunoblotting with the indicated antibodies (C) (n=3 per group). The plasma insulin levels were determined by ELISA (n=6 per group) (D). The Intraperitoneal Insulin Tolerance Test (ITT) assay was performed with the indicated mice (n=6 per group) (E). The expression levels of the indicated genes were measured by qPCR (n=6 per group) (F). **p<0.01, ***p<0.001. G-I, Mice were infected with the indicated adenoviruses for 21 days. Plasma insulin levels were determined by ELISA (n=6 per group) (G). The ITT was performed on the indicated mice (n=6 per group) (H). The expression levels of the indicated genes were measured by qPCR (n=6 mice) (I). J-K, Mice were treated as in C. Plasma insulin levels were measured by ELISA (n=6 mice) (J). The ITT was performed on the indicated mice (n=6 per group) (K). ns, no significant difference, **p<0.01, ***p<0.001. L, A schematic model depicting PRMT1-mediated NPRL2 methylation in methionine sensing of mTORC1 signaling to regulate insulin sensitivity in aged mice. See also Figure S6.

Similar articles

Cited by

References

    1. Kim J, and Guan KL (2019). mTOR as a central hub of nutrient signalling and cell growth. Nat Cell Biol 21, 63–71. 10.1038/s41556-018-0205-1. - DOI - PubMed
    1. Liu GY, and Sabatini DM (2020). mTOR at the nexus of nutrition, growth, ageing and disease. Nat Rev Mol Cell Biol 21, 183–203. 10.1038/s41580-019-0199-y. - DOI - PMC - PubMed
    1. Ma XM, and Blenis J. (2009). Molecular mechanisms of mTOR-mediated translational control. Nat Rev Mol Cell Biol 10, 307–318. 10.1038/nrm2672. - DOI - PubMed
    1. Saxton RA, and Sabatini DM (2017). mTOR Signaling in Growth, Metabolism, and Disease. Cell 169, 361–371. 10.1016/j.cell.2017.03.035. - DOI - PubMed
    1. Mossmann D, Park S, and Hall MN (2018). mTOR signalling and cellular metabolism are mutual determinants in cancer. Nat Rev Cancer 18, 744–757. 10.1038/s41568-018-0074-8. - DOI - PubMed

Publication types