. 2023 Nov 24;11(11):e007030.
doi: 10.1136/jitc-2023-007030.

Single-cell RNA-sequencing atlas reveals an FABP1-dependent immunosuppressive environment in hepatocellular carcinoma

Affiliations

Single-cell RNA-sequencing atlas reveals an FABP1-dependent immunosuppressive environment in hepatocellular carcinoma

Weiwei Tang et al. J Immunother Cancer. .

Abstract

Background: Single-cell RNA sequencing, also known as scRNA-seq, is a method profiling cell populations on an individual cell basis. It is particularly useful for more deeply understanding cell behavior in a complicated tumor microenvironment. Although several previous studies have examined scRNA-seq for hepatocellular carcinoma (HCC) tissues, no one has tested and analyzed HCC with different stages.

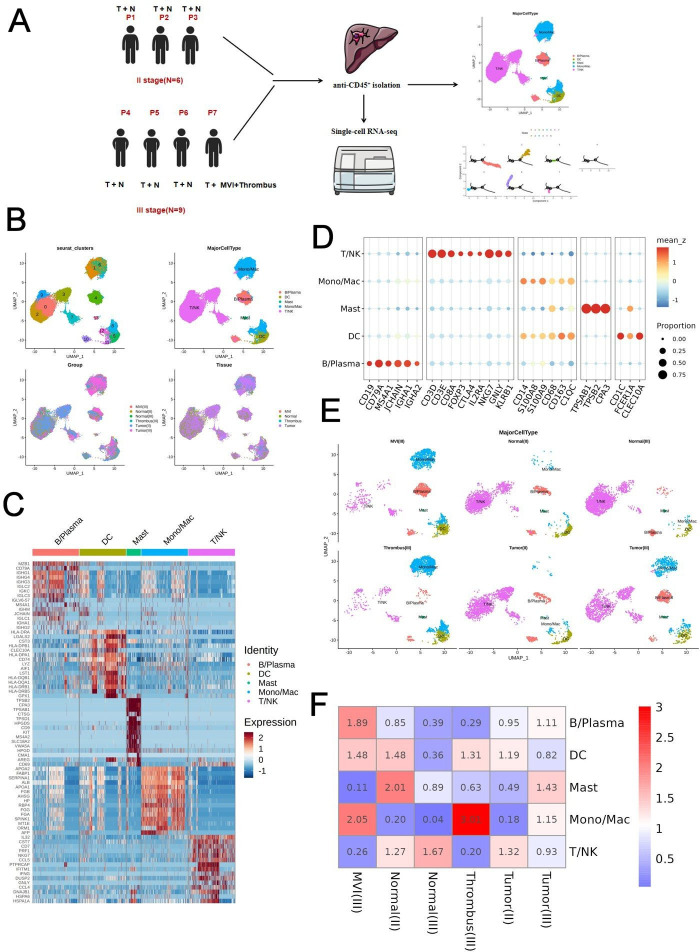
Methods: In this investigation, immune cells isolated from surrounding normal tissues and cancer tissues from 3 II-stage and 4 III-stage HCC cases were subjected to deep scRNA-seq. The analysis included 15 samples. We distinguished developmentally relevant trajectories, unique immune cell subtypes, and enriched pathways regarding differential genes. Western blot and co-immunoprecipitation were performed to demonstrate the interaction between fatty acid binding protein 1 (FABP1) and peroxisome proliferator-activated receptor gamma(PPARG). In vivo experiments were performed in a C57BL/6 mouse model of HCC established via subcutaneous injection.

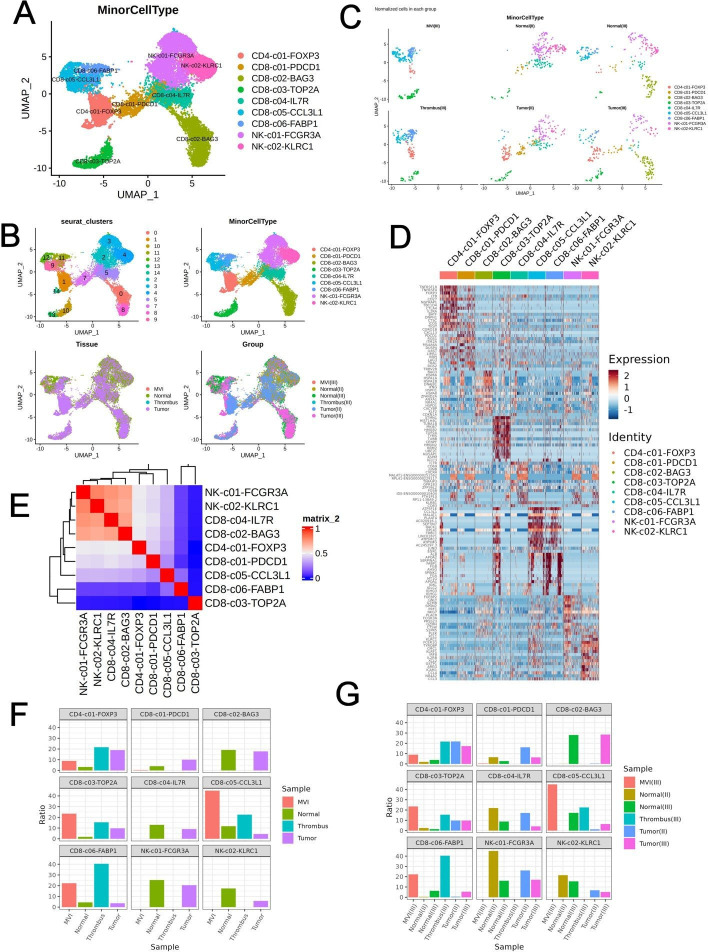
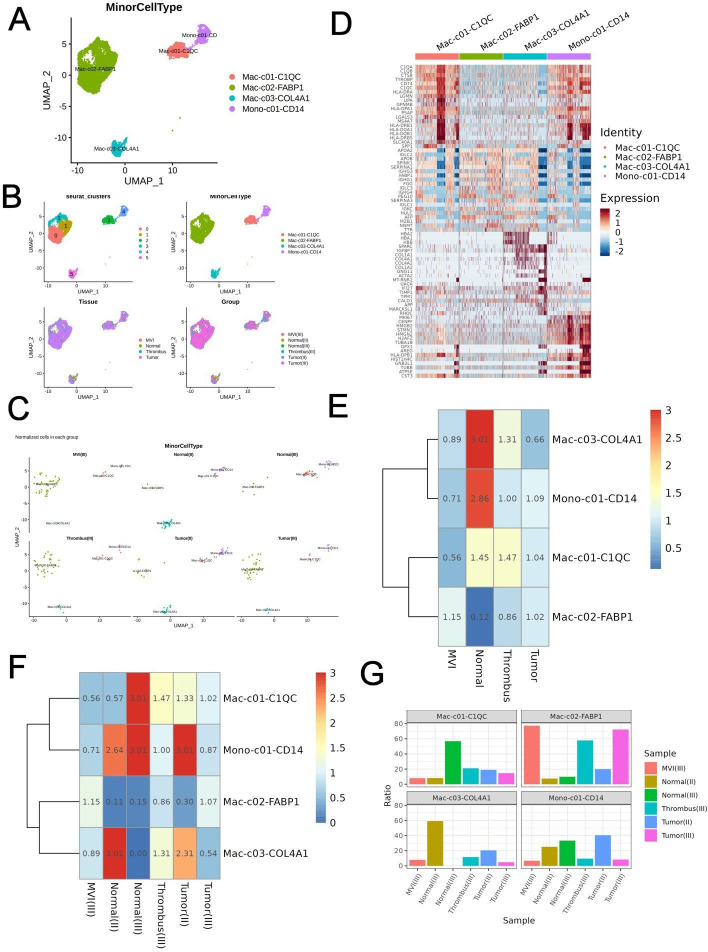
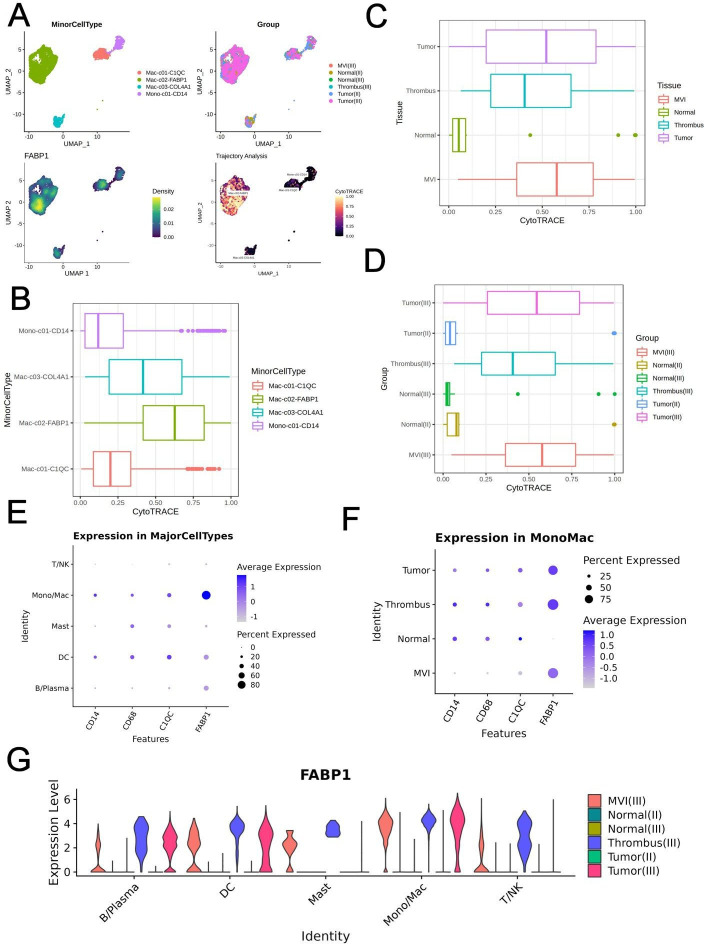
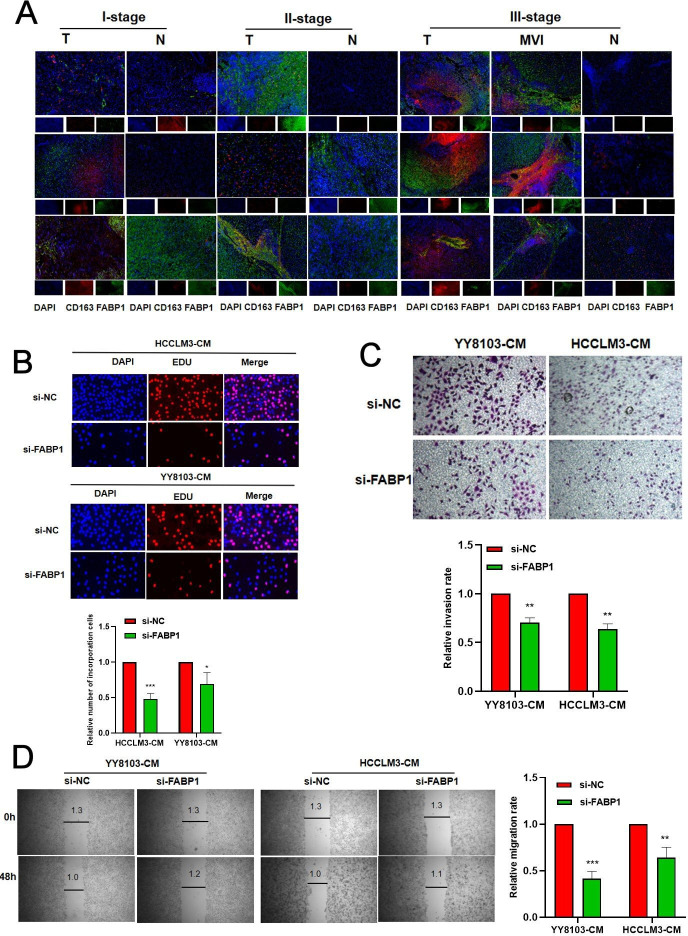
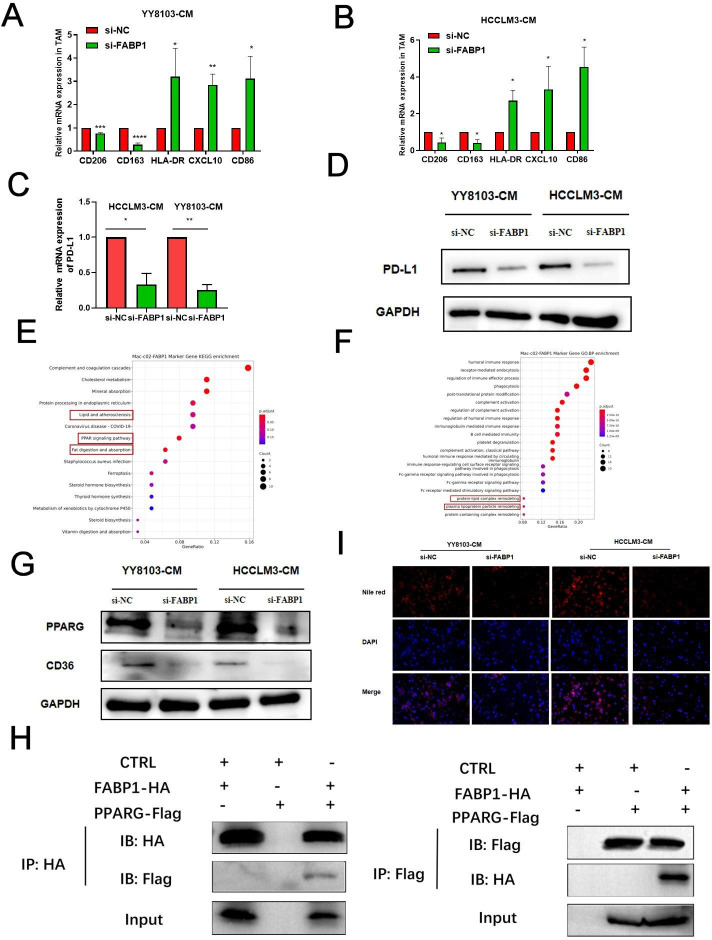
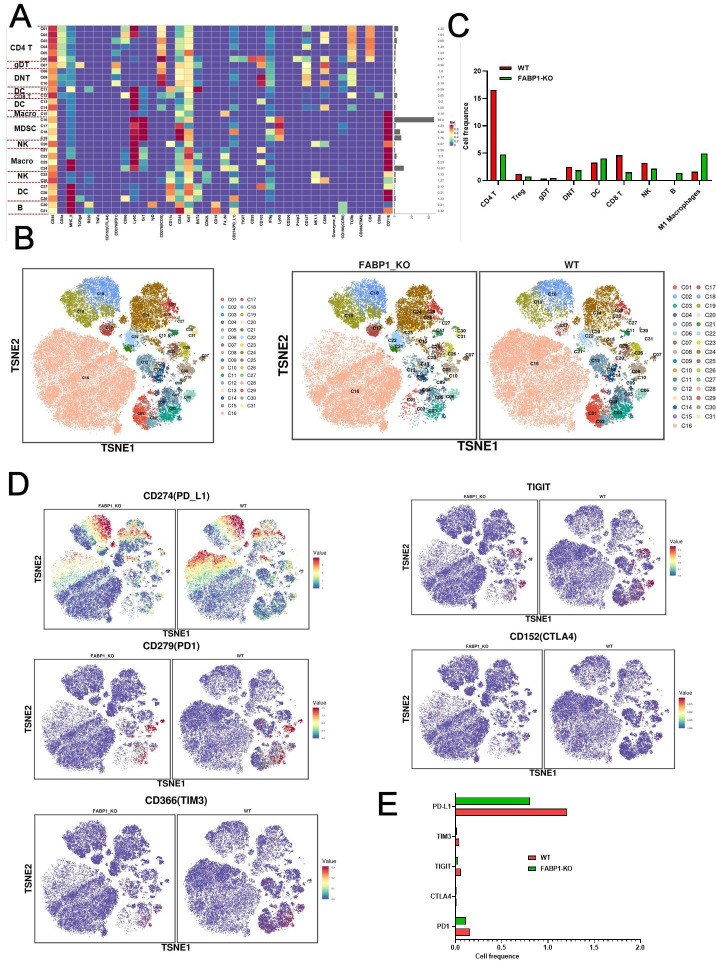
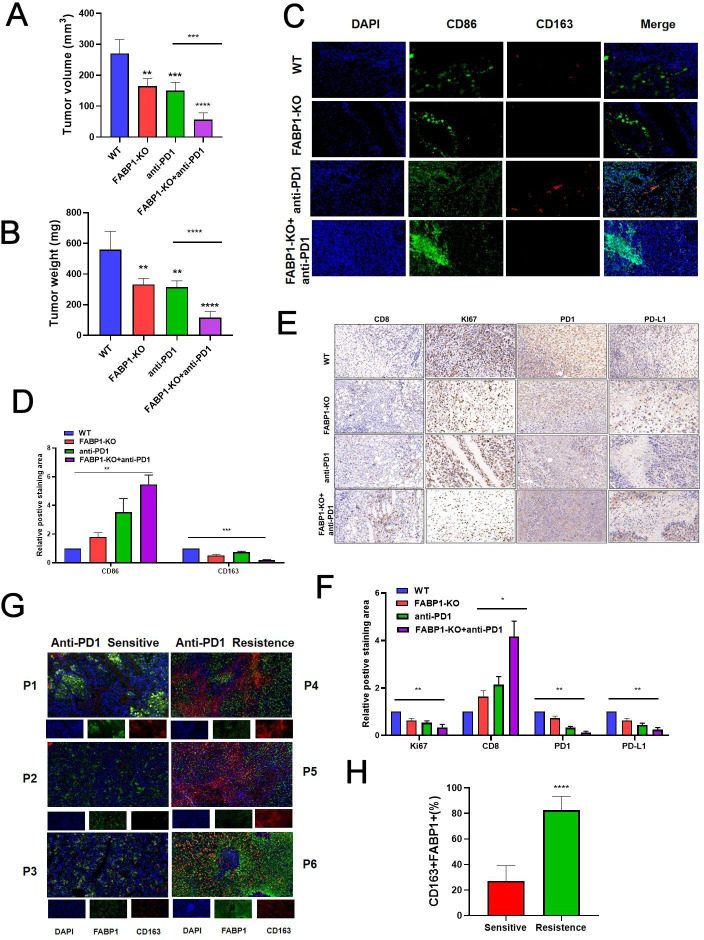
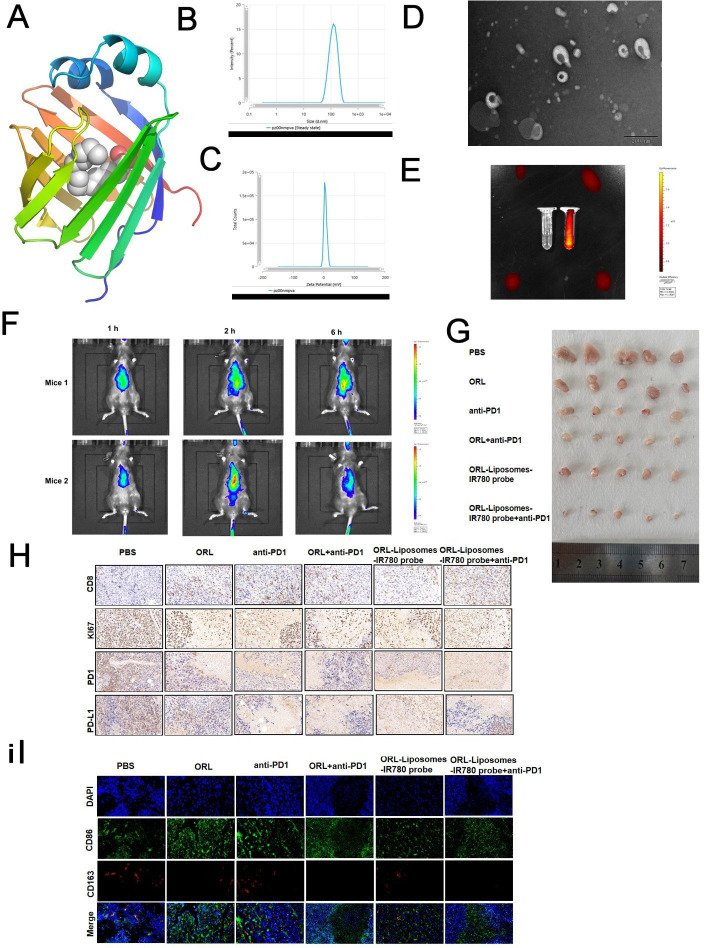
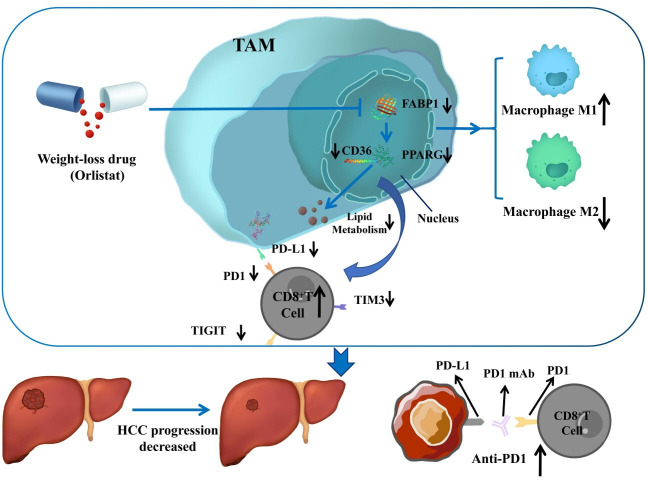
Results: FABP1 was discovered to be overexpressed in tumor-associated macrophages (TAMs) with III-stage HCC tissues compared with II-stage HCC tissues. This finding was fully supported by immunofluorescence detection in significant amounts of HCC human samples. FABP1 deficiency in TAMs inhibited HCC progression in vitro. Mechanistically, FABP1 interacted with PPARG/CD36 in TAMs to increase fatty acid oxidation in HCC. When compared with C57BL/6 mice of the wild type, tumors in FABP1-/- mice consistently showed attenuation. The FABP1-/- group's relative proportion of regulatory T cells and natural killer cells showed a downward trend, while dendritic cells, M1 macrophages, and B cells showed an upward trend, according to the results of mass cytometry. In further clinical translation, we found that orlistat significantly inhibited FABP1 activity, while the combination of anti-programmed cell death 1(PD-1) could synergistically treat HCC progression. Liposomes loaded with orlistat and connected with IR780 probe could further enhance the therapeutic effect of orlistat and visualize drug metabolism in vivo.

Conclusions: ScRNA-seq atlas revealed an FABP1-dependent immunosuppressive environment in HCC. Orlistat significantly inhibited FABP1 activity, while the combination of anti-PD-1 could synergistically treat HCC progression. This study identified new treatment targets and strategies for HCC progression, contributing to patients with advanced HCC from new perspectives.

Keywords: antibodies, neoplasm; antineoplastic protocols; liver neoplasms.


Conflict of interest statement

Competing interests: No, there are no competing interests.

Figures

Figure 1
Figure 1
Acquiring scRNA-seq profiles of the samples and generating data in HCC. (A) scRNA-seq on immune cells under the isolation in cancer tissues and adjacent representative tissues of 3 II-stage and 4 III-stage HCC cases, and a total of 15 samples were included in the analysis. (B) UMAP displaying diverse immune cell types which have been discovered. (C) Heat maps displaying different cell populations and the markers that distinguish them. (D) Dot plots illustrating the markers that are unique to each cell population. (E) UMAP displaying the distinct immune cell populations present in the different samples. (F) The bar chart illustrating the variations in expression of the different cell populations present in the different samples including Tumor (II), Tumor (III), Normal (II), Normal (III), Thrombus (III), Microvascular invasion (MVI) (III). UMAP, Uniform Manifold Approximation and Projection; DC, dendritic cells; HCC, hepatocellular carcinoma; NK, natural killer; scRNA-seq, single-cell RNA sequencing.
Figure 2
Figure 2
An analysis of T and NK cell clusters in samples from patients with II-stage and III-stage hepatocellular carcinoma. (A) An illustration from UMAP depicting the many T and NK cell types that have been discovered. (B) UMAP displaying distinct T-cell populations and NK cell populations in distinct groups. (C) UMAP demonstrating that various samples contain a variety of T and NK cell populations. (D) Heat maps displaying the many markers that distinguish the T and NK cell populations. (E) Similarity of expression profiles of different cell groups.(F) The bar chart showing T and NK cell population expression in different samples. (G) The bar chart showing T and NK cell population expression in each sample including Tumor (II), Tumor (III), Normal (II), Normal (III), Thrombus (III), Microvascular invasion (MVI) (III). UMAP, Uniform Manifold Approximation and Projection; FABP1, fatty acid binding protein 1; NK, natural killer.
Figure 3
Figure 3
A more in-depth classification of myeloid cell clusters in samples of hepatocellular carcinoma with II-stage and III-stage. (A) An illustration from UMAP illustrating the many myeloid cell populations that have been found. (B) A UMAP displaying the distinct myeloid cell populations separated into their respective groups. (C) UMAP demonstrating the presence of distinct myeloid cell populations in each of the samples. (D) Heat maps displaying the many markers that are unique to each myeloid cell population. (E) The heatmap displaying the expression of the myeloid cell population across the various samples. (F) The heatmap showing myeloid cell population expression in each sample. (G) The bar chart showing myeloid cell population expression in each sample including Tumor (II), Tumor (III), Normal (II), Normal (III), Thrombus (III), Microvascular invasion (MVI) (III). UMAP, Uniform Manifold Approximation and Projection; FABP1, fatty acid binding protein 1.
Figure 4
Figure 4
The progression of the myeloid cell cluster distribution over the course of time in the various samples. (A) UMAP illustrating the FABP1 expression in myeloid cell populations. (B) Developmental trajectories of different myeloid subsets by CytoTRACE analysis. (C) Developmental trajectories of different types of samples by CytoTRACE analysis. (D) The developmental trajectory of each tissue sample including Tumor (II), Tumor (III), Normal (II), Normal (III), Thrombus (III), Microvascular invasion (MVI) (III). (E) The dot plots illustrating the expression of FABP1 in the various subsets of data. (F) A dot plot illustrating the expression of FABP1 in a variety of tissue samples. (G) A violin diagram illustrating the expression of FABP1 in various subsets of various tissue samples. UMAP, Uniform Manifold Approximation and Projection; DC, dendritic cell; NK, natural killer; FABP1, fatty acid binding protein 1.
Figure 5
Figure 5
The expression of FABP1 in TAMs of HCC and in vitro confirmation. (A) Immunofluorescence image demonstrating the expression of FABP1 in various tissues taken from patients with HCC at various stages of the disease. A total of 27 samples, derived from 15 patients at varying stages of the disease. Each row represents a patient, and the most representative images of three patients in each stage are displayed here. (B) EdU assay of cancer cells treated with TAM supernatant in various groups. (C) A transwell assay was performed on cancer cells with TAM supernatant using various groups. (D) A scratch assay was performed on cancer cells using TAM supernatant in each of the different groups. *p<0.05, **p<0.01, ***p<0.001. DAPI,4',6-diamidino-2-phenylindole; EdU, 5-ethynyl-2' -deoxyuridine; FABP1, fatty acid binding protein 1; HCC, hepatocellular carcinoma; MVI, Microvascular invasion; TAM, tumor-associated macrophage.
Figure 6
Figure 6
FABP1 interacted with PPARG in TAMs to increase fatty acid oxidation in HCC. (A–B) qRT-PCR results of M1/M2 phenotype gene expression in the si-FABP1 and si-NC group after the addition of HCC cancer cell supernatant to TAM cells activation. (C–D) The expression of PD-L1 messenger RNA and protein that was expressed across the various groups. (E–F) KEGG and GO analysis of differentially expressed genes in the Mac-FABP1 cell cluster. (G) The expression of the proteins PPARG and CD36. (H) Co-immunoprecipitation of FABP1 and PPARG. (I) There is a decrease in the total amount of fat in the si-NC and si-FABP1 groups of TAM cells. *p<0.05, **p<0.01, ***p<0.001,****p<0.0001. qRT-PCR,quantitative real time polymerase chain reaction;PD-L1, programmed cell death- ligand 1;PPARG, peroxisome proliferator-activated receptor gamma;DAPI, 4',6-diamidino-2-phenylindole;GAPDH,glyceraldehyde-3-phosphate dehydrogenase; KEGG, Kyoto Encyclopedia of Genes and Genomes;GO, Gene Ontology;FABP1, fatty acid binding protein 1; HCC, hepatocellular carcinoma; TAM, tumor-associated macrophage.
Figure 7
Figure 7
Mass cytometry of tumors from FABP1-KO and WT mice. (A) There were a total of 31 cell clusters that needed to be divided, and each respective cell cluster was subsequently defined. (B) A T-SNE plot illustrating the distribution of 31 cell clusters throughout the respective sample. (C) The histogram that displays the number of instances of each cell cluster across the respective groups. (D) A T-SNE plot illustrating the different groups’ distributions of PD-L1, PD-1, TIGIT, TIM-3, and CTLA-4 in subcutaneous hepatocellular carcinoma tumors. (E) A histogram illustrating the distribution of the number of PD-L1, PD-1, TIGIT, TIM-3, and CTLA-4 cells among the various groups. PD-L1,programmed cell death - ligand 1;PD-1, programmed cell death 1; TIGIT,T cell immunoreceptor with Ig and ITIM domains;TIM-3,T cell immunoglobulin and mucin domain-containing protein 3;CTLA-4, Cytotoxic T lymphocyte associate protein-4;MDSC,Myeloid-derived suppressor cells;KO, knockout;T-SNE,t-distributed Stochastic Neighbor Embedding;DC, dendritic cell; FABP1, fatty acid binding protein 1; NK, natural killer; WT, wild type.
Figure 8
Figure 8
FABP1 deficiency enhanced sensitivity to anti-PD-1 therapy in hepatocellular carcinoma. (A) Analysis of tumor volume changes. (B) Analysis of tumor weight changes. (C–D) Immunofluorescence and analysis in different groups. (E–F) Immunohistochemical results and analysis in different groups. (G–H) Six non-responsive to anti-PD-1 treatment and five responsive to anti-PD-1 treatment human samples for immunofluorescence detection and analysis. Each row represents a patient, and the most representative images of three patients are displayed here. *p<0.05, **p<0.01, ***p<0.001,****p<0.0001. PD-1,programmed cell death 1; PD-L1, programmed cell death- ligand 1; KO, knockout; DAPI, 4',6-diamidino-2-phenylindole;FABP1, fatty acid binding protein 1; WT, wild type.
Figure 9
Figure 9
Orlistat as an FABP1 inhibitor reduced tumor growth and enhanced the effect of anti-PD-1 in hepatocellular carcinoma. (A) Map of the binding sites of orlistat and FABP1. (B) Dynamic light scattering potential of orlistat-coupled fluorescence on liposomes. (C) Zeta potential of orlistat-coupled fluorescence on liposomes. (D) Liposomes-loaded orlistat coupled fluorescence display. (E) Fluorescence imaging of liposomes loaded orlistat with IR780 probe. (F) Metabolic distribution of liposomes-loaded orlistat-linked IR780 probe in two mice. (G) Images of tumors in each group. (H) Immunohistochemical results in different groups. (I–J) Immunofluorescence and analysis in different groups. PD-1,programmed cell death 1;DAPI, 4',6-diamidino-2-phenylindole;ORL,Orlista; FABP1, fatty acid binding protein 1; PBS, phosphate-buffered saline.
Figure 10
Figure 10
Pattern diagram showing that inhibition of FABP1 in TAMs inhibited HCC progression in vitro and in vivo . Moreover, FABP1 interacted with PPARG in TAMs to promote lipid metabolism and progress of HCC. In further clinical translation, we found that orlistat significantly inhibited FABP1 activity, while the combination of anti-PD-1 could synergistically treat HCC progression. FABP1, fatty acid binding protein 1; HCC, hepatocellular carcinoma; TAMs, tumor-associated macrophages.

Similar articles

Cited by

References

    1. Omata M, Cheng A-L, Kokudo N, et al. . Asia-Pacific clinical practice guidelines on the management of hepatocellular carcinoma: a 2017 update. Hepatol Int 2017;11:317–70. 10.1007/s12072-017-9799-9 - DOI - PMC - PubMed
    1. Marrero JA, Kulik LM, Sirlin CB, et al. . Diagnosis, staging, and management of hepatocellular carcinoma: 2018 practice guidance by the American Association for the study of liver diseases. Hepatology 2018;68:723–50. 10.1002/hep.29913 - DOI - PubMed
    1. European Association for the Study of the Liver. Electronic address eee, European Association for the Study of the L . EASL clinical practice guidelines: management of hepatocellular carcinoma. J Hepatol 2018;69:182–236. - PubMed
    1. Petrick JL, Kelly SP, Altekruse SF, et al. . Future of hepatocellular carcinoma incidence in the United States forecast through 2030. J Clin Oncol 2016;34:1787–94. 10.1200/JCO.2015.64.7412 - DOI - PMC - PubMed
    1. Kee K-M, Wang J-H, Lee C-M, et al. . Validation of clinical AJCC/UICC TNM staging system for hepatocellular carcinoma: analysis of 5,613 cases from a medical center in Southern Taiwan. Int J Cancer 2007;120:2650–5. 10.1002/ijc.22616 - DOI - PubMed

Publication types