. 2023 Nov 25;11(1):263.
doi: 10.1186/s40168-023-01703-x.

Multi-site microbiota alteration is a hallmark of kidney stone formation

Affiliations

Multi-site microbiota alteration is a hallmark of kidney stone formation

Kait F Al et al. Microbiome. .

Abstract

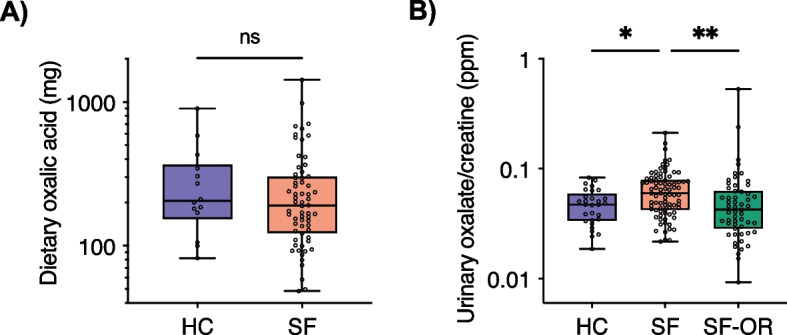
Background: Inquiry of microbiota involvement in kidney stone disease (KSD) has largely focussed on potential oxalate handling abilities by gut bacteria and the increased association with antibiotic exposure. By systematically comparing the gut, urinary, and oral microbiota of 83 stone formers (SF) and 30 healthy controls (HC), we provide a unified assessment of the bacterial contribution to KSD.

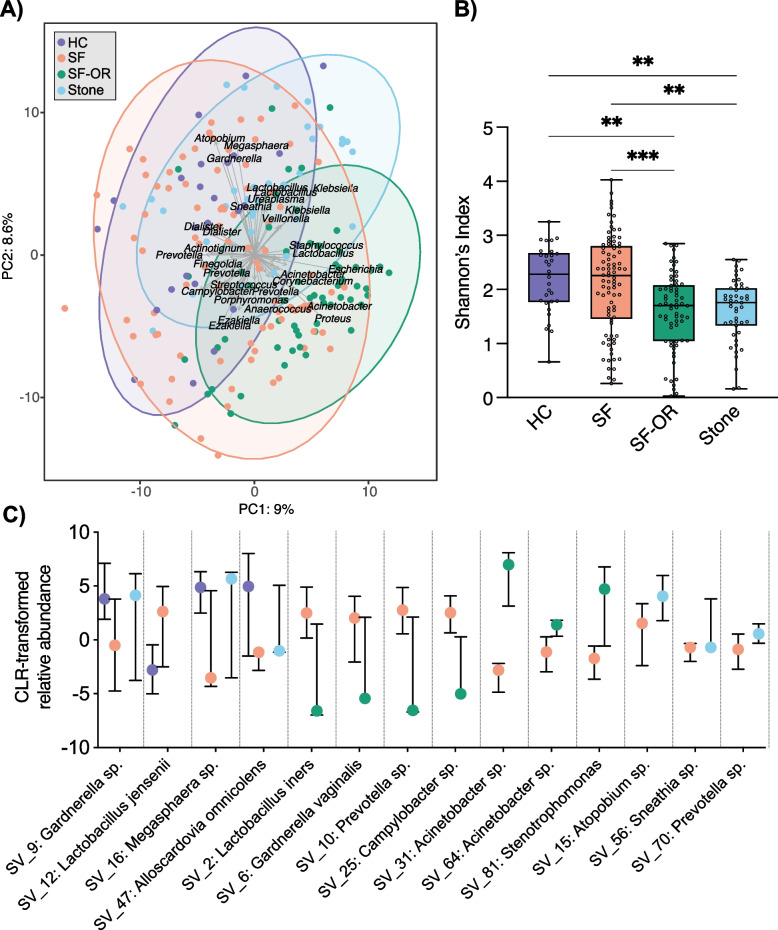
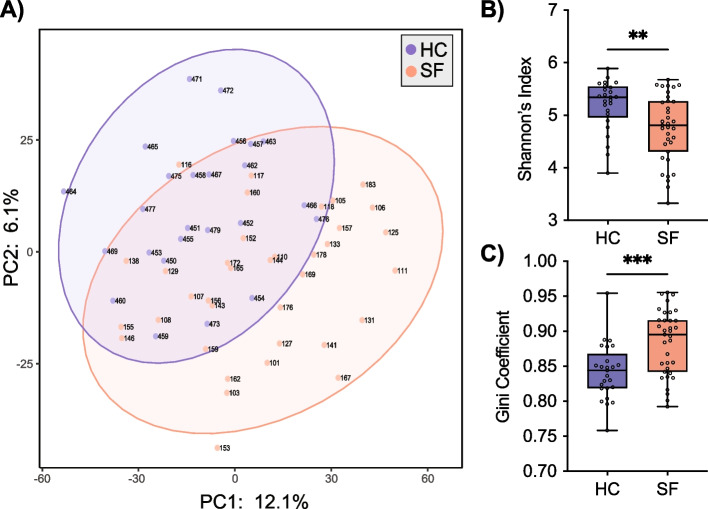
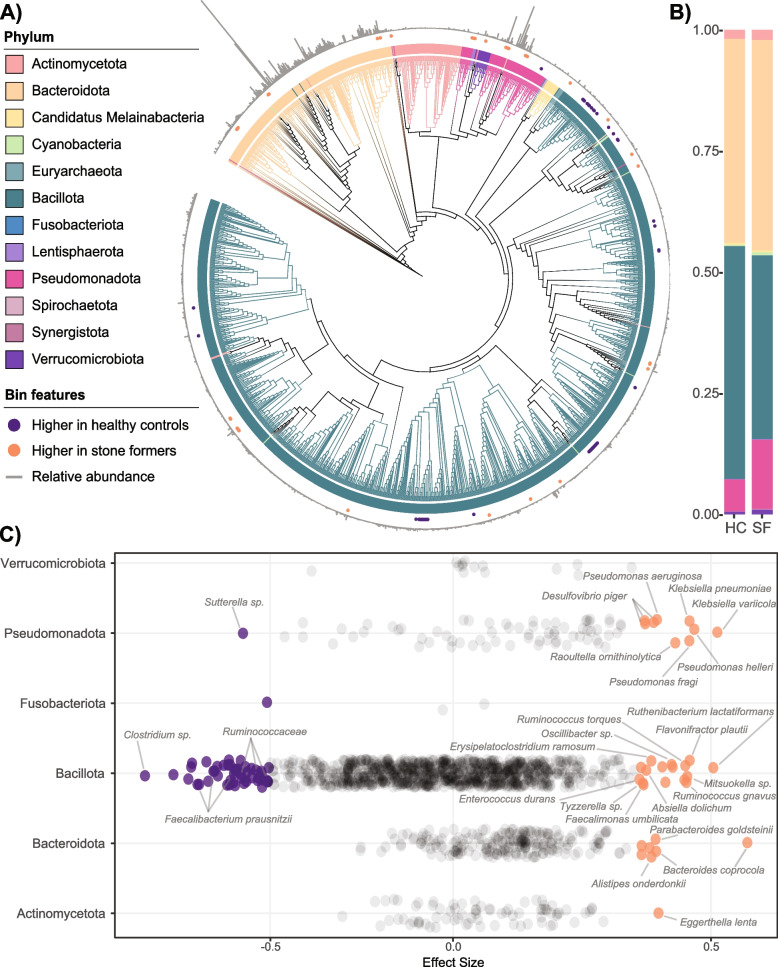
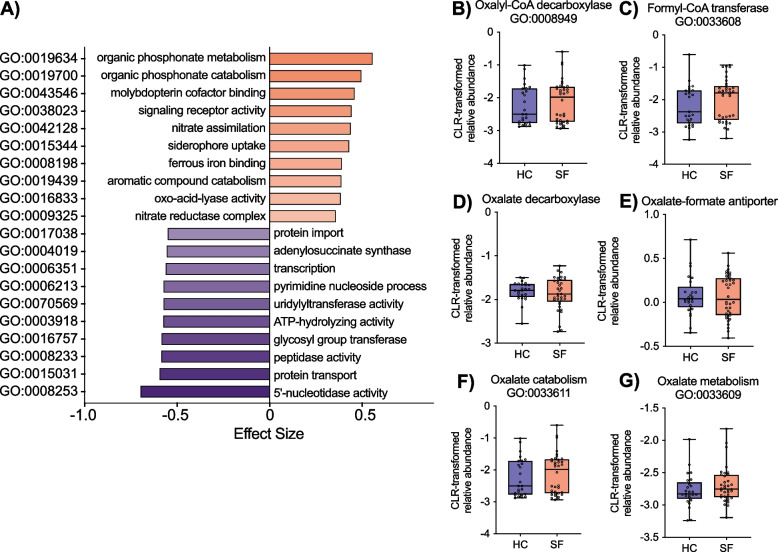
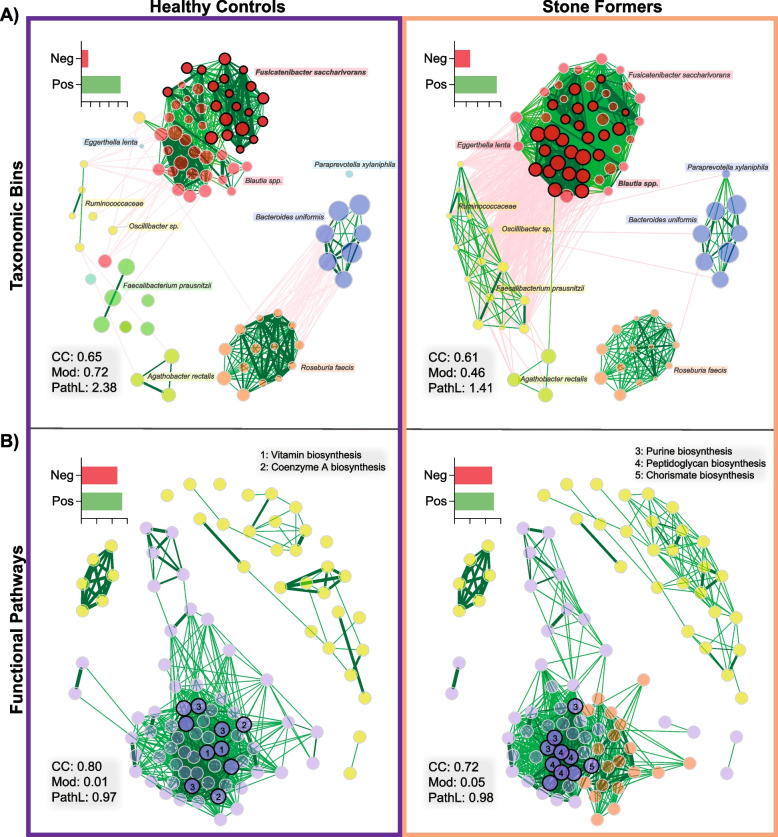
Results: Amplicon and shotgun metagenomic sequencing approaches were consistent in identifying multi-site microbiota disturbances in SF relative to HC. Biomarker taxa, reduced taxonomic and functional diversity, functional replacement of core bioenergetic pathways with virulence-associated gene markers, and community network collapse defined SF, but differences between cohorts did not extend to oxalate metabolism.

Conclusions: We conclude that multi-site microbiota alteration is a hallmark of SF, and KSD treatment should consider microbial functional restoration and the avoidance of aberrant modulators such as poor diet and antibiotics where applicable to prevent stone recurrence. Video Abstract.

Keywords: Gut microbiota; Kidney stones; Microbiota; Shotgun metagenomic sequencing; Urinary microbiota; Urology.


Conflict of interest statement

The authors declare that they have no competing interests.

Figures

Fig. 1
Fig. 1
Urinary, but not dietary oxalate levels differ between healthy controls and stone formers. A The approximate daily value of oxalic acid as measured through a diet history questionnaire was comparable between patient groups. HC (n = 14), SF (n = 64). B Urinary oxalate concentrations were determined with HPLC and normalized to creatinine levels. SF pre-operative urine had the highest oxalate concentrations (Kruskall-Wallis test with Dunn’s multiple comparisons). Data represent the median (line in box), IQR (box), and minimum/maximum (whiskers); HC (n = 29), SF (n = 83), SF-OR (n = 55)
Fig. 2
Fig. 2
Compositional analysis of urine and stone microbiota. A PCA was performed on CLR-transformed Aitchison distances of all urine and stone samples. Each coloured point represents a sample. Distance between samples on the plot represents differences in microbial community composition, with 17.6% of total variance being explained by the first two components shown. Strength and association for genera are depicted by the length and direction of the grey arrows, respectively. Points are coloured by sample type and ellipses represent the 95% confidence intervals of sample types. Samples significantly differed by type and time (envfit P value < 0.05). B Shannon’s Index of alpha diversity was compared between sample groups. OR urine samples from stone patients had the lowest diversity (Kruskall-Wallis test with Dunn’s multiple comparisons, * P < 0.05, ** P < 0.01, *** P < 0.001). Data represent the median (line in box), IQR (box), and minimum/maximum (whiskers). C SVs were significantly distinct between stone former pre-operative urine compared to healthy control urine, stone former OR urine, and stones (Benjamini–Hochberg corrected Wilcoxon test P < 0.05, ANCOM W value > 0.7 threshold, ALDEx2 GLM effect size >|0.5|). Data represent the median and IQR; HC (n = 25), SF (n = 83), SF-OR (n = 59), Stone (n = 34)
Fig. 3
Fig. 3
Stone-former gut microbiota differs from healthy controls. A PCA was performed on CLR-transformed Aitchison distances of metagenomic taxonomic bin assemblies from HC and SF fecal samples. Each coloured point represents a sample. Distance between samples on the plot represents differences in microbial community composition, with 18.2% of total variance being explained by the first two components shown. Points are coloured by sample type and ellipses represent the 95% confidence intervals of sample types. Samples significantly differed by cohort (envfit P value < 0.1). B Shannon’s Index of alpha diversity was significantly decreased in SF. C Gini coefficient of community inequality was significantly elevated in SF. Mann–Whitney tests, *P < 0.05, ***P < 0.001. Data represent the median, IQR, and minimum/maximum; HC (n = 25), SF (n = 36)
Fig. 4
Fig. 4
Phylogeny and differentially abundant gut microbiota taxa. A A maximum-likelihood phylogenetic tree of dereplicated genomes from the gut microbiota. The outermost grey bars represent the overall prevalence of the taxonomic bin. Orange and purple dots in the second layer denote taxonomic bins that were significantly more abundant in SF or HC, respectively (Benjamini–Hochberg corrected Wilcoxon test (P < 0.1) and effect size >|0.5|). Tree branches are coloured by phylum. B Average relative phylum abundance bar plot of HC and SF cohorts. Each vertical bar represents the average relative abundance within the cohort, coloured by phylum. C Effect sizes of taxa are coloured by cohort of enrichment and labelled where taxonomic information is available. Coloured species were significantly different by Benjamini–Hochberg corrected Wilcoxon test (P < 0.1) and effect size >|0.5|
Fig. 5
Fig. 5
SF gut microbiota differs functionally from HC, but not in direct oxalate handling. A Effect size of the ten most differentially abundant gene ontology (GO) terms per cohort are coloured by cohort of enrichment. All GO terms shown were significantly different by Benjamini–Hochberg corrected Wilcoxon test (P < 0.1). B–G The relative abundance of oxalate handling genes was not different between cohorts by Bonferroni corrected Mann–Whitney U test. Data represent the median, IQR, and minimum/maximum; HC (n = 25), SF (n = 35)
Fig. 6
Fig. 6
Co-occurrence networks demonstrate divergent community structures between HC and SF. Network inference was built upon 1000 bootstrap iterations of Pearson correlation coefficients from CLR-transformed taxonomic and functional pathway counts. A Nodes represent individual taxonomic bins, and clusters are labelled with corresponding species; the fifty nodes with the highest degree are displayed. B Nodes represent functional pathways; the eighty nodes with the highest degree are displayed. Nodes are coloured by clusters and sized by their CLR-transformed abundance, with nodes in bold representing hubs. Numbers within hubs correspond to the common functional pathways of interest. Edges with positive estimated interactions are coloured in green, and negative estimated interactions are coloured in red; percentage of edge positivity is displayed in the inset bar chart. CC = clustering coefficient, Mod = modularity, PathL = average path length

Similar articles

Cited by

References

    1. Pearle MS, Calhoun EA, Curhan GC. Urologic Diseases of America P: Urologic diseases in America project: urolithiasis. J Urol. 2005;173:848–857. doi: 10.1097/01.ju.0000152082.14384.d7. - DOI - PubMed
    1. Scales CD, Jr, Curtis LH, Norris RD, Springhart WP, Sur RL, Schulman KA, Preminger GM. Changing gender prevalence of stone disease. J Urol. 2007;177:979–982. doi: 10.1016/j.juro.2006.10.069. - DOI - PubMed
    1. Scales CD, Jr, Smith AC, Hanley JM, Saigal CS. Urologic Diseases in America P: Prevalence of kidney stones in the United States. Eur Urol. 2012;62:160–165. doi: 10.1016/j.eururo.2012.03.052. - DOI - PMC - PubMed
    1. Tasian GE, Ross ME, Song L, Sas DJ, Keren R, Denburg MR, Chu DI, Copelovitch L, Saigal CS, Furth SL. Annual Incidence of Nephrolithiasis among Children and Adults in South Carolina from 1997 to 2012. Clin J Am Soc Nephrol. 2016;11:488–496. doi: 10.2215/CJN.07610715. - DOI - PMC - PubMed
    1. Abufaraj M, Xu T, Cao C, Waldhoer T, Seitz C, D'Andrea D, Siyam A, Tarawneh R, Fajkovic H, Schernhammer E, et al. Prevalence and Trends in Kidney Stone Among Adults in the USA: Analyses of National Health and Nutrition Examination Survey 2007–2018 Data. Eur Urol Focus. 2021;7:1468–1475. doi: 10.1016/j.euf.2020.08.011. - DOI - PubMed

Publication types

LinkOut - more resources