. 2023 Nov 25;23(1):293.
doi: 10.1186/s12935-023-03129-9.

ALKBH5-mediated CHAC1 depletion promotes malignant progression and decreases cisplatin-induced oxidative stress in gastric cancer

Affiliations

ALKBH5-mediated CHAC1 depletion promotes malignant progression and decreases cisplatin-induced oxidative stress in gastric cancer

Chunting Chen et al. Cancer Cell Int. .

Abstract

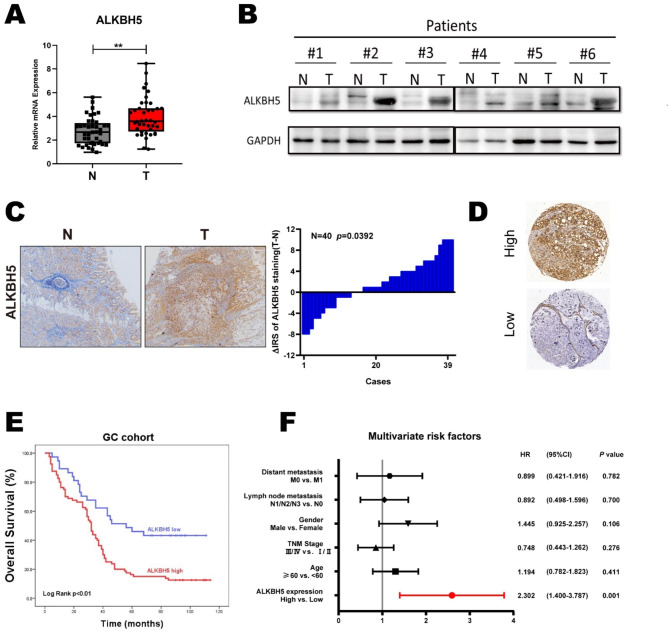
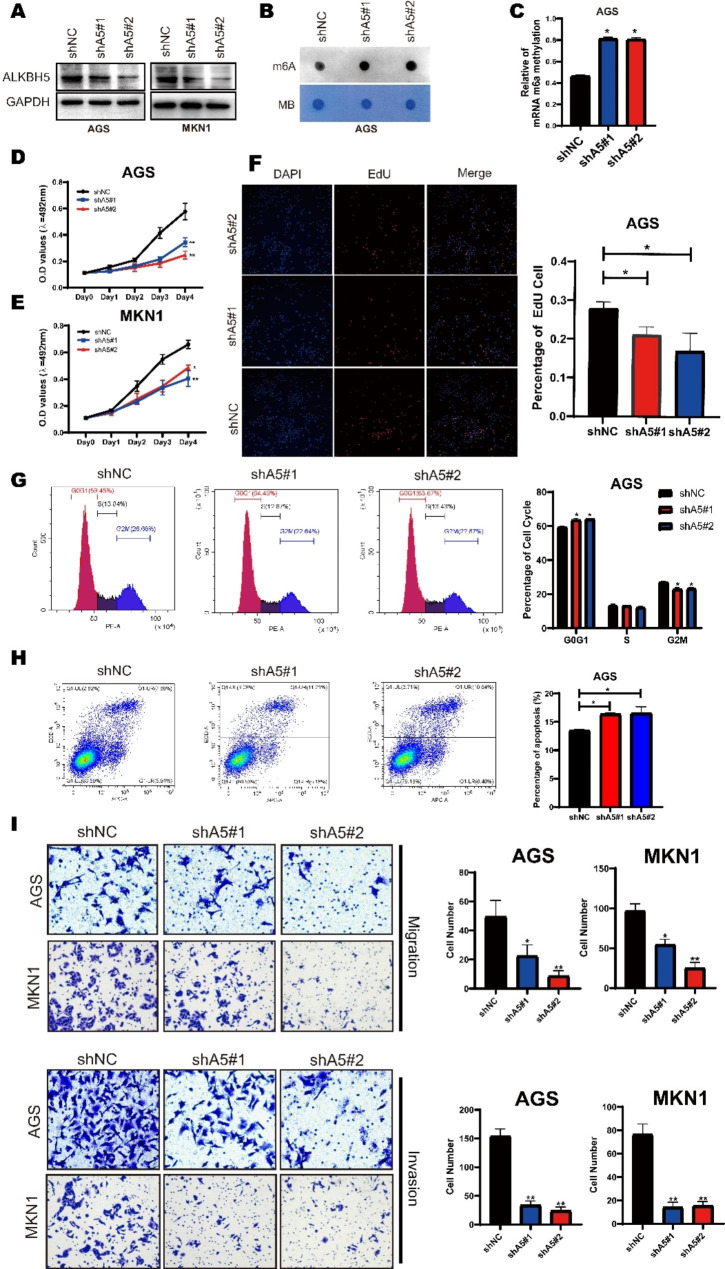
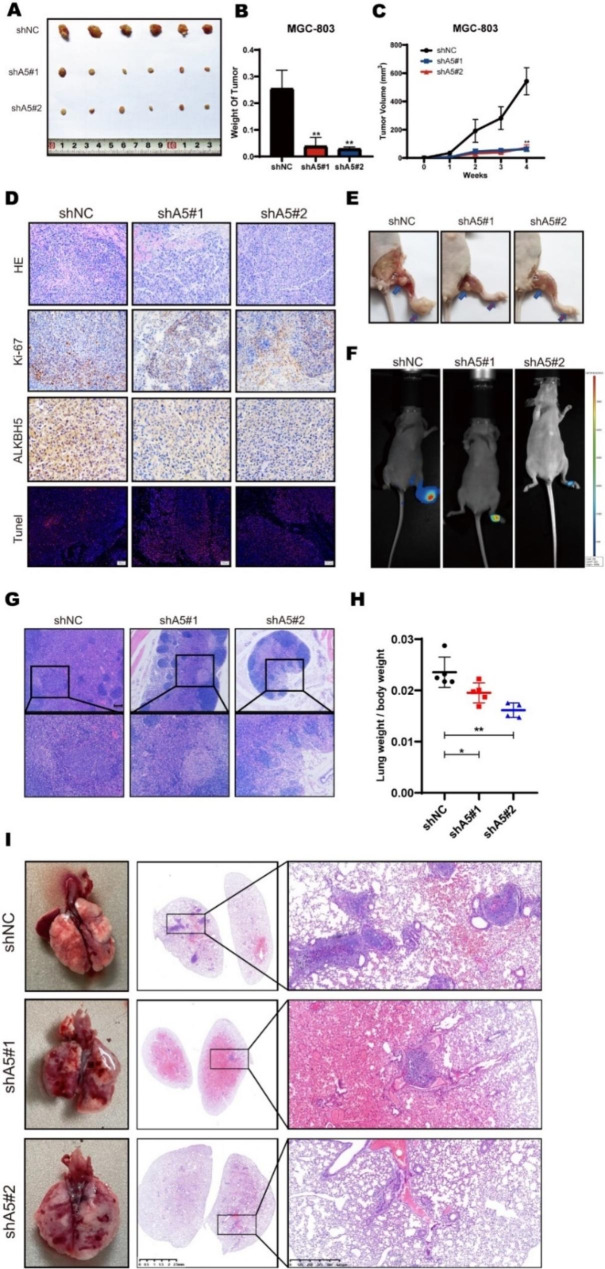
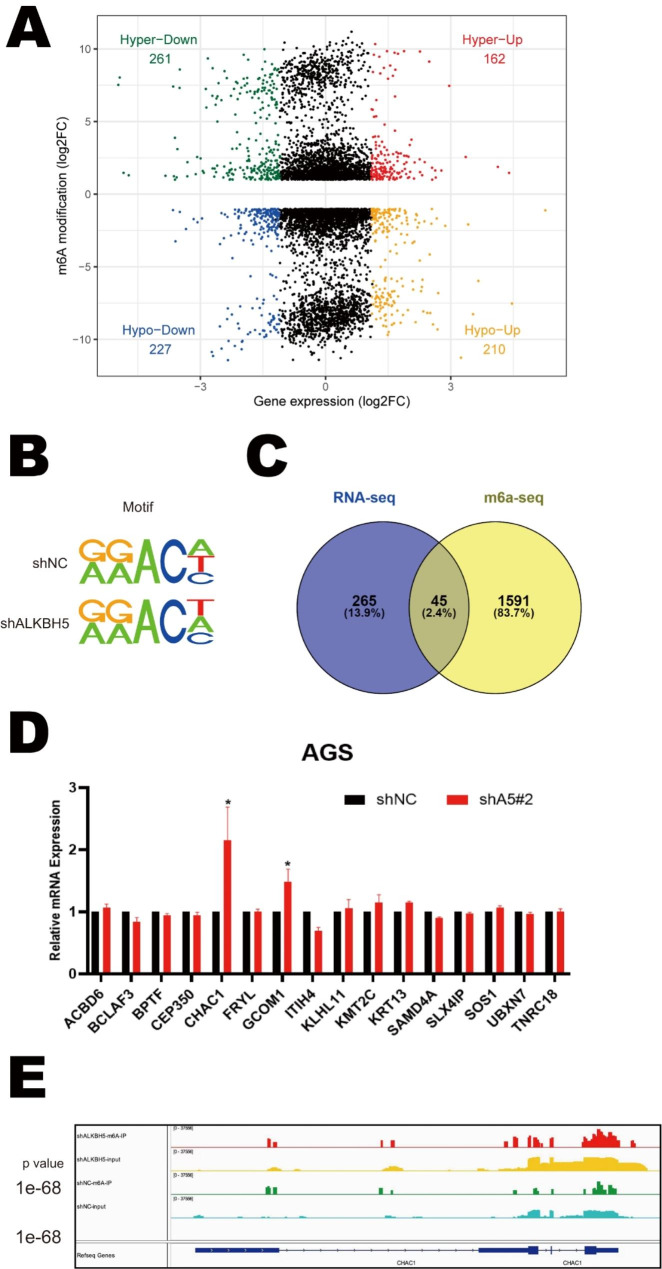
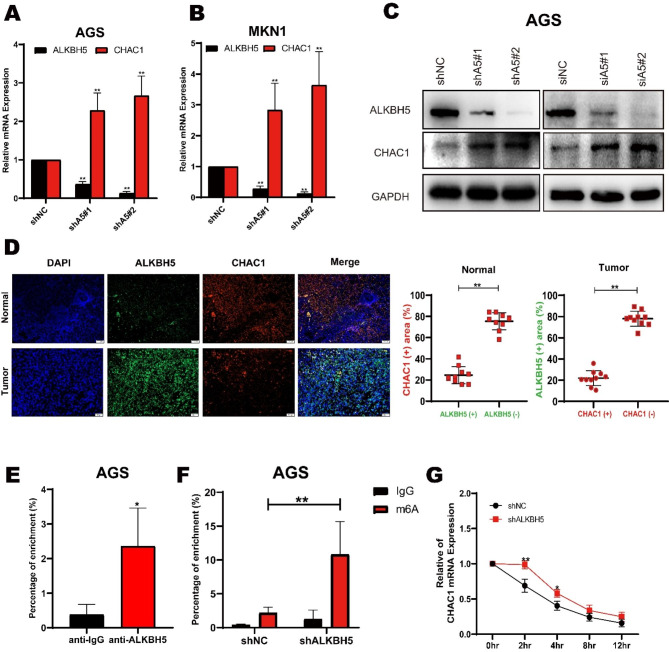
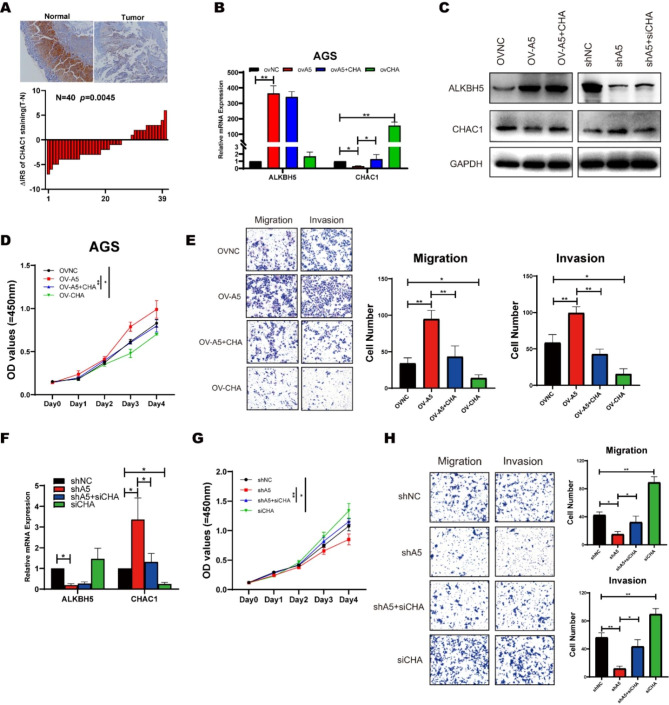
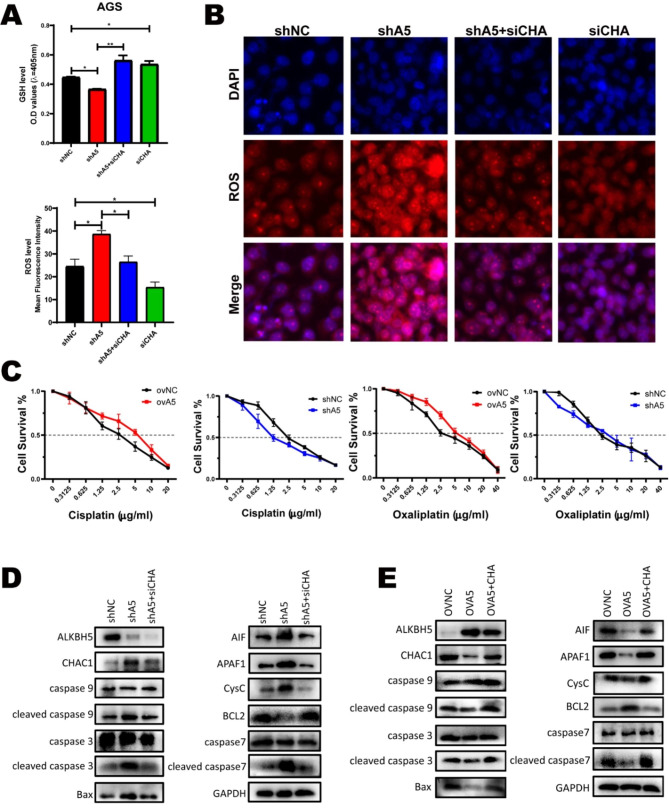
The m6a demethyltransferase ALKBH5 dynamically modulates gene expression and intracellular metabolic molecules by modifying RNA m6a in cancer cells. However, ALKBH5's function in gastric cancer (GC) has remained controversial. This study demonstrates that ALKBH5 is highly expressed in GC. Silencing ALKBH5 hampers proliferation, and metastatic potential, and induces cell death in GC cells. Through a comprehensive analysis of the transcriptome and m6A sequencing, alterations in certain ALKBH5 target genes, including CHAC1, were identified. ALKBH5's demethylation effect regulates CHAC1 RNA stability, leading to reduced CHAC1 expression. Moreover, CHAC1 modulates intracellular ROS levels, influencing the chemotherapy sensitivity of gastric cancer. In summary, our study unveils the pivotal role of the ALKBH5-CHAC1-ROS axis and highlights the significance of m6A methylation in gastric cancer.

Keywords: ALKBH5; Gastric cancer; M6a; Oxidative stress.


Conflict of interest statement

The authors declare no competing interests.

Figures

Fig. 1
Fig. 1
ALKBH5 is associated with poor prognosis in gastric cancer. (A) Expression levels of ALKBH5 in gastric cancer and paired normal gastric mucosal tissues were detected using qRT-PCR (n = 40). (B) ALKBH5 protein levels in GC tissues and paired normal gastric mucosal tissues were detected by western blotting (n = 6). (C) Representative IHC images were displayed with anti-ALKBH5 antibody (labeled bars were 200 μm) (left).Differential distribution of ALKBH5 immunoreactivity score (IRS) (ΔIRS = IRST-IRSN). (n = 40)(right). (D) Representative IHC images of tissue microarrays were displayed with anti-ALKBH5 antibody. (E) IRS scoring was performed using tissue microarrays (TMA) with anti-ALKBH5 antibody probes, and the mean value was taken as the cut-off value, followed by Kaplan-Meier OS analysis of ALKBH5 expression in gastric cancer patients (n = 117, p < 0.01, log-rank test). (F) Multivariate analysis was performed in the GC cohort. All bars correspond to 95% CIs. Data are expressed as mean ± SD. * p < 0.05, ** p < 0.01 and ∗∗∗ p < 0.001 (one-way ANOVA; t-test). All assays were repeated biologically 3 times
Fig. 2
Fig. 2
ALKBH5 affects gastric cancer cell progression in multiple ways. (A) Western blotting of ALKBH5 protein levels in MKN1 (right) and AGS (left) cells after ALKBH5 knockdown. (B) mRNA isolated from GC cells with knockdown of ALKBH5 was analyzed by spot hybridization with m6A antibody. MB (methylene blue) staining was used as a control. (C) Through EpiQuik M6A RNA Methylation Quantification Kit colorimetric method to detect the m6a level from the model. (D-E) MTT Cell Proliferation and Cytotoxicity Assay Kit for two ALKBH5 knockdown sequences and control in AGS and MKN1 cells. (F) ALKBH5 knockdown and control AGS cells were stained with azide 594 (red) to detect EdU and DAPI (blue) to stain cell nuclei. Fluorescence images were obtained and analyzed by fluorescence microscopy (left). Values are expressed as mean ± SD compared to the control group, n = 3 * p < 0.05 (right). (G) Cell cycle analysis using propidium iodide (PI) staining of ALKBH5 knockdown and control AGS cells. (left): Representative images. (right): Quantitative data. (H) ALKBH5 knockdown and apoptosis analysis using membrane coupling protein V/propidium iodide (PI) staining in control AGS cells. (left): Representative images. (right): Quantitative data. (I) Transwell cell migration (upper) analysis of ALKBH5 knockdown and control groups in AGS and MKN1 cells. Matrigel matrix gel invasion assay (bottom) of ALKBH5 knockdown and control groups in AGS and MKN1 cells. Left: Representative images. Right: quantitative data. Data are expressed as mean ± SD. * p < 0.05, ** p < 0.01 and ∗∗∗ p < 0.001 (one-way ANOVA; t-test). shA5-1, shALKBH5-1; sh A5-2, sh ALKBH5-2; shNC, negative control shRNA. all in vitro assays were repeated biologically 3 times
Fig. 3
Fig. 3
In vitro, ALKBH5 further stimulates the malignant progression of gastric cancer. (A) Subcutaneous implantation of ALKBH5 knockdown and control MGC-803 cells (n = 6) in GC mouse tumor. Two sequences were used in this experiment. (B) Comparison of tumor weight between GC mice implanted with ALKBH5 knockdown and control MGC-803 cells. (C) Comparison of tumor growth volume between GC mice implanted with ALKBH5 knockdown and control MGC-803 cells. (D) Sections of subcutaneous transplanted tumors from nude mice transfected with ALKBH5 knockdown were stained with HE (top), immunohistochemical staining (middle) (scale bar = 100 μm), and detected with antibodies against Ki67 and ALKBH5 (middle panel) Tunel Apoptosis Assay Kit (bottom panel). (E) Mice footpad implanted with ALKBH5 knockdown and control MGC-803 cells (n = 6) in GC mice (red arrow: mouse footpad tumor in situ; blue arrow: mouse popliteal metastatic lymph node swelling). (F) Mice with foot pad lymphatic metastasis model in vivo fluorescence imaging system. (G) Metastatic lymph nodes of nude mice transfected with ALKBH5 knockdown were sectioned and stained with HE (Upscale bar = 100 μm; Down: scale bar = 40 μm) for comparison of lymph node metastasis rate, and representative images were selected for each group. (H) Comparison of lung weights divided mice weights of GC mice implanted with ALKBH5 knockdown and control MGC-803 cells. (I) Representative images of lungs from GC mice with tail vein injection of ALKBH5 knockdown and control MGC-803 cells (n = 6; left). Lung sections of nude mice transfected with ALKBH5 knockdown were stained with HE (left panel: scale bar = 2.5 mm; right panel: scale bar = 625 μm) to compare the rate of bloodstream metastasis of gastric cancer, and representative images of lungs were selected for each group (right). Data are expressed as mean ± SD. * p < 0.05, ** p < 0.01 and ∗∗∗ p < 0.001 (one-way ANOVA; t-test). shA5-1, shALKBH5-1; sh A5-2, sh ALKBH5-2; shNC, negative control shRNA. all in vivo assays were repeated 3 times biologically
Fig. 4
Fig. 4
Exam the downstream targets of ALKBH5 in Gastric Cancer. (A) Extraction of MeRIP-seq data comparing the distribution of genes with differential expression and degree of m6a modification in AGS cells with those in the control group. (B) HOMER highest shared motifs with m 6 A-seq peaks in AGS cells with or without ALKBH5 knockdown. (C) In the RNA-seq dataset (m 6 A-seq input library) we selected 265 genes that showed more than 8-fold numerical differences. In shALKBH5 there are 5,180 unique m 6 A peaks for 1591 genes. The two were intersected and 45 genes were identified. (D) RT-qPCR was used to detect the expression of the 16 genes screened out in ALKBH5 knockdown versus control cells (Data are expressed as mean ± SD. * p < 0.05), and assays were repeated 3 times biologically. (E) MeRIP-seq data comparing the expression of the m 6 A-seq peak at the CHAC1 locus in ALKBH5 knockdown and control cells
Fig. 5
Fig. 5
ALKBH5 regulates the expression of CHAC1 in GC. (A) Expression of two ALKBH5 knockdown sequences in AGS cells versus control for CHAC1 by RT-qPCR. (B) Expression of two ALKBH5 knockdown sequences in MKN1 cells was detected by RT-qPCR with CHAC1 expression in the control group. (C) Western blot detection of overexpression (left), sh knockdown (middle), and si knockdown (right) of CHAC1 and GCOM1 in AGS cells. (D) Correlation between ALKBH5 and CHAC1 protein expression in GC specimens., representative IF images of n = 10 GC specimens. Scale bar, Normal: 100 μm; Tumor: 50 μm. Fluoroscopic areas were calculated by Imaging J in 5 randomly selected microscopic fields for each cancer and paracancer specimen. t test calculates the percentage of ALKBH5 positive areas compared to ALKBH5 negative areas in CHAC1 positive areas; the percentage of CHAC1 positive areas compared to CHAC1 negative areas in ALKBH5 positive areas. Lines show the mean and standard deviation. (E) RIP (RNA immunoprecipitation) analysis of ALKBH5 enrichment of CHAC1 mRNA in AGS cells. (F) MeRIP-qPCR analysis of CHAC1 mRNA in AGS cells with or without ALKBH5 knockdown at m6A levels. (G) qPCR of CHAC1 mRNA stability in AGS cells with or without ALKBH5 knockdown. Identical amounts of RNA from cells treated with 2 μg/ml actinomycin D for 0 to 12 h were collected and measured by qPCR
Fig. 6
Fig. 6
ALKBH5 regulates the expression of CHAC1 in gastric cancer, leading to modifications in proliferation migration and invasion. (A) Representative IHC images were displayed with anti-CHAC1 antibody (labeled bars were 200 μm) (upper).Differential distribution of ALKBH5 immunoreactivity score (IRS) (ΔIRS = IRST-IRSN). (n = 40, bottom). (B) Changes in mRNA levels of ALKBH5 and CHAC1 after simultaneous overexpression of ALKBH5 and CHAC1 in AGS cells were detected by RT-qPCR. (C) Changes in the protein levels of ALKBH5 and CHAC1 after simultaneous knockdown of ALKBH5 and CHAC1 in AGS cells (right); after simultaneous overexpression of ALKBH5 and CHAC1 (left) were detected by Western Blot. (D) Changes in cellular value-added function were detected after simultaneous overexpression of ALKBH5 and CHAC1 by applying a CCK8 reagent kit. (E) Application of Transwell and Matrigel to detect changes in cell migration and invasion functions in AGS cells that overexpress both ALKBH5 and CHAC1. (Left) Representative images; (right) Quantitative data. (F) Changes in mRNA levels of ALKBH5 and CHAC1 after simultaneous knockdown of ALKBH5 and CHAC1 in AGS cells were detected by RT-qPCR. (G) Changes in cellular value-added function were detected after simultaneous knockdown of ALKBH5 and CHAC1 by applying a CCK8 reagent kit in AGS cells. (H) Application of Transwell and Matrigel to detect changes in cell migration and invasion functions in AGS cells that knockdown both ALKBH5 and CHAC1. (Left) Representative images; (right) Quantitative data
Fig. 7
Fig. 7
CHAC1 regulates the progression of ALKBH5 in GC and resisting cisplatin-induced ROS. (A) The total glutathione reagent kit was used to detect changes in GSH levels after treatment with knockdown of ALKBH5 and CHAC1. The average fluorescence intensity of each group in Fig. 7B was calculated by Image J software. (B) After treatment with 5ug/ml cisplatin for 36 h, the ROS probe was combined with the knockdown treated cells and the changes in ROS content were observed under the fluorescence microscope. (C) Cell survival was observed in the overexpression, knockdown, and control groups at different cisplatin(left), Oxaliplatin(right) concentrations, using a cell counting kit (CCK8) in MGC-803 cell line. (D) Western Blot was applied to detect changes in protein levels of markers commonly found in the mitochondrial apoptotic pathway in AGS cells with knockdown of ALKBH5 and CHAC1. (E) Western Blot was applied to detect changes in protein levels of markers commonly found in the mitochondrial apoptotic pathway in AGS cells with overexpression of ALKBH5 and CHAC1

Similar articles

Cited by

References

    1. Bray F, et al. Global cancer statistics 2018: GLOBOCAN estimates of incidence and mortality worldwide for 36 cancers in 185 countries. CA Cancer J Clin. 2018;68(6):394–424. doi: 10.3322/caac.21492. - DOI - PubMed
    1. Smyth EC, et al. Gastric cancer. The Lancet. 2020;396(10251):635–48. doi: 10.1016/S0140-6736(20)31288-5. - DOI - PubMed
    1. Ishimoto T, et al. Activation of transforming growth factor Beta 1 signaling in gastric Cancer-associated fibroblasts increases their motility, via expression of rhomboid 5 homolog 2, and ability to Induce Invasiveness of Gastric Cancer cells. Gastroenterology. 2017;153(1):191–204e16. doi: 10.1053/j.gastro.2017.03.046. - DOI - PubMed
    1. Digklia A, Wagner AD. Advanced gastric cancer: current treatment landscape and future perspectives. World J Gastroenterol. 2016;22(8):2403–14. doi: 10.3748/wjg.v22.i8.2403. - DOI - PMC - PubMed
    1. Rugge M, et al. Gastritis staging in the endoscopic follow-up for the secondary prevention of gastric cancer: a 5-year prospective study of 1755 patients. Gut. 2019;68(1):11–7. doi: 10.1136/gutjnl-2017-314600. - DOI - PubMed

LinkOut - more resources