. 2023 Nov 25;22(1):205.
doi: 10.1186/s12944-023-01966-1.

Non-alcoholic fatty liver disease risk prediction model and health management strategies for older Chinese adults: a cross-sectional study

Affiliations

Non-alcoholic fatty liver disease risk prediction model and health management strategies for older Chinese adults: a cross-sectional study

Hong Pan et al. Lipids Health Dis. .

Abstract

Background: Non-alcoholic fatty liver disease (NAFLD) is a common chronic liver condition that affects a quarter of the global adult population. To date, only a few NAFLD risk prediction models have been developed for Chinese older adults aged ≥ 60 years. This study presented the development of a risk prediction model for NAFLD in Chinese individuals aged ≥ 60 years and proposed personalised health interventions based on key risk factors to reduce NAFLD incidence among the population.

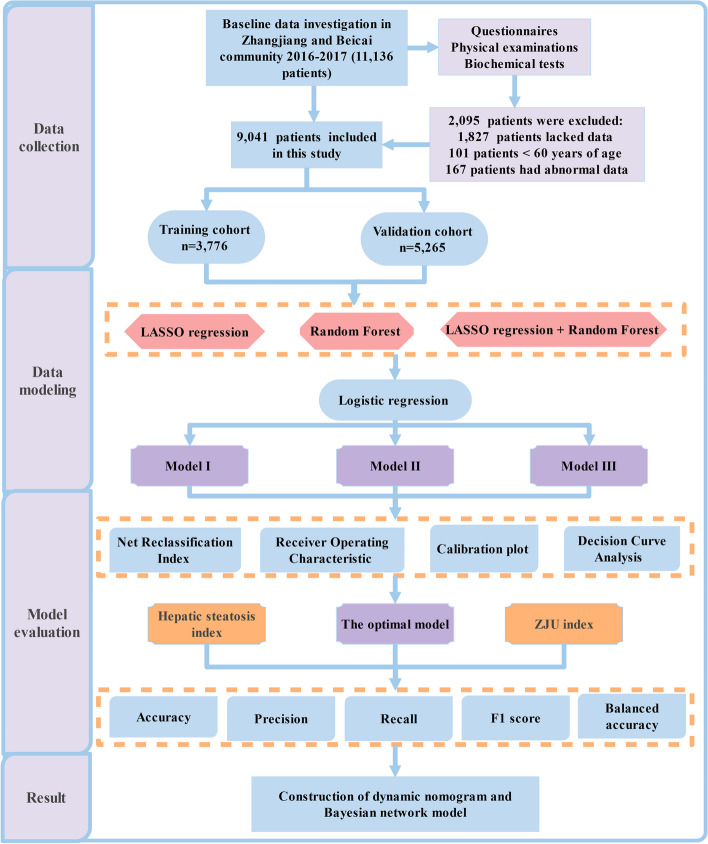
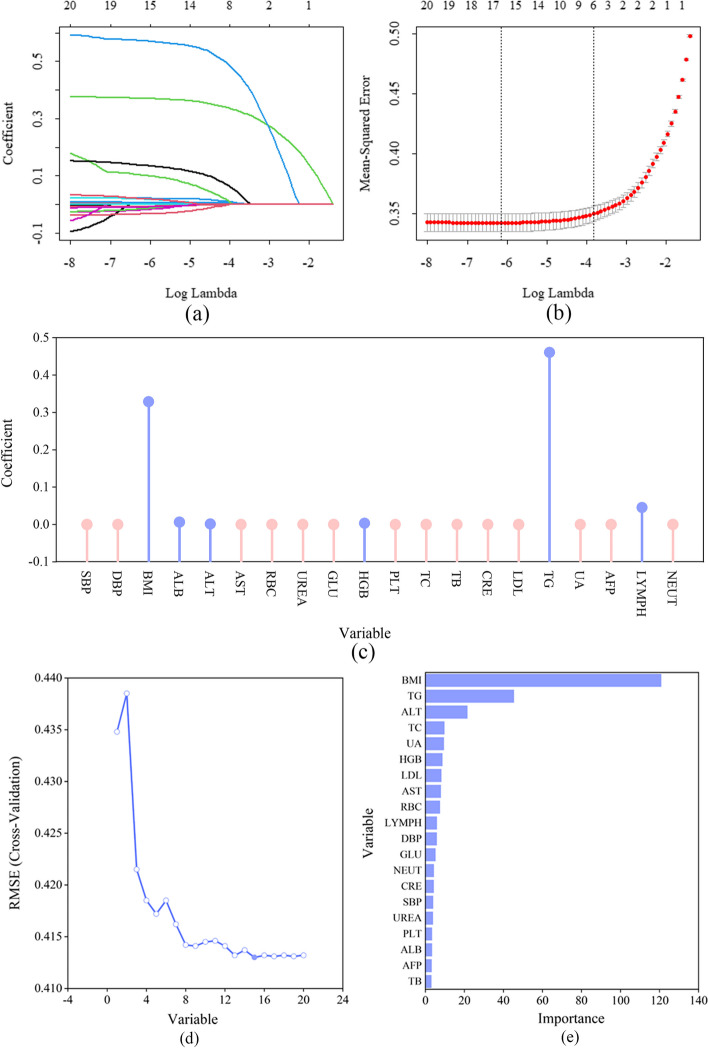
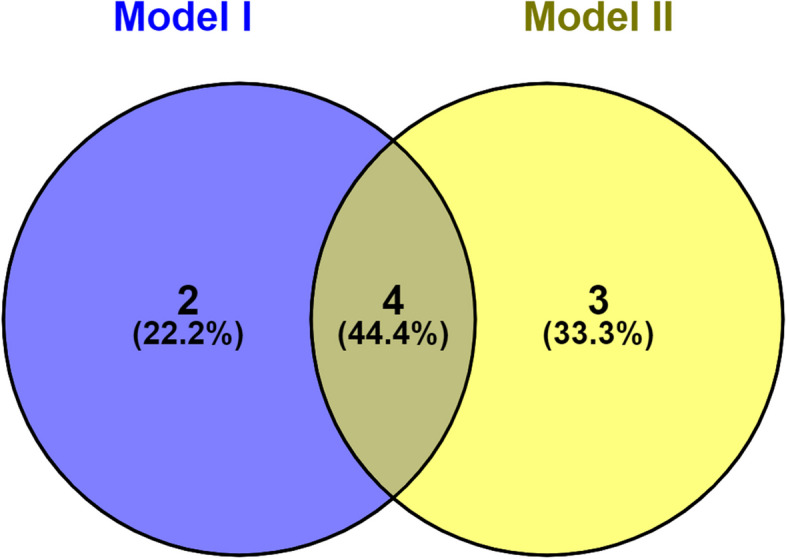
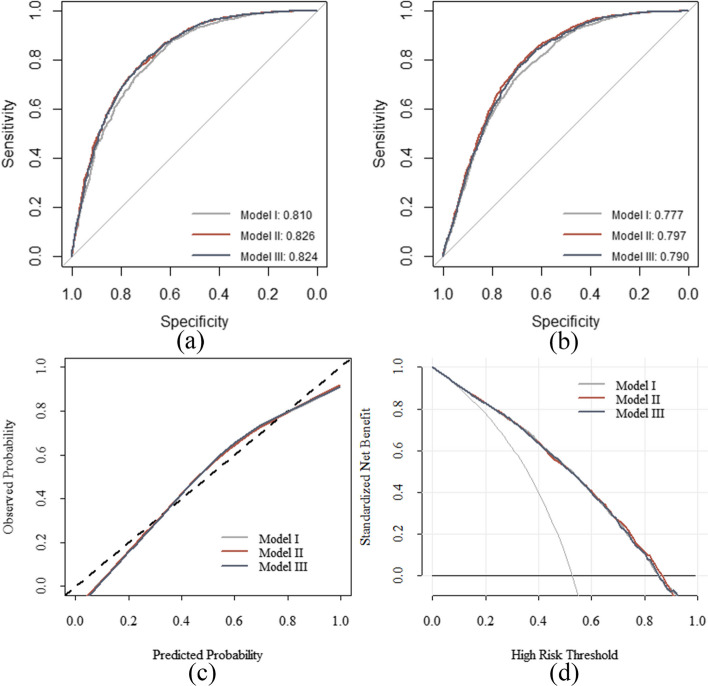
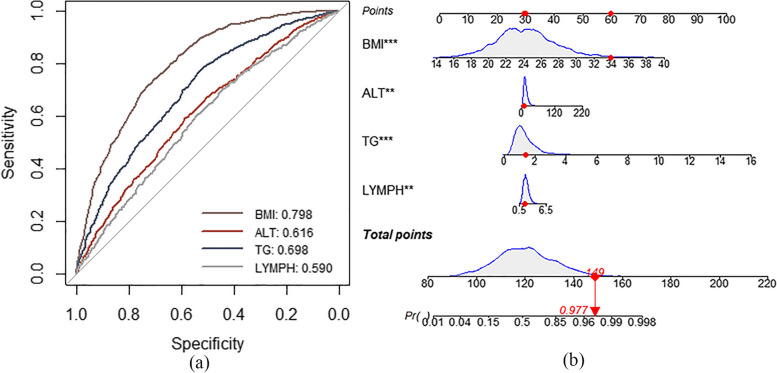
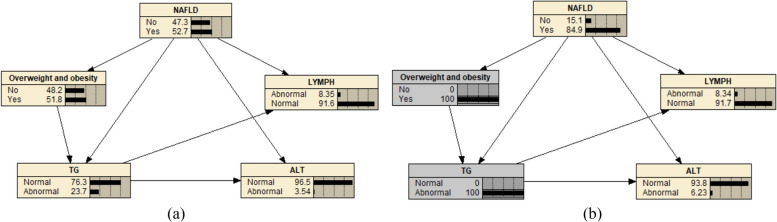
Methods: A cross-sectional survey was carried out among 9,041 community residents in Shanghai. Three NAFLD risk prediction models (I, II, and III) were constructed using multivariate logistic regression analysis based on the least absolute shrinkage and selection operator regression analysis, and random forest model to select individual characteristics, respectively. To determine the optimal model, the three models' discrimination, calibration, clinical application, and prediction capability were evaluated using the receiver operating characteristic (ROC) curve, calibration plot, decision curve analysis, and net reclassification index (NRI), respectively. To evaluate the optimal model's effectiveness, the previously published NAFLD risk prediction models (Hepatic steatosis index [HSI] and ZJU index) were evaluated using the following five indicators: accuracy, precision, recall, F1-score, and balanced accuracy. A dynamic nomogram was constructed for the optimal model, and a Bayesian network model for predicting NAFLD risk in older adults was visually displayed using Netica software.

Results: The area under the ROC curve of Models I, II, and III in the training dataset was 0.810, 0.826, and 0.825, respectively, and that of the testing data was 0.777, 0.797, and 0.790, respectively. No significant difference was found in the accuracy or NRI between the models; therefore, Model III with the fewest variables was determined as the optimal model. Compared with the HSI and ZJU index, Model III had the highest accuracy (0.716), precision (0.808), recall (0.605), F1 score (0.692), and balanced accuracy (0.723). The risk threshold for Model III was 20%-80%. Model III included body mass index, alanine aminotransferase level, triglyceride level, and lymphocyte count.

Conclusions: A dynamic nomogram and Bayesian network model were developed to identify NAFLD risk in older Chinese adults, providing personalized health management strategies and reducing NAFLD incidence.

Keywords: Bayesian network; Chinese older adults; Health management strategies; Nomogram; Non-alcoholic fatty liver disease.


Conflict of interest statement

The authors declare no competing interests.

Figures

Fig. 1
Fig. 1
Study flowchart. LASSO, least absolute shrinkage and selection operator
Fig. 2
Fig. 2
Screening of characteristic variables. a Six variables with non-zero coefficients were selected based on the optimal value of the parameter lambda. b After validating the optimal lambda value, the relationship between partial likelihood deviance and log (lambda) was plotted. The dashed vertical line represents the 1 − SE standard. c The orange solid point indicates that the coefficient of the variable is zero; the blue solid point indicates that the coefficient of the characteristic variable is not zero. d Based on the feature recursive elimination method, the RF model was used for feature extraction. Overall, 15 important variables were retained. e Ranking of feature importance of RF after tenfold cross-validation. RF, random forest, BMI, body mass index; TG, triglyceride level; ALT, alanine transaminase level; TC, total cholesterol; UA, uric acid level; HGB, haemoglobin; LDL, low-density lipoprotein level; AST, aspartate aminotransferase level; RBC, red blood cell count; LYMPH, lymphocyte count; DBP, diastolic blood pressure; GLU,; NEUT, neutrophil count; CRE, creatinine level; SBP, systolic blood pressure; PLT, platelet count; ALB, albumin level; AFP, alpha-fetoprotein level; TB, total bilirubin
Fig. 3
Fig. 3
Screening of variables in Model III. Selection of the intersection of the variables in Models I and II. These four intersecting variables were used to construct Model III
Fig. 4
Fig. 4
Evaluation of three models. Analyses of the ROC curves of the three non-alcoholic fatty liver disease prediction models for the training (a) and validation datasets (b) are shown. The x and y axes represent specificity and sensitivity, respectively. c Calibration plots of the risk prediction models from the training dataset. The diagonal dashed line denotes the perfect prediction of an ideal model, whereas the solid line denotes the model’s performance. (d) Decision curve analysis for the risk prediction models. The black solid line denotes the net benefit when all participants were negative and were not treated, whereas the grey solid line denotes the net benefit when all participants were positive and received treatment. The further the decision curve is from the black and grey solid lines, the more useful the risk prediction model is in clinical practice. ROC, receiver operating characteristic
Fig. 5
Fig. 5
The receiver operating characteristic curves for each variable in Model III and proposed dynamic nomogram. a The ROC curves for each variable in Model III are shown for the training dataset. The x-axis represents the false positive rate predicted using the model, and the y-axis represents the true positive rate predicted using the model. b A dynamic nomogram was created based on Model III to predict an individual’s risk of developing NAFLD. Based on a patient’s lymphocyte count (1.83 × 109/L), alanine transaminase level (8.9 U/L), triglyceride level (1.39 mmol/L), and body mass index (33.9 kg/m2), the predicted probability of the development of NAFLD was 0.977, indicating that this patient has a 97.7% chance of having NAFLD. BMI, body mass index; ALT, alanine transaminase level; TG, triglyceride level; LYMPH, lymphocyte count; NAFLD, non-alcoholic fatty liver disease; ROC, receiver operating characteristic
Fig. 6
Fig. 6
Bayesian network model for predicting the risk of NAFLD in older adults. a A Bayesian network model was constructed to predict the risk of NAFLD in older adults based on the four variables of Model III. b When a 65-year-old individual is overweight and has abnormal TG indicators, the risk of having NAFLD is 84.9%.NAFLD, non-alcoholic fatty liver disease; TG, triglyceride; LYMPH, lymphocyte count; ALT, alanine transaminase level

Similar articles

Cited by

References

    1. Cotter TG, Rinella M. Nonalcoholic Fatty Liver Disease 2020: The State of the Disease. Gastroenterology. 2020;158:1851–1864. - PubMed
    1. Huang DQ, El-Serag HB, Loomba R. Global epidemiology of NAFLD-related HCC: trends, predictions, risk factors and prevention. Nat Rev Gastroenterol Hepatol. 2021;18:223–238. - PMC - PubMed
    1. Makri E, Goulas A, Polyzos SA. Epidemiology, pathogenesis, diagnosis and emerging treatment of nonalcoholic fatty liver disease. Arch Med Res. 2021;52:25–37. - PubMed
    1. Riazi K, Azhari H, Charette JH, Underwood FE, King JA, Afshar EE, Swain MG, Congly SE, Kaplan GG, Shaheen AA. The prevalence and incidence of NAFLD worldwide: a systematic review and meta-analysis. Lancet Gastroenterol Hepatol. 2022;7:851–861. - PubMed
    1. Li J, Zou B, Yeo YH, Feng Y, Xie X, Lee DH, Fujii H, Wu Y, Kam LY, Ji F, et al. Prevalence, incidence, and outcome of non-alcoholic fatty liver disease in Asia, 1999–2019: a systematic review and meta-analysis. Lancet Gastroenterol Hepatol. 2019;4:389–398. - PubMed