. 2023 Nov 25;14(1):7728.
doi: 10.1038/s41467-023-43553-z.

Associations of myeloid cells with cellular and humoral responses following vaccinations in patients with neuroimmunological diseases

Affiliations

Associations of myeloid cells with cellular and humoral responses following vaccinations in patients with neuroimmunological diseases

Meng Wang et al. Nat Commun. .

Abstract

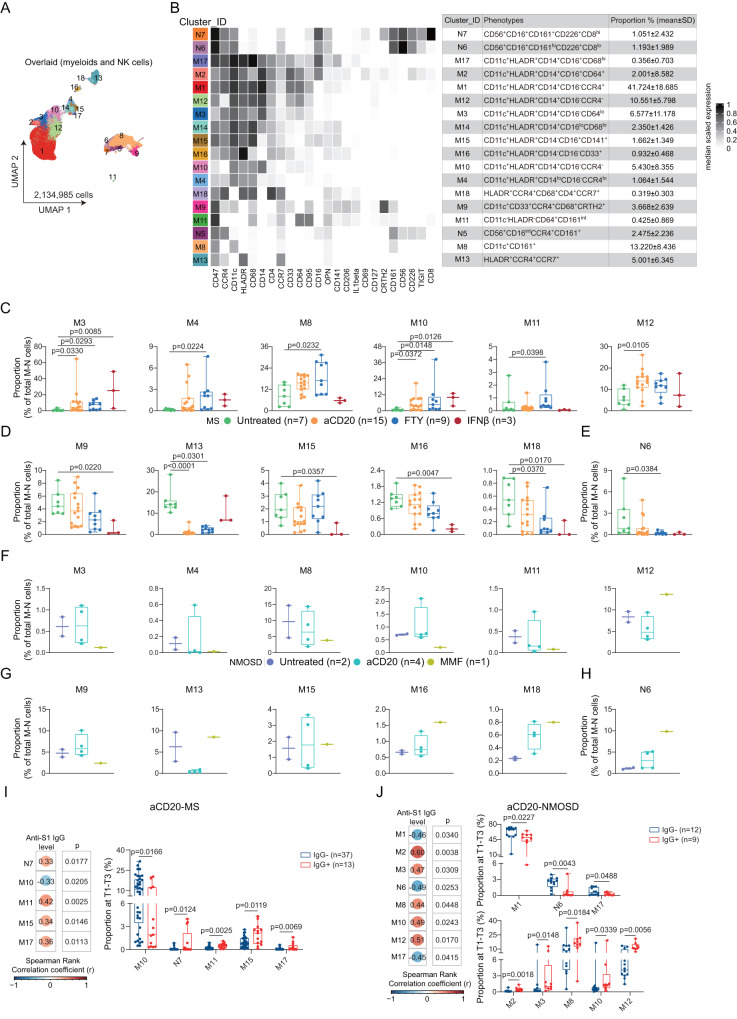
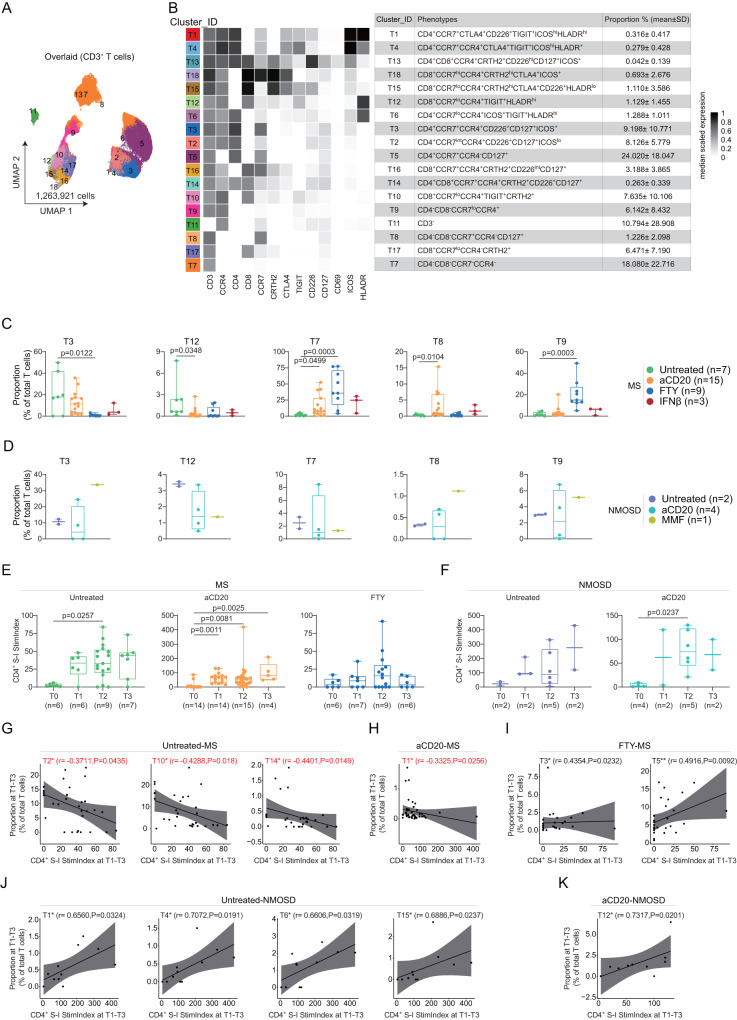
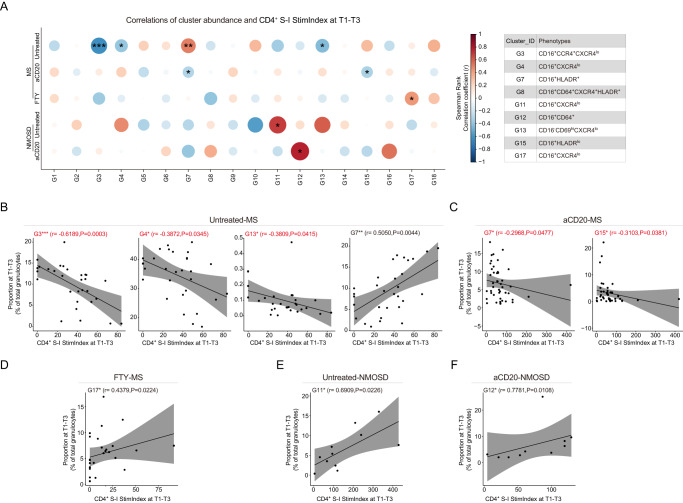
Disease-modifying therapies (DMTs) are widely used in neuroimmunological diseases such as multiple sclerosis (MS) and neuromyelitis optica spectrum disorder (NMOSD). Although these treatments are known to predispose patients to infections and affect their responses to vaccination, little is known about the impact of DMTs on the myeloid cell compartment. In this study, we use mass cytometry to examine DMT-associated changes in the innate immune system in untreated and treated patients with MS (n = 39) or NMOSD (n = 23). We also investigated the association between changes in myeloid cell phenotypes and longitudinal responsiveness to homologous primary, secondary, and tertiary SARS-CoV-2 mRNA vaccinations. Multiple DMT-associated myeloid cell clusters, in particular CD64+HLADRlow granulocytes, showed significant correlations with B and T cell responses induced by vaccination. Our findings suggest the potential role of myeloid cells in cellular and humoral responses following vaccination in DMT-treated patients with neuroimmunological diseases.


Conflict of interest statement

F.P. received research support for this study from F. Hoffmann-La Roche Ltd., Alexion Pharma Germany GmbH, and Horizon Therapeutics Ireland DAC. The remaining authors declare no competing interests.

Figures

Fig. 1
Fig. 1. Study design and immune cell characterization at the baseline (T0 prior to vaccination) using CyTOF (antibody panel A).
A Schematic overview of longitudinal study design, vaccine administration scheme and sample collection in relation to vaccinations across four time points for MS and NMOSD groups. Cohort information is shown in the bottom box. B UMAP projection, coloring indicates 1-18 clusters. Phenotypic heatmap of cluster identities depicting the median expression levels of selected markers per cluster. Heat colors of expression levels have been scaled for each marker individually (to the 1st and 5th quintiles) (black, high expression; white, no expression). C Proportion of each cluster (except granulocyte clusters) from each sample in MS groups at T0. D Box plots of the ten differentially abundant clusters (mean ± SD) from untreated-MS (n = 7), aCD20-MS (n = 15), FTY-MS (n = 9), IFNβ-MS (n = 3) at T0. Each dot represents the value of each sample. Boxes extend from the 25th to 75th percentiles. Whisker plots show the min (smallest) and max (largest) values. The line in the box denotes the median. Kruskal-Wallis and Dunn’s multiple comparison test. (E) Proportion of each cluster (except granulocyte clusters) from each sample in NMOSD groups at T0. (F) Box plots of the ten clusters as in D (mean ± SD) from untreated-NMOSD (n = 2), aCD20-NMOSD (n = 4), MMF-NMOSD (n = 1) at T0.
Fig. 2
Fig. 2. Contribution of immune cell sub-populations to aCD20-mediated differences in cell composition at different timepoints depicted by principal components analysis (PCA).
AH PCA for the 18 identified immune clusters in untreated and aCD20-treated MS A, C, E & G and NMOSD patients B, D, F & H at T0 A, B, T1 C, D, T2 E, F and T3 G, H. Each point represents one sample’s scores on the first 2 dimensions (Dim1 and Dim2). Each vector (arrow) shows the loadings of each cell cluster on the first 2 principal components. Gray scale indicates the contribution value of variables to Dim1 and Dim2. The red dashed line on the graph indicates the expected average contribution. The graph shows top variables (with a contribution larger than average) contributing to Dim1.
Fig. 3
Fig. 3. Association of granulocyte sub-population with anti-S1 IgG antibody production at T1-T3 in MS and NMOSD groups.
A UMAP plots of granulocytes. B Phenotypic heatmap depicting the median marker expression levels of each granulocyte clusters. C Proportion of the three differentially abundant clusters (mean ± SD, Kruskal-Wallis and Dunn’s multiple comparison test), compared between Untreated-MS (n = 7), aCD20-MS (n = 15), FTY-MS (n = 9), IFNβ-MS (n = 3) at T0. D Proportion of the three clusters as in C (mean ± SD) between Untreated-NMOSD (n = 2), aCD20-NMOSD (n = 4), MMF-NMOSD (n = 1) at T0. E PCA for all 18 granulocyte clusters and IgG level in MS groups. Each point represents one sample’s scores ( = one patient) on the first 2 dimensions (Dim1 and Dim2). Each arrow shows the loadings on the first 2 principal components. The graph shows top variables (with a contribution larger than average) contributing to Dim1. F Heatmap of the Spearman correlation coefficients between the proportion of clusters and antibody levels in aCD20-MS group (Nonparametric Spearman correlation test (r), two-sided). Box plots (right panel) showing correlated cluster proportion compared between IgG- (n = 37) and IgG+ (n = 13) groups in aCD20-MS group (Kruskal-Wallis and Dunn’s multiple comparison test). G Scatter plots showing correlation between the proportion of clusters and antibody levels in Untreated-NMOSD groups (Nonparametric Spearman correlation test (r), two-sided). H PCA for the 18 granulocyte clusters and IgG level in NMOSD groups (as in E). The graph shows top variables (with a contribution larger than average) contributing to Dim1. I Heatmap of the correlation between the proportion of clusters and antibody levels in aCD20-NMOSD group (as in F, Nonparametric Spearman correlation test (r), two-sided). Box plots showing correlated cluster proportion compared between IgG- (n = 12) and IgG+ (n = 9) groups in aCD20-MS group (Kruskal-Wallis and Dunn’s multiple comparison test). Each dot represents the value of each sample. For all Box plots, boxes extend from the 25th to 75th percentiles. Whisker plots show the min (smallest) and max (largest) values. The line in the box denotes the median. The n numbers (n) are defined as biologically independent samples.
Fig. 4
Fig. 4. Association of myeloid and NK cell sub-population with anti-S1 IgG antibody production at T1-T3 in MS and NMOSD groups.
A UMAP plots colored by cluster ID for 1–18 clusters of MNK cell determined using the FlowSOM algorithm. B Phenotypic heatmap depicting the median expression levels of selected markers per MNK cell cluster as defined in the table. CE Proportion of the twelve differentially abundant clusters (mean ± SD) between Untreated-MS (n = 7), aCD20-MS (n = 15), FTY-MS (n = 9), IFNβ-MS (n = 3) at T0. Each dot represents the value of each sample. Boxes extend from the 25th to 75th percentiles. Whisker plots show the min (smallest) and max (largest) values. The line in the box denotes the median. Kruskal-Wallis and Dunn’s multiple comparison test. FH Proportion of the twelve clusters as in CE (mean ± SD) between Untreated-NMOSD (n = 2), aCD20-NMOSD (n = 4), MMF-NMOSD (n = 1) at T0. I, J Heatmap of the Spearman correlation coefficients between the proportion of MNK cell clusters and antibody levels at T1-T3 in aCD20-MS group I and aCD20-NMOSD group J. Nonparametric Spearman correlation test (r), two-sided. Box plots showing the proportion of correlated clusters compared between IgG- and IgG+ groups at T1-T3 in aCD20-MS group I (IgG-, n = 37; IgG+, n = 13) and aCD20-NMOSD group J (IgG-, n = 12; IgG+, n = 9). Each dot represents the value of each sample. Boxes extend from the 25th to 75th percentiles. Whisker plots show the min (smallest) and max (largest) values. The line in the box denotes the median. Kruskal-Wallis and Dunn’s multiple comparison test. All n numbers are defined as biologically independent samples.
Fig. 5
Fig. 5. Changes in CD3+ T cell composition and the correlation between S-I-specific CD4+ T cell reactivity and defined sub-populations at T1-T3 in MS and NMOSD patients.
A UMAP plots colored by cluster ID for 1–18 clusters of T cell determined using the FlowSOM algorithm. B Phenotypic heatmap depicting the median expression levels of selected markers per T cell cluster as defined in the table. C Proportion of the five differentially abundant clusters (mean ± SD) between Untreated-MS (n = 7), aCD20-MS (n = 15), FTY-MS (n = 9), IFNβ-MS (n = 3) at T0. Each dot represents the value of each sample. Boxes extend from the 25th to 75th percentiles. Whisker plots show the min (smallest) and max (largest) values. The line in the box denotes the median. Kruskal-Wallis and Dunn’s multiple comparison test. D Proportion of the five clusters as in C (mean ± SD) between Untreated-NMOSD (n = 2), aCD20-NMOSD (n = 4), MMF-NMOSD (n = 1) at T0. E, F The CD4+ T cell reactivity between four timepoints (T0-T3) in different MS groups E (Untreated-MS group, n = 6, 6, 9 and 7, sequentially; aCD20-MS group, n = 14, 14, 15 and 4, sequentially; FTY-MS group, n = 6, 7, 9 and 6, sequentially) and NMOSD groups F (Untreated-NMOSD group, n = 2, 2, 5 and 2, sequentially; aCD20-NMOSD group, n = 4, 2, 5 and 2, sequentially). Each dot represents the value of each sample. Boxes extend from the 25th to 75th percentiles. Whisker plots show the min (smallest) and max (largest) values. The line in the box denotes the median. Kruskal-Wallis and Dunn’s multiple comparison test. GK Scatter plots showing correlation between the proportion of T cell cluster and CD4+ S-I Stim.Index at T1-T3 in Untreated-MS group G, aCD20-MS group H, FTY-MS group I, Untreated-NMOSD group J, and aCD20-NMOSD group K. The red text denotes the negative correlation. Nonparametric Spearman correlation test (r), two-sided. Black lines and gray shadows represent the best-fitted smooth line and 95% confidence interval.
Fig. 6
Fig. 6. Association of granulocyte sub-populations with S-I-specific CD4+ T cell responses followed primary and booster vaccination (at T1-T3) in MS and NMOSD groups.
A Heatmap of the Spearman correlation coefficients between granulocyte cluster proportion and CD4+ S-I Stim.Index at T1-T3 in MS and NMOSD groups. Nonparametric Spearman correlation test (r), two-sided (*p < 0.05, **p < 0.01, ***p < 0.001, ****p < 0.0001; the exact p-values are shown in BF. Correlated clusters were defined in the table. BF Scatter plots showing correlation between the proportion of granulocyte cluster and CD4+ S-I Stim.Index at T1-T3 in Untreated-MS group B, aCD20-MS group C, FTY-MS group D, Untreated-NMOSD group E, and aCD20-NMOSD group F. The red text represents the negative correlation. Nonparametric Spearman correlation test (r), two-sided. Black lines and gray shadows represent the best-fitted smooth line and 95% confidence interval.
Fig. 7
Fig. 7. Association of myeloid and NK cell sub-populations with S-I-specific CD4+ T cell responses followed primary and booster vaccination (at T1-T3) in MS and NMOSD groups.
A Heatmap of the Spearman correlation coefficients between MNK cell cluster proportion and CD4+ S-I Stim.Index at T1-T3 in MS and NMOSD groups. Nonparametric Spearman correlation test (r), two-sided (*p < 0.05, **p < 0.01, ***p < 0.001, ****p < 0.0001; the exact p-values are shown in BE). Correlated clusters were defined in the table. BE Scatter plots showing correlation between the proportion of MNK cell cluster and CD4+ S-I Stim.Index at T1-T3 in Untreated-MS group B, aCD20-MS group C, FTY-MS group D, and Untreated-NMOSD group E. The red text represents the negative correlation. Nonparametric Spearman correlation test (r), two-sided. Black lines and gray shadows represent the best-fitted smooth line and 95% confidence interval.

References

    1. Lucchinetti CF, et al. The pathology of an autoimmune astrocytopathy: lessons learned from neuromyelitis optica. Brain Pathol. 2014;24:83–97. doi: 10.1111/bpa.12099. - DOI - PMC - PubMed
    1. Wingerchuk DM, et al. International consensus diagnostic criteria for neuromyelitis optica spectrum disorders. Neurology. 2015;85:177–189. doi: 10.1212/WNL.0000000000001729. - DOI - PMC - PubMed
    1. Jurynczyk M, et al. Clinical presentation and prognosis in MOG-antibody disease: a UK study. Brain. 2017;140:3128–3138. doi: 10.1093/brain/awx276. - DOI - PubMed
    1. Hoshino Y, et al. Dysregulated B cell differentiation towards antibody-secreting cells in neuromyelitis optica spectrum disorder. J. Neuroinflammation. 2022;19:6. doi: 10.1186/s12974-021-02375-w. - DOI - PMC - PubMed
    1. Gerdes LA, et al. Immune signatures of prodromal multiple sclerosis in monozygotic twins. Proc. Natl Acad. Sci. USA. 2020;117:21546–21556. doi: 10.1073/pnas.2003339117. - DOI - PMC - PubMed

Publication types

Substances