. 2023 Nov 25;14(1):7732.
doi: 10.1038/s41467-023-43605-4.

Modulation of insulin secretion by RBFOX2-mediated alternative splicing

Affiliations

Modulation of insulin secretion by RBFOX2-mediated alternative splicing

Nicole D Moss et al. Nat Commun. .

Abstract

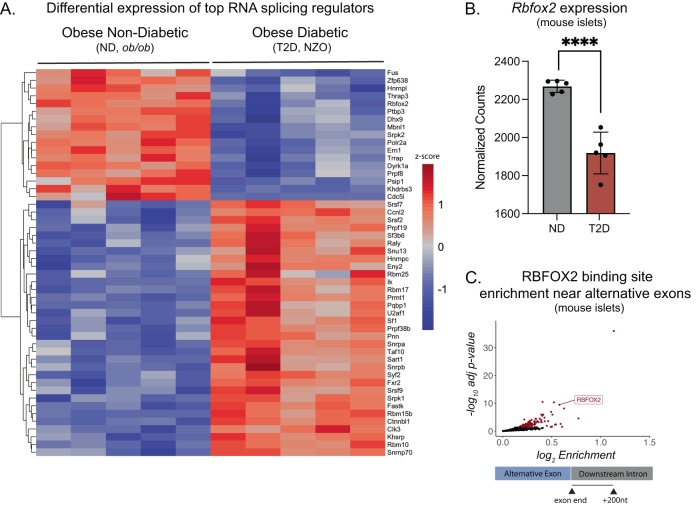
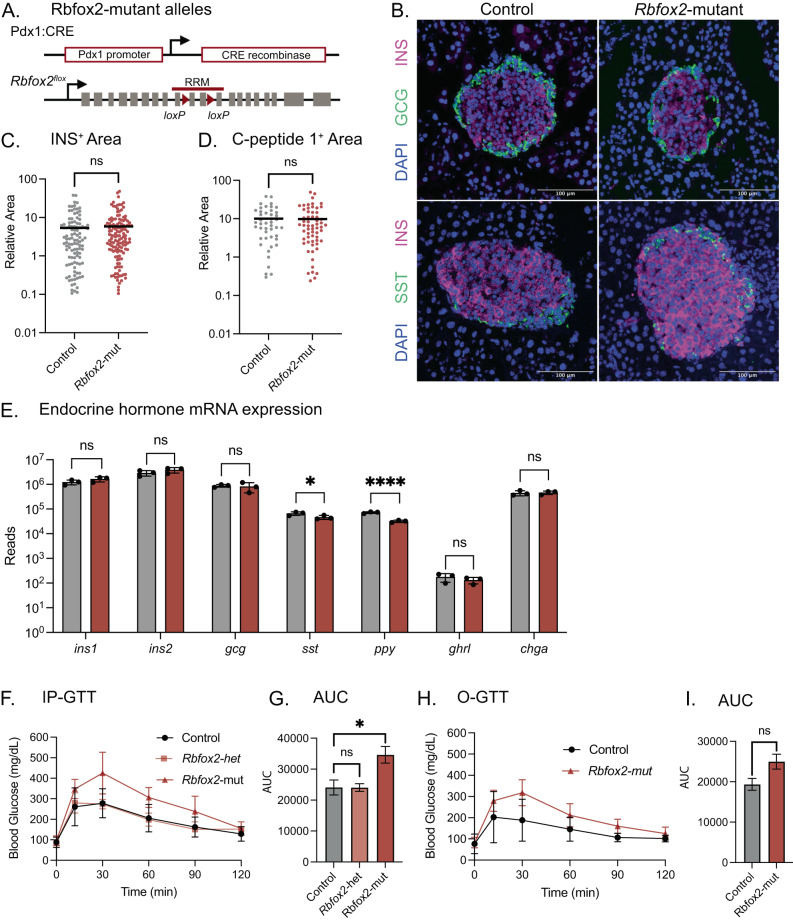
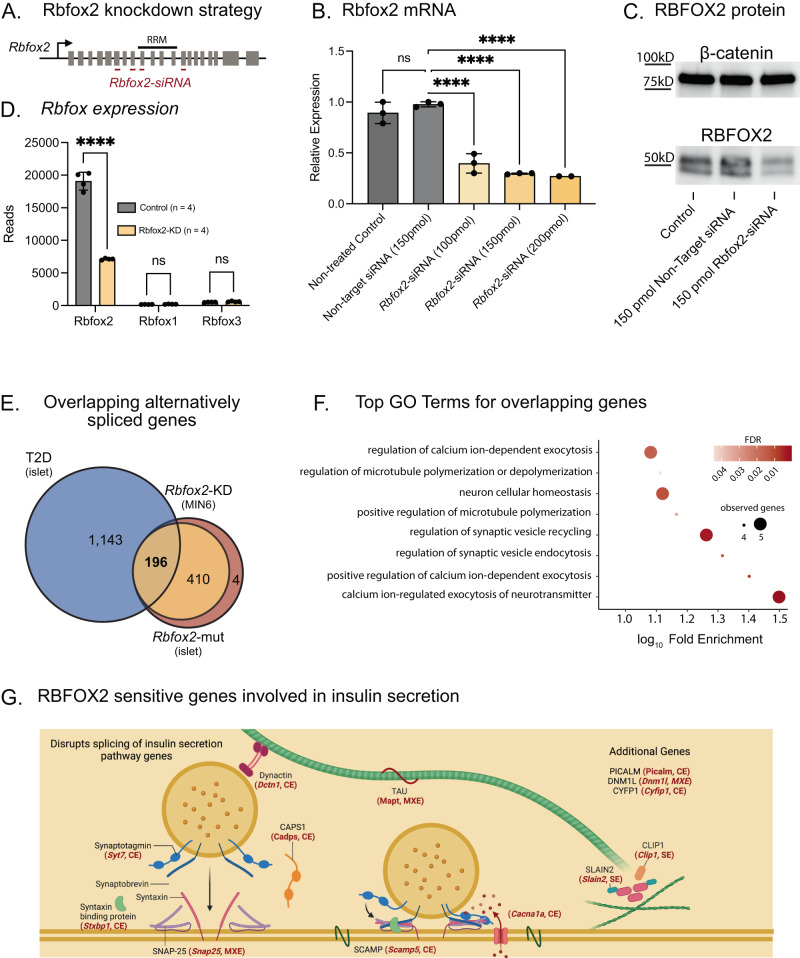
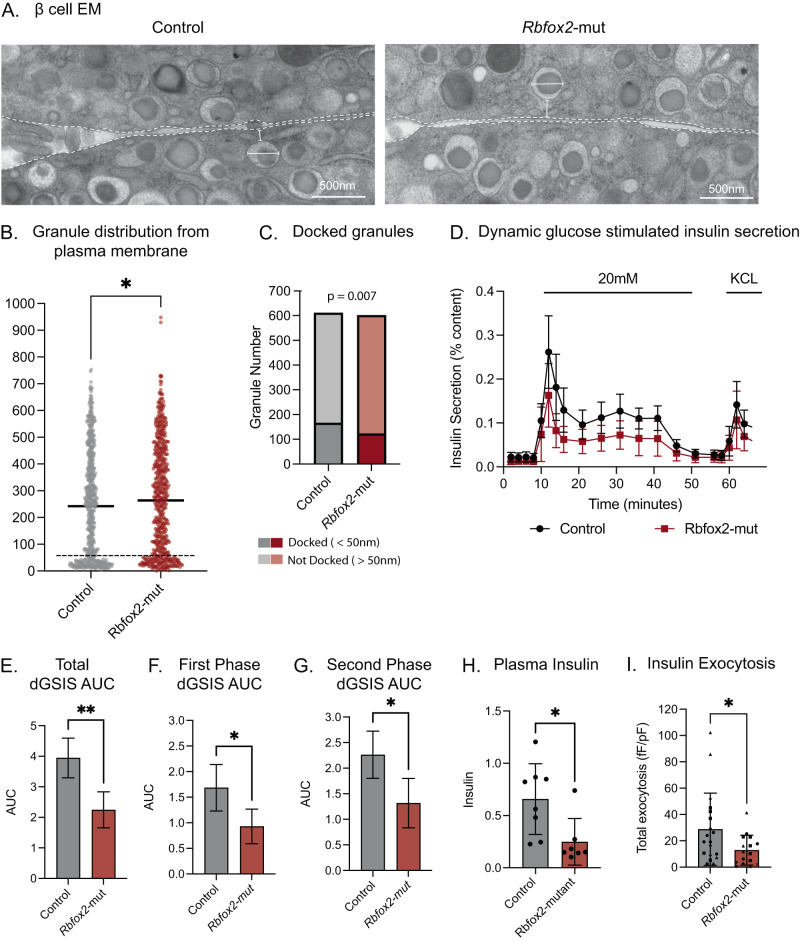
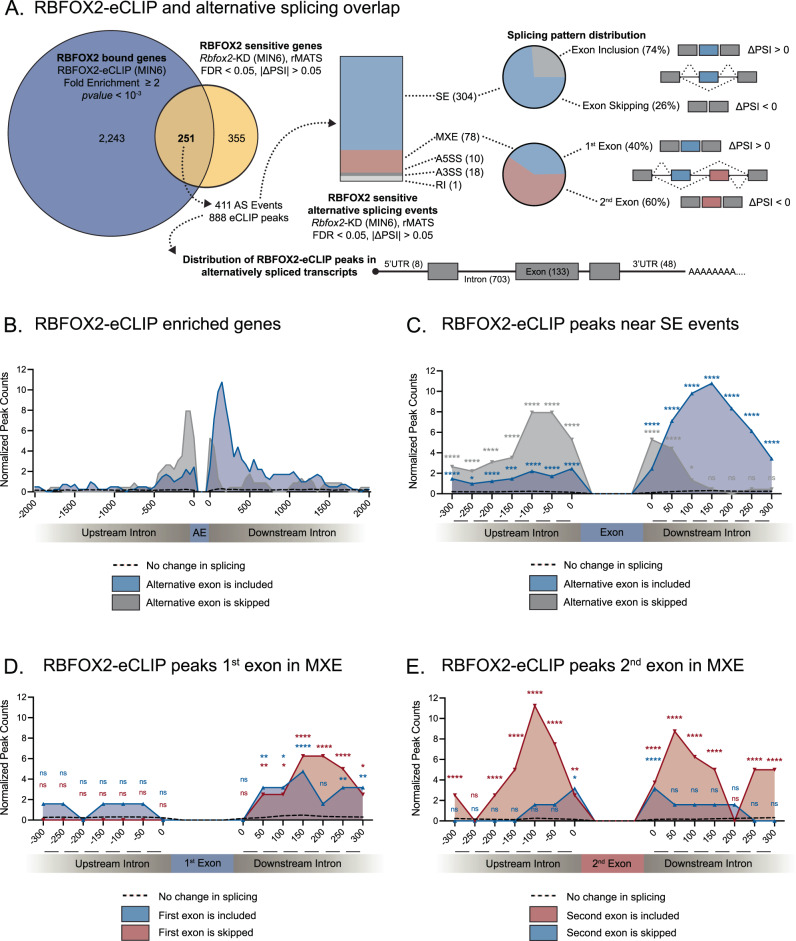
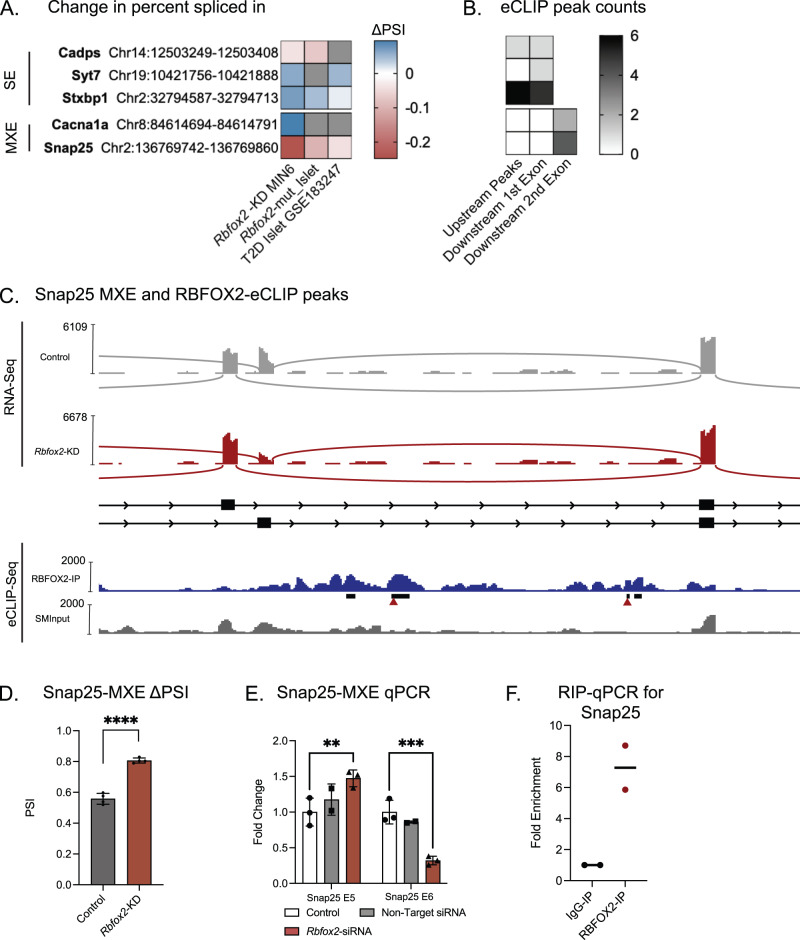
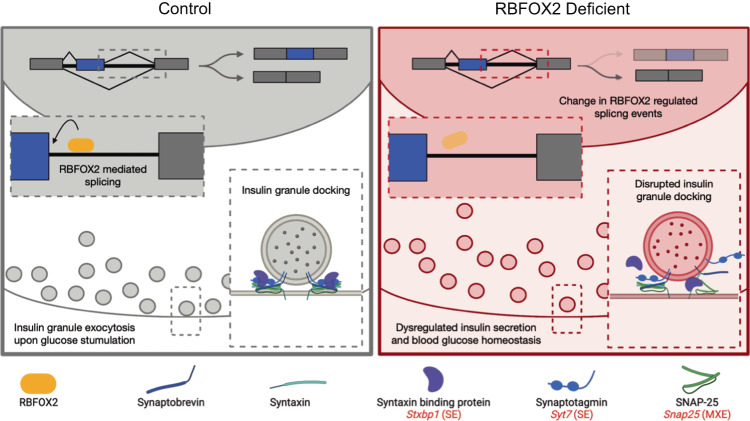
Insulin secretion is a tightly regulated process that is vital for maintaining blood glucose homeostasis. Although the molecular components of insulin granule trafficking and secretion are well established, how they are regulated to rapidly fine-tune secretion in response to changing environmental conditions is not well characterized. Recent studies have determined that dysregulation of RNA-binding proteins (RBPs) and aberrant mRNA splicing occurs at the onset of diabetes. We demonstrate that the RBP, RBFOX2, is a critical regulator of insulin secretion through the alternative splicing of genes required for insulin granule docking and exocytosis. Conditional mutation of Rbfox2 in the mouse pancreas results in decreased insulin secretion and impaired blood glucose homeostasis. Consistent with defects in secretion, we observe reduced insulin granule docking and corresponding splicing defects in the SNARE complex components. These findings identify an additional mechanism for modulating insulin secretion in both healthy and dysfunctional pancreatic β cells.


Conflict of interest statement

The authors declare no competing interests.

Figures

Fig. 1
Fig. 1. Rbfox2 expression is dysregulated in diabetes and the RBFOX2 consensus sequence is enriched near alternative exons.
A Mean-centered, normalized expression of most highly expressed splicing regulators in islets from mice with obesity but without diabetes (ND, ob/ob, n = 5) and islets from mice with both obesity and diabetes (T2D, NZO, n = 5) mouse islets from RNA-seq (GSE183247). B Normalized read counts of Rbfox2 in ND (ob/ob) and T2D (NZO) mouse islets, statistical analysis by DESeq2 p-adj = 0.00914. C 5-mer enrichment 200nt downstream of alternative cassette exons identified from rMATS (FDR < 0.05, ΔPSI > 0.01) in ND (ob/ob, n = 5) and T2D (NZO, n = 5) mouse islets, enrichment relative to constitutive exons plotted adj p-value from binomial test with Bonferroni correction, each dot represents a unique 5-mer, RBFOX2 5-mer GCAUG is labeled (GSE183247). (Data are represented as mean values with SD, ns p > 0.05, *p ≤ 0.05, **p ≤ 0.01, ***p ≤ 0.001, ****p < 0.0001).
Fig. 2
Fig. 2. Conditional Rbfox2 mutant mice are glucose intolerant.
A Pancreas specific Rbfox2-mutant mouse alleles, including loxP sites flanking the RNA recognition motif (RRM) in the Rbfox2 allele. B Immunofluorescence showing staining for DAPI (blue) and labeled with anti-insulin (INS, magenta) and anti-glucagon (GCG, green) or anti-somatostatin (SST, green) in control (Rbfox2fl/fl) and Rbfox2-mut (Pdx1:CRE; Rbfox2fl/fl) islets. C Quantification of anti-insulin+ area normalized by islet area, n = 3 male mice per group, t-test. D Quantification of anti-C-peptide 1+ area normalized by islet area, n = 3 male mice per group, t-test. E RNA expression of endocrine hormones from isolated islets of 8-week-old mice, control (Rbfox2fl/fl, n = 2 male, 1 female) and Rbfox2-mut (Pdx1:CRE; Rbfox2fl/fl, n = 2 male, 1 female), significance determined by DESeq2 (ins1 padj = 0.99, ins2 padj = 0.99, gcg padj = 0.99, sst padj = 0.049, ppy padj = 8.8 × 10-13, ghrl padj = 0.99, chga padj = 0.99) (F) Intraperitoneal glucose tolerance test (IP-GTT) in 8-week male mice, control (Rbfox2fl/fl or Rbfox2fl/+, n = 7), Rbfox2-het (Pdx1:CRE; Rbfox2fl/+, n = 3) and Rbfox2-mut (Pdx1:CRE; Rbfox2fl/fl, n = 6). (G) Area under the curve (AUC) and SD for data presented in (F), one-way ANOVA with multiple comparisons F = 6.479. H Oral glucose tolerance test (O-GTT) in 8-week male mice, control (Rbfox2fl/fl, n = 5) and Rbfox2-mut (Pdx1:CRE; Rbfox2fl/fl, n = 7). I Area under the curve (AUC) and SD for data presented in (H), t-test two-tailed t = 2.066, df = 9. (Data are represented as mean values with SD, ns p > 0.05, *p ≤ 0.05, **p ≤ 0.01, ***p ≤ 0.001, ****p < 0.0001).
Fig. 3
Fig. 3. Alternative splicing of insulin secretion machinery in β cell specific knockdown of Rbfox2.
A Rbfox2 siRNA targeting strategy in MIN6 cells. B qRT-PCR measuring Rbfox2 mRNA following siRNA titration normalized to actin, n = 3 for each condition, one-way ANOVA with multiple comparisons F = 70.52. C RBFOX2 western blot following 48-h 150 pmol siRNA treatment (n = 1). D Rbfox2 expression by RNA-Seq, n = 4 for each group, statistical significance determined by DESeq2 (Rbfox2 padj = 4.12 × 10−203, Rbfox1 padj = 0.28, Rbfox3 padj = 0.27). E Intersection of significantly alternatively spliced genes (FDR < 0.05, |ΔPSI | > 0.01) in Rbfox2-KD in MIN6 cells (yellow) with Rbfox2-mut mouse islet (red) and T2D mouse islet (ob/ob v NZO, blue). F Top terms from GO Term analysis of 196 overlapping genes. G Diagram of function for selected genes in top GO Terms, red gene names are significantly alternatively spliced in either cassette/skipped exon (SE) or mutually exclusive exon (MXE) across datasets (created with BioRender.com). (Data are represented as mean values with SD, ns p > 0.05, *p ≤ 0.05, **p ≤ 0.01, ***p ≤ 0.001, ****p < 0.0001).
Fig. 4
Fig. 4. Conditional Rbfox2 mutation results in decreased insulin secretion and reduction in docked insulin granules.
A Representative EM image of adjacent β cells. B Quantification of distance from granule edge to plasma membrane, n = 3 mice per group and each point is a granule, p = 0.02 t-test two-tailed t = 2.313, df = 1210. C Quantification of docked and undocked granules, n = 3 mice per group, statistical comparison by Fisher’s Exact Test. D Dynamic glucose stimulated insulin secretion (dGSIS) assay measuring insulin secretion as a percent of total insulin content in n = 4 control and n = 4 Rbfox2-mut mice. E Quantification of dGSIS assay comparing area under the curve, p = 0.0082, mean AUC and SD from data presented in (D) t-test two-tailed t = 3.88, df = 6. F Quantification of dGSIS assay comparing area under the curve during first phase insulin secretion from t = 10 to t = 21, p = 0.0376, mean AUC and SD from data presented in (D) t-test two-tailed t = 2.659, df = 6. G Quantification of dGSIS assay comparing area under the curve during second phase insulin secretion from t = 21 to t = 41, p = 0.0297, mean AUC and SD from data presented in (D) t-test two-tailed t = 2.2.836, df = 6. H Plasma insulin measured by ELISA 15 min post glucose injection, n = 8 control and n = 7 mutant mice, p = 0.0178 t-test two-tailed t = 2.712, df = 13. I Insulin exocytosis following membrane depolarization, n = 19 cells across 4 control biological replicates and n = 16 cells across 4 Rbfox2-mut biological replicates, p = 0.0376, statistical significance determined by t-test two-tailed t = 2.166, df = 33. (Data are represented as mean values with SD, ns p > 0.05, *p ≤ 0.05, **p ≤ 0.01, ***p ≤ 0.001, ****p < 0.00001).
Fig. 5
Fig. 5. Transcriptome wide assessment of RBFOX2 binding.
A Comparison of genes with one or more RBFOX2-eCLIP peaks identified by eCLIP-Seq with alternatively spliced transcripts from Rbfox2-KD in MIN6 cells identified by rMATs, cassette/skipped exon (SE), mutually exclusive exon (MXE), alternative 5’ start site (A5SS), alternative 3’ splice site (A3SS), or retained intron (RI) to identify RBFOX2 direct splicing targets, statistical significance was determined by rMATS for splicing analysis and Clipper for eCLIP analysis. B Distribution of RBFOX2 eCLIP-peaks relative to alternatively spliced included cassette exons (blue), skipped cassette exons (gray), or insensitive exons where splicing is not significantly changed between Rbfox2-KD and control (dashed line) 2000nt up and downstream of alternative exons. C Distribution of RBFOX2 eCLIP-peaks relative to alternatively spliced included cassette exons (blue), skipped cassette exons (gray), or insensitive exons where splicing is not significantly changed between Rbfox2-KD and control (dashed line) 300nt up and downstream of alternative exons. D Distribution of RBFOX2 eCLIP-peaks relative to alternatively spliced included 1st exon in mutually exclusive exons (blue), skipped 1st exon in mutually exclusive exons (red), or insensitive exons (dashed line). E Distribution of RBFOX2 eCLIP-peaks relative to alternatively spliced included 2nd exon in mutually exclusive exons (red), skipped 2nd exon in mutually exclusive exons (blue), or insensitive exons (dashed line). CE Bootstrapping of eCLIP peaks at RBFOX2 insensitive exons was used to identify the probability and distribution of RBFOX2 binding events (peaks) and significant enrichment was calculated using a Poisson distribution, (ns FDR > 0.05, *FDR ≤ 0.05, **FDR ≤ 0.01, ***FDR ≤ 0.001, ****FDR < 0.0001).
Fig. 6
Fig. 6. RBFOX2 binding and regulation of alternative splicing in genes involved in insulin secretion.
A Heatmap of shared alternatively spliced exons (cassette/skipped exon, SE and mutually exclusive exon, MXE) across Rbfox2-KD in MIN6, Rbfox2-mut islets, and T2D islets (ob/ob, NZO) color indicates PSI from rMATS, gray boxes indicate no significant splicing identified in specific exon. B eCLIP peak count in upstream or downstream introns in MIN6 cells. C Sashimi plot for Snap25 MXE with eCLIP peaks, RBFOX2 eCLIP-Seq (blue), Clipper identified significant peaks (black bars), GCAUG sequence (red triangles), SMI eCLIP-Seq (gray). D Snap25 MXE percent spliced in (ΔPSI), n = 4 per condition, FDR < 0.00001 significance determined by rMATs. E qRT-PCR validation of Snap25 MXE alternative splicing event in Rbfox2-KD vs control, n = 4, two-way ANOVA with multiple comparisons (Snap25-5a: Non-Treated vs. Non-Target padj = 0.3601, Non-Treated vs. Rbfox2-KD padj = 0.005, Snap25-5b: Non-Treated vs. Non-Target padj = 0.5061, Non-Treated vs. Rbfox2-KD padj = 0.0004). F RIP-qPCR validation of RBFOX2 binding to Snap25 in MIN6 (n = 2). (Data are represented as mean values with SD, ns p > 0.05, *p ≤ 0.05, **p ≤ 0.01, ***p ≤ 0.001, ****p < 0.00001).
Fig. 7
Fig. 7. Model of RBFOX2 mediated regulation of insulin granule secretion in β cells.
RBFOX2 (yellow) binds downstream of alternative exons to promote exon inclusion in key genes involved in insulin granule docking and exocytosis (including Stxbp1, Syt7, and Snap25). Splicing of these genes allows for proper docking and exocytosis of insulin granules. Loss of RBFOX2, results in mis-splicing of insulin granule docking and exocytosis genes. Causing a decrease in the docked pool of insulin granules and corresponding decrease in insulin secretion (created with BioRender.com).

References

    1. Khan MAB, et al. Epidemiology of type 2 diabetes - global burden of disease and forecasted trends. J. Epidemiol. Glob. Health. 2020;10:107–111. doi: 10.2991/jegh.k.191028.001. - DOI - PMC - PubMed
    1. Bratanova-Tochkova TK, et al. Triggering and augmentation mechanisms, granule pools, and biphasic insulin secretion. Diabetes. 2002;51:S83–S90. doi: 10.2337/diabetes.51.2007.S83. - DOI - PubMed
    1. Dean PM. Ultrastructural morphometry of the pancreatic -cell. Diabetologia. 1973;9:115–119. doi: 10.1007/BF01230690. - DOI - PubMed
    1. Rorsman P, Braun M. Regulation of insulin secretion in human pancreatic islets. Annu. Rev. Physiol. 2013;75:155–179. doi: 10.1146/annurev-physiol-030212-183754. - DOI - PubMed
    1. Gandasi NR, et al. Glucose-dependent granule docking limits insulin secretion and is decreased in human type 2 diabetes. Cell Metab. 2018;27:470–478.e474. doi: 10.1016/j.cmet.2017.12.017. - DOI - PubMed

Publication types

Associated data