Radiogenomic analysis of cellular tumor-stroma heterogeneity as a prognostic predictor in breast cancer
- PMID: 38007511
- PMCID: PMC10675940
- DOI: 10.1186/s12967-023-04748-6
Radiogenomic analysis of cellular tumor-stroma heterogeneity as a prognostic predictor in breast cancer
Abstract
Background: The tumor microenvironment and intercellular communication between solid tumors and the surrounding stroma play crucial roles in cancer initiation, progression, and prognosis. Radiomics provides clinically relevant information from radiological images; however, its biological implications in uncovering tumor pathophysiology driven by cellular heterogeneity between the tumor and stroma are largely unknown. We aimed to identify radiogenomic signatures of cellular tumor-stroma heterogeneity (TSH) to improve breast cancer management and prognosis analysis.
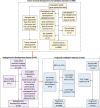
Methods: This retrospective multicohort study included five datasets. Cell subpopulations were estimated using bulk gene expression data, and the relative difference in cell subpopulations between the tumor and stroma was used as a biomarker to categorize patients into good- and poor-survival groups. A radiogenomic signature-based model utilizing dynamic contrast-enhanced magnetic resonance imaging (DCE-MRI) was developed to target TSH, and its clinical significance in relation to survival outcomes was independently validated.
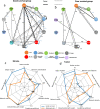
Results: The final cohorts of 1330 women were included for cellular TSH biomarker identification (n = 112, mean age, 57.3 years ± 14.6) and validation (n = 886, mean age, 58.9 years ± 13.1), radiogenomic signature of TSH identification (n = 91, mean age, 55.5 years ± 11.4), and prognostic (n = 241) assessments. The cytotoxic lymphocyte biomarker differentiated patients into good- and poor-survival groups (p < 0.0001) and was independently validated (p = 0.014). The good survival group exhibited denser cell interconnections. The radiogenomic signature of TSH was identified and showed a positive association with overall survival (p = 0.038) and recurrence-free survival (p = 3 × 10⁻⁴).
Conclusion: Radiogenomic signatures provide insights into prognostic factors that reflect the imbalanced tumor-stroma environment, thereby presenting breast cancer-specific biological implications and prognostic significance.
Keywords: Breast cancer; Cell subpopulation; Prognosis; Radiogenomics.
© 2023. The Author(s).
Conflict of interest statement
The authors declare that they have no competing interests.
Figures


Similar articles
-
Radiogenomic Signatures of Oncotype DX Recurrence Score Enable Prediction of Survival in Estrogen Receptor-Positive Breast Cancer: A Multicohort Study.Radiology. 2022 Mar;302(3):516-524. doi: 10.1148/radiol.2021210738. Epub 2021 Nov 30. Radiology. 2022. PMID: 34846204
-
Radiogenomic signatures reveal multiscale intratumour heterogeneity associated with biological functions and survival in breast cancer.Nat Commun. 2020 Sep 25;11(1):4861. doi: 10.1038/s41467-020-18703-2. Nat Commun. 2020. PMID: 32978398 Free PMC article.
-
Tumour heterogeneity revealed by unsupervised decomposition of dynamic contrast-enhanced magnetic resonance imaging is associated with underlying gene expression patterns and poor survival in breast cancer patients.Breast Cancer Res. 2019 Oct 17;21(1):112. doi: 10.1186/s13058-019-1199-8. Breast Cancer Res. 2019. PMID: 31623683 Free PMC article.
-
Emerging immune gene signatures as prognostic or predictive biomarkers in breast cancer.Arch Pharm Res. 2019 Nov;42(11):947-961. doi: 10.1007/s12272-019-01189-y. Epub 2019 Nov 9. Arch Pharm Res. 2019. PMID: 31707598 Review.
-
Protein biomarkers for subtyping breast cancer and implications for future research: a 2024 update.Expert Rev Proteomics. 2024 Sep-Oct;21(9-10):401-416. doi: 10.1080/14789450.2024.2423625. Epub 2024 Nov 3. Expert Rev Proteomics. 2024. PMID: 39474929 Review.
Cited by
-
Machine learning-based integration of DCE-MRI radiomics for STAT3 expression prediction and survival stratification in breast cancer.Front Immunol. 2025 Jun 25;16:1619186. doi: 10.3389/fimmu.2025.1619186. eCollection 2025. Front Immunol. 2025. PMID: 40636126 Free PMC article.
-
Fibroblast activation protein constitutes a novel target of chimeric antigen receptor T-cell therapy in solid tumors.Cancer Sci. 2024 Nov;115(11):3532-3542. doi: 10.1111/cas.16285. Epub 2024 Aug 21. Cancer Sci. 2024. PMID: 39169645 Free PMC article. Review.
-
Radiomics in breast cancer: Current advances and future directions.Cell Rep Med. 2024 Sep 17;5(9):101719. doi: 10.1016/j.xcrm.2024.101719. Cell Rep Med. 2024. PMID: 39293402 Free PMC article. Review.
-
From Images to Genes: Radiogenomics Based on Artificial Intelligence to Achieve Non-Invasive Precision Medicine in Cancer Patients.Adv Sci (Weinh). 2025 Jan;12(2):e2408069. doi: 10.1002/advs.202408069. Epub 2024 Nov 13. Adv Sci (Weinh). 2025. PMID: 39535476 Free PMC article. Review.
-
Imaging genomics of cancer: a bibliometric analysis and review.Cancer Imaging. 2025 Mar 4;25(1):24. doi: 10.1186/s40644-025-00841-9. Cancer Imaging. 2025. PMID: 40038813 Free PMC article. Review.
References
Publication types
MeSH terms
Substances
Grants and funding
LinkOut - more resources
Full Text Sources
Medical

