. 2024 Jan;31(1):65-77.
doi: 10.1038/s41418-023-01240-y. Epub 2023 Nov 25.

SIRT5-mediated ME2 desuccinylation promotes cancer growth by enhancing mitochondrial respiration

Affiliations

SIRT5-mediated ME2 desuccinylation promotes cancer growth by enhancing mitochondrial respiration

Peng Teng et al. Cell Death Differ. 2024 Jan.

Abstract

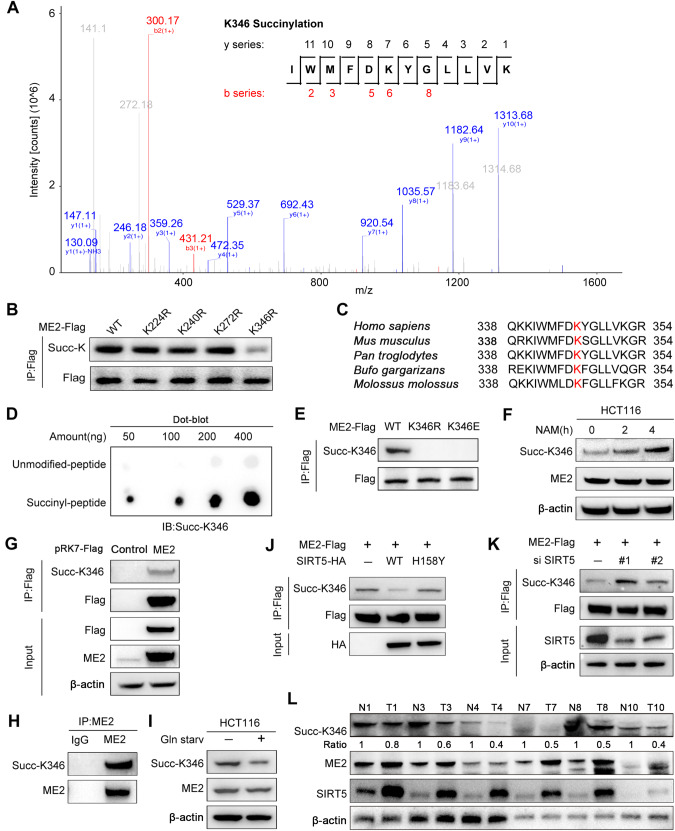
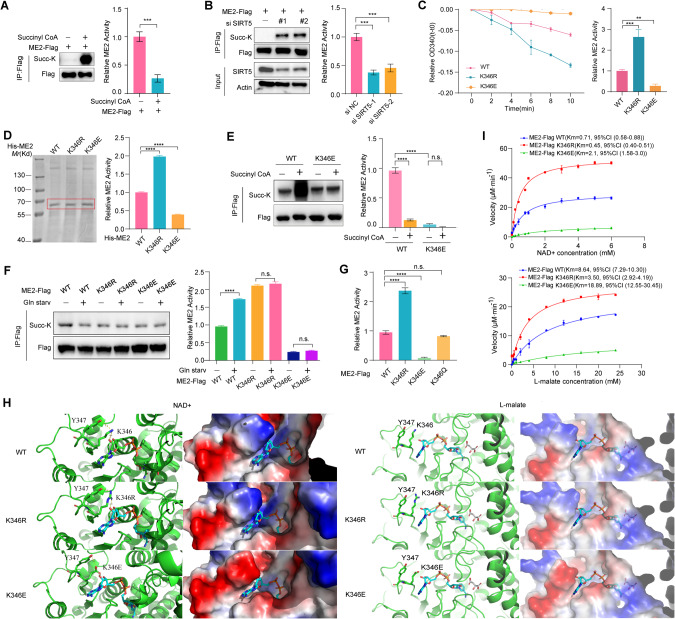
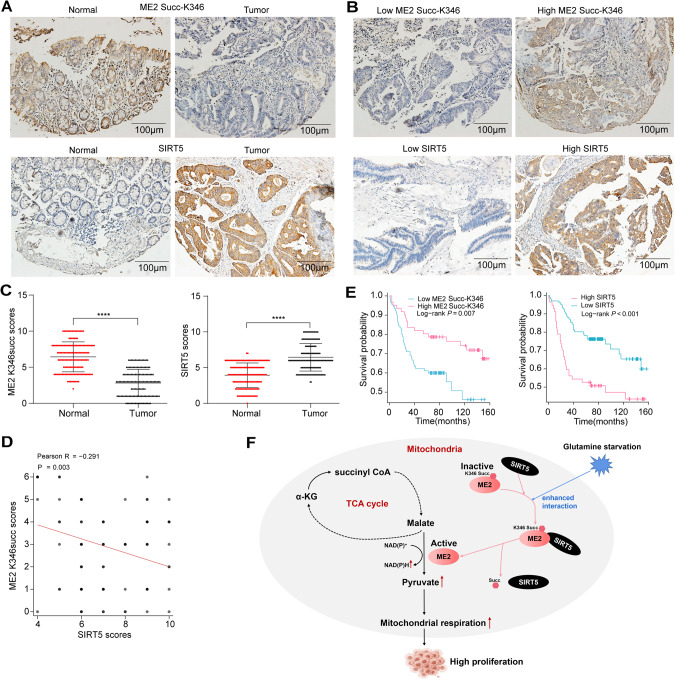
Mitochondrial malic enzyme 2 (ME2), which catalyzes the conversion of malate to pyruvate, is frequently upregulated during tumorigenesis and is a potential target for cancer therapy. However, the regulatory mechanism underlying ME2 activity is largely unknown. In this study, we demonstrate that ME2 is highly expressed in human colorectal cancer (CRC) tissues, and that ME2 knockdown inhibits the proliferation of CRC cells. Furthermore, we reveal that ME2 is succinylated and identify Sirtuins 5 (SIRT5) as an ME2 desuccinylase. Glutamine deprivation directly enhances the interaction of SIRT5 with ME2 and thus promotes SIRT5-mediated desuccinylation of ME2 at lysine 346, activating ME2 enzymatic activity. Activated ME2 significantly enhances mitochondrial respiration, thereby counteracting the effects of glutamine deprivation and supporting cell proliferation and tumorigenesis. Additionally, the levels of succinylated ME2 at K346 and SIRT5 in CRC tissues, which are negatively correlated, are associated with patient prognosis. These observations suggest that SIRT5-catalyzed ME2 desuccinylation is a key signaling event through which cancer cells maintain mitochondrial respiration and promote CRC progression under glutamine deficiency conditions, offering the possibility of targeting SIRT5-mediated ME2 desuccinylation for CRC treatment.


Conflict of interest statement

The authors declare no competing interests.

Figures

Fig. 1
Fig. 1. ME2 is overexpressed in CRC cells and promotes their proliferation.
A ME2 mRNA expression in digestive tract tumors and adjacent normal tissues from The Cancer Genome Atlas (TCGA) dataset. Mann-Whitney U Test was used for statistical analyses. B Relative mRNA expression levels of ME2 in the CRC dataset of GSE73360. C Detection and quantification of ME2 protein levels in 10 paired clinical CRC tissues (T) and adjacent normal tissues (N) by western blotting. D IHC analyses were performed with 146 paired tumor tissues and adjacent noncancerous tissues (NCT). E Kaplan-Meier survival analyses based on the expression of ME2 in CRC tissues. Patients with high ME2 expression (score 2-3) had poorer OS than those with low ME2 expression (score 0–1). P values were calculated using the log-rank test (Mantel-Cox). F Univariate and Multivariate Cox regression analyses. The hazard ratio (HR) and 95% confidence interval (CI) are plotted for each factor. G ME2 protein levels in CRC cell lines and the normal human colon cell line NCM460 were detected by western blotting. H Validation of the knockdown efficiency of ME2 in CRC cells transfected with ME2-specific short interfering RNAs (siME2) or control siRNA (siNC) using western blotting. I Effects of ME2 knockdown on CRC cell proliferation were evaluated by CCK-8 assays. The P values were determined by Dunnett’s test after one-way ANOVA. Data are shown as mean ± S.D (n = 3). *, p < 0.05; ***, p < 0.001, ****, p < 0.0001.
Fig. 2
Fig. 2. SIRT5 interacts with and desuccinylates ME2.
A Candidates of ME2-associated proteins identified by immunopurification and mass spectrometry analyses. B Immunofluorescence analyses of endogenous SIRT5, ME2 and the mitochondrial marker Tom20 in HEK293T and HCT116 cells. Scale bars, 5μm. C Endogenous interaction of SIRT5 and ME2 in HCT116 cells. D In vitro ME2 succinylation assay. ME2 proteins were incubated with different concentrations of succinyl-CoA. Protein succinylation levels were analyzed by western blotting. E Succinylation levels of ectopically expressed ME2 in HEK293T cells were measured. Cells were treated with 5 mM NAM for 3 h before harvesting. ME2-Flag was immunoprecipitated from cell lysates and its succinylation was examined with a pan-succinylated lysine antibody. F Succinylation levels of endogenous ME2 in HCT116 cells were analyzed. Cells were treated with 5 mM NAM for the indicated durations. Endogenous ME2 was immunoprecipitated and its succinylation was examined with a pan-succinylated lysine antibody. G Effects of SIRT5 or its dead mutant SIRT5 H158Y on the succinylation of ME2. H Effects of glutamine starvation on the interaction between ectopically expressed SIRT5 and ME2 in HEK293T cells. HEK293T cells transfected with Flag-tagged ME2 and HA-tagged SIRT5 were treated with glutamine (4 mM or indicated concentrations) for 6 h, followed by immunoprecipitation with anti-Flag M2 beads and analyses by western blotting. I Effects of glutamine starvation on the interaction between endogenous SIRT5 and ME2 in HCT116 cells. HCT116 cells were treated with glutamine (0 or 4 mM) for 6 h. Precipitated ME2 proteins were analyzed with anti-SIRT5 antibodies.
Fig. 3
Fig. 3. ME2 is succinylated at lysine 346.
A Identification of succinylated peptides around ME2 K346 as determined by mass spectrometry. B Measurement of ME2 succinylation in HEK293T cells transfected with Flag-tagged wide-type (WT) or mutant (K224R, K240R, K272R and K346R) ME2. ME2-Flag was immunoprecipitated and its succinylation was examined with a pan-succinylated lysine antibody. C The K346 residue of ME2 (marked red) is evolutionarily conserved. D Characterization of the anti-Succ-K346 antibody using a dot blot assay. Nitrocellulose membranes were spotted with different amounts of succinyl-K346 peptide or unmodified peptide and immunoblotted with anti-Succ-K346 antibodies. E Validation of an anti-Succ-K346 antibody using western blotting. Succinylation levels of ME2-Flag WT, ME2-Flag K346R, or ME2-Flag K346E ectopically expressed in HEK293T cells were measured by the anti-Succ-K346 antibody. F Western blotting detection of the K346 succinylation levels of ME2 in HCT116 cells treated with 5 mM NAM. G, H Western blotting detection of the K346 succinylation levels of ectopically expressed ME2 (G) and endogenous ME2 (H) in HEK293T cells. I Western blotting analyses of K346 succinylation levels of HCT116 cells under the condition of glutamine starvation. J Effects of SIRT5 or its dead mutant SIRT5 H158Y on the succinylation of ME2 at K346. K Effects of SIRT5 knockdown on the succinylation of ME2 at K346. L Measurement of ME2 K346 succinylation, ME2, and SIRT5 protein levels in clinical CRC tissues (T) and adjacent normal tissues (N) using western blotting.
Fig. 4
Fig. 4. Desuccinylation at K346 by SIRT5 enhances ME2 activity.
A In vitro succinylation of ME2 decreased its activity. ME2 proteins were purified and incubated with or without 100 μM succinyl-CoA for 30 min at 37 °C before western blotting and ME2 enzymatic assays were performed. Unpaired two-tailed t-test was used for statistical analyses. B ME2 enzyme activity was determined after SIRT5 knockdown. Left, elevated ME2 succinylation after knockdown of SIRT5. Right, quantification of ME2 enzymatic activity. C K346R mutation increased ME2 activity. Different ME2 plasmids were transfected into HEK293T cells, and ME2 proteins were purified from these cells and subjected to ME2 enzymatic activity analyses. D Activity measurement of recombinant ME2 and its mutants. Recombinant ME2 and its mutated proteins were purified from Escherichia coli. SDS-PAGE, Coomassie Brilliant Blue staining, and ME2 activity assays were performed. E Succinyl-CoA decreased the enzymatic activity of ME2 WT but not that of the K346E mutant. HEK293T cells were transfected with the indicated plasmids, followed by immunoprecipitation and treatment with succinyl-CoA (100 μM, 30 min). Enzymatic activities of purified ME2 proteins were detected. FG Effects of glutamine starvation (F) and K346Q (G) on the catalytic activities of ME2 and its mutants. Flag-tagged ME2 proteins were immunopurified from HEK293T cells transfected with different ME2 constructs and subjected to ME2 activity analyses. Cells were suffered from glutamine starvation for 6 h before harvesting (F). H Cartoon representation of the structure of human ME2 and its mutants. The NAD+ binding pocket (left) and L-malate binding pocket (right) (PDB ID: 1EFK). ME2 proteins are depicted in light green, while the mutated positions are indicated by sticks. NAD+ and L-malate molecules are also represented as sticks, with their carbon atoms colored cyan and white, respectively. The Y347 residue of ME2 is indicated by a stick representation. The right panels show the impact of K346R and K346E on the electrostatic environment surrounding the modified site. All figures were generated using PyMOL (www.pymol.org) I Steady-state kinetic analyses of WT ME2, ME2 K346R, and ME2 K346E. Recombinant proteins were purified and subjected to kinetic assays (NAD+ and L-malate). Data are shown as mean ± S.D (n = 3). P values were calculated using Tukey’s test (E, F) or Dunnett’s test (BD and G) after One-way ANOVA. **, p < 0.01; ***, p < 0.001; ****, p < 0.0001; n.s. not significant.
Fig. 5
Fig. 5. ME2 K346 desuccinylation modulates mitochondrial respiration and redox homeostasis.
A Schematic overview of malic enzymes involving in in central carbon metabolism. BH Identification of reconstituted HCT116 cell lines with reconstituted protein expression. ME2-depleted HCT116 cells were reconstituted with empty vector, shRNA-resistant Flag-tagged WT, K346R, or K346E of ME2. Total cell lysates were prepared, and protein levels were measured by western blotting (B). ROS (C), NADPH/NADP+ ratio (D) and GSH/GSSG ratio (E), pyruvate (F), malate (G) and triglyceride (H) were measured in the indicated cells were determined. IL The ECAR (I), OCR (J), Lactate levels (K), and ATP production rate (L) in HCT116 cells with ME2–knockdown and re-expression were measured. P values were calculated using Dunnett’s test after One-way ANOVA. **, P < 0.01; ***, P < 0.001; n.s., not significant.
Fig. 6
Fig. 6. ME2 K346 desuccinylation promotes tumor growth.
A, B Cell proliferation (A) and colony formation assay results for the indicated HCT116 cells. CE Effects of ME2 and its K346R or K346E mutants on the in vivo tumor growth. HCT116 cells (2 × 106) with different ME2 status were subcutaneously injected into the flanks of thymus-free nude mice (n = 5/group). The mice were euthanized and examined for tumor growth 28 days after injection (C). Tumor volumes (D) and tumor weights (E) were measured. F, G Ki67 expression in the xenograft tumors was measured by immunohistochemical staining. The number of Ki67-positive cells in 10 microscopic fields were counted. The magnification is 20×. Scale bars, 50 μm. H Measurements of the GSH/GSSG (G) and NADPH/NADP+ ratios (H) in the xenograft tumor tissues. P values were calculated using Dunnett’s test after One-way ANOVA. **, P < 0.01; ***, P < 0.001; n.s., not significant.
Fig. 7
Fig. 7. ME2 K346 succinylation and SIRT5 are aberrantly expressed in CRC tissues.
AC The levels of ME2 K346 succinylation and SIRT5 in146 paired CRC tissues and their paired adjacent normal tissues were measured by immunohistochemistry staining. Representative staining images and scores for ME2 K346 succinylation (A and C) and SIRT5 (B and C) are shown. Scale bars, 100 μM. Mann-Whitney U Test was used for statistical analyses for (C). ****, P < 0.0001. D The correlation between ME2 K346succ expression and SIRT5 levels was analyzed. E Kaplan-Meier survival analyses based on the succinylation levels of ME2 K346 and SIRT5 expression in CRC tissues. P values were calculated using the log-rank test. F A regulatory mechanism underlying SIRT5-coupled ME2 desuccinylation and activation under glutamine deprivation conditions. ME2 is succinylated at K346, leading to decreased ME2 enzymatic activity. The interaction between SIRT5 and ME2, which is facilitated by glutamine starvation, leads to K346 desuccinylation and increased ME2 enzymatic activity. Activated ME2 enhances mitochondrial respiration and promotes tumor growth.

Similar articles

Cited by

References

    1. Pavlova NN, Zhu J, Thompson CB. The hallmarks of cancer metabolism: Still emerging. Cell Metab. 2022;34:355–77. doi: 10.1016/j.cmet.2022.01.007. - DOI - PMC - PubMed
    1. Xu D, Shao F, Bian X, Meng Y, Liang T, Lu Z. The evolving landscape of noncanonical functions of metabolic enzymes in cancer and other pathologies. Cell Metab. 2021;33:33–50. doi: 10.1016/j.cmet.2020.12.015. - DOI - PubMed
    1. Zhao J, Zhang J, Yu M, Xie Y, Huang Y, Wolff DW, et al. Mitochondrial dynamics regulates migration and invasion of breast cancer cells. Oncogene. 2013;32:4814–24. doi: 10.1038/onc.2012.494. - DOI - PMC - PubMed
    1. Kashatus JA, Nascimento A, Myers LJ, Sher A, Byrne FL, Hoehn KL, et al. Erk2 phosphorylation of Drp1 promotes mitochondrial fission and MAPK-driven tumor growth. Mol Cell. 2015;57:537–51. doi: 10.1016/j.molcel.2015.01.002. - DOI - PMC - PubMed
    1. Weinberg SE, Chandel NS. Targeting mitochondria metabolism for cancer therapy. Nat Chem Biol. 2015;11:9–15. doi: 10.1038/nchembio.1712. - DOI - PMC - PubMed

Publication types

LinkOut - more resources