. 2023 Nov 25;14(1):7737.
doi: 10.1038/s41467-023-43671-8.

Multi-omics analysis of hospital-acquired diarrhoeal patients reveals biomarkers of enterococcal proliferation and Clostridioides difficile infection

Affiliations

Multi-omics analysis of hospital-acquired diarrhoeal patients reveals biomarkers of enterococcal proliferation and Clostridioides difficile infection

Marijana Bosnjak et al. Nat Commun. .

Abstract

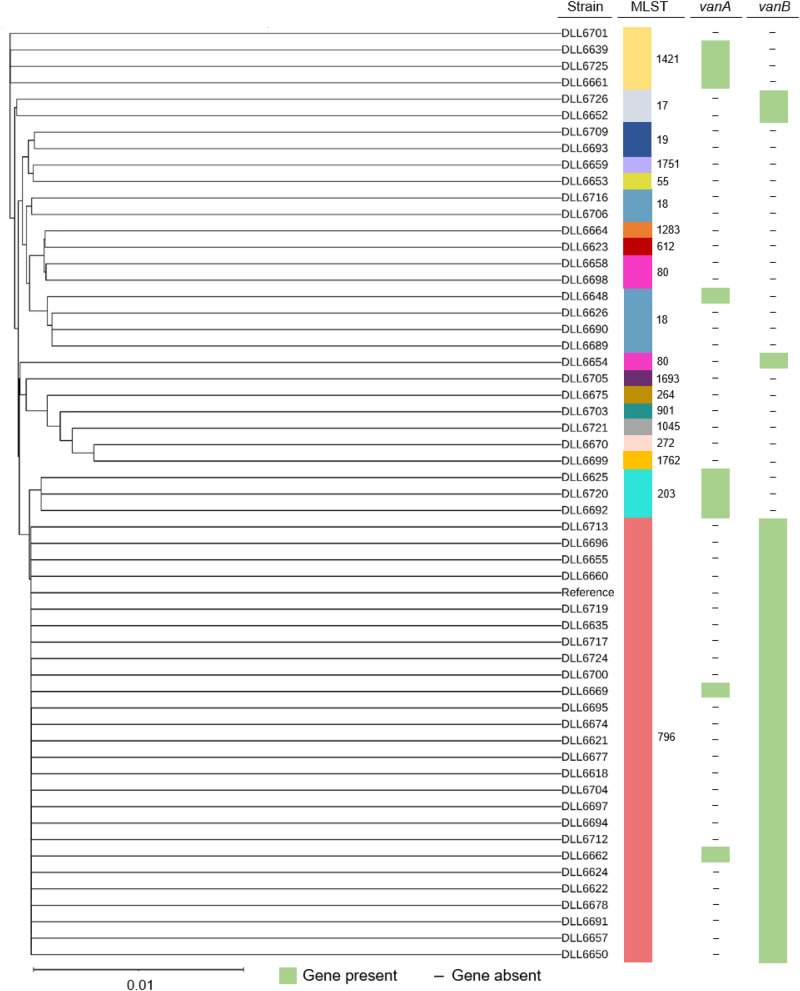
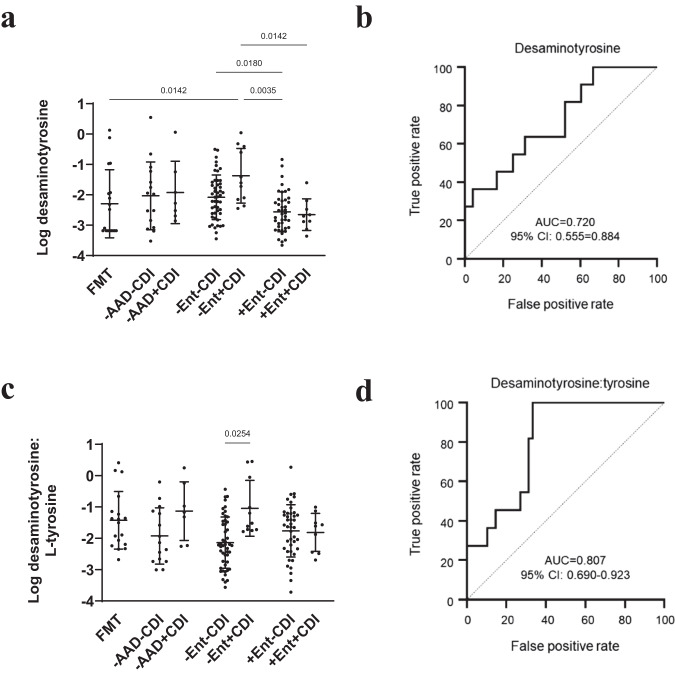
Hospital-acquired diarrhoea (HAD) is common, and often associated with gut microbiota and metabolome dysbiosis following antibiotic administration. Clostridioides difficile is the most significant antibiotic-associated diarrhoeal (AAD) pathogen, but less is known about the microbiota and metabolome associated with AAD and C. difficile infection (CDI) with contrasting antibiotic treatment. We characterised faecal microbiota and metabolome for 169 HAD patients (33 with CDI and 133 non-CDI) to determine dysbiosis biomarkers and gain insights into metabolic strategies C. difficile might use for gut colonisation. The specimen microbial community was analysed using 16 S rRNA gene amplicon sequencing, coupled with untargeted metabolite profiling using gas chromatography-mass spectrometry (GC-MS), and short-chain fatty acid (SCFA) profiling using GC-MS. AAD and CDI patients were associated with a spectrum of dysbiosis reflecting non-antibiotic, short-term, and extended-antibiotic treatment. Notably, extended antibiotic treatment was associated with enterococcal proliferation (mostly vancomycin-resistant Enterococcus faecium) coupled with putative biomarkers of enterococcal tyrosine decarboxylation. We also uncovered unrecognised metabolome dynamics associated with concomitant enterococcal proliferation and CDI, including biomarkers of Stickland fermentation and amino acid competition that could distinguish CDI from non-CDI patients. Here we show, candidate metabolic biomarkers for diagnostic development with possible implications for CDI and vancomycin-resistant enterococci (VRE) treatment.


Conflict of interest statement

The authors declare no competing interests.

Figures

Fig. 1
Fig. 1. Extended antibiotic exposure and combination antibiotic therapy was associated with microbiota dominated by Enterococcaceae.
Violin plots of Shannon diversity indices assessed species richness and evenness among a FMT donors (n = 20), non-antibiotic AAD (-AAD) (n = 29), 1–2 days (n = 29), 3–4 days (n = 36), 5–7 days (n = 28) and ≥ 8 days (n = 37) antibiotic treatment groups, and, b FMT donors (n = 20), non-antibiotic AAD (-AAD) (n = 29), 1 class (n = 49), 2 classes (n = 44), 3 classes (n = 29) and ≥ 4 antibiotic classes (n = 14) treatment groups. Mean abundance of major genera colour coded and presented as stacked bar graphs present in c FMT donors, non-antibiotic AAD (-AAD), 1–2 days, 3–4 days, 5–7 days and ≥ 8 days antibiotic treatment groups, and, d FMT donors, non-antibiotic AAD (-AAD), 1 class, 2 classes, 3 classes and ≥ 4 antibiotic classes treatment groups. In panels a and b, data are presented as mean ± SD. Statistical significance was determined at p < 0.05 and comparisons used Kruskal–Wallis tests with FDR adjusted for multiple comparisons using the Benjamini and Hochberg method. Source data for panels are provided as a Source Data file.
Fig. 2
Fig. 2. Core phylogenetic analysis, multi-locus sequencing typing (MLST), and vancomycin resistance gene profiling of E. faecium isolates.
Core genome phylogeny, sequence types, and the presence of vancomycin resistance genes vanA and vanB were determined using Nullabor v2.0 pipeline (https://github.com/tseemann/nullarbor). Analysis was performed against the reference strain, E. faecium Ef_aus00233. In the MLST column, each colour presents a visual representation of sequence type diversity. In the vanA and vanB columns, green denotes gene presence, and – symbol denotes gene absence.
Fig. 3
Fig. 3. Low diversity AAD with enterococcal proliferation formed a microbially distinct subset of AAD.
a Summary of the HAD and antibiotic-associated diarrhoeal ( + AAD) patient cohorts stratified by enterococcal proliferation. Non-antibiotic AAD (-AAD), AAD without enterococcal proliferation (-Ent+AAD) and AAD with enterococcal proliferation ( + Ent AAD) whose microbiota comprised 25-99% of Enterococcus OTUs. b Violin plot of Shannon diversity indices assessed species richness and evenness among FMT donors (n = 20), -AAD (n = 30), -Ent AAD (n = 76) and +Ent AAD (n = 61) patients. Alpha diversity was estimated from Shannon diversity index (OTU abundances rarefied to 1107 reads). Statistical significance was determined at p < 0.05 and comparisons used Kruskal-Wallis tests with FDR adjusted for multiple comparisons using the Benjamini and Hochberg method. Source data provided as a Source Data file. c PCoA plot based on the Bray-Curtis dissimilarity assessed microbiota differences of FMT donors (n = 20), -AAD (n = 30), -Ent AAD (n = 76) and +Ent AAD (n = 61) patients (R2 = 0.328, p < 0.001). Statistical significance was determined at p < 0.05 by PERMANOVA. The F statistic two-tailed p-value depicts the significance of the host factor in affecting the community structure, while the PERMANOVA statistic R2 depicts the fraction of variance explained by each factor.
Fig. 4
Fig. 4. Low diversity enterococcal-dominant AAD is associated with elevated ratios of tyramine to L-tyrosine.
a Dot plot of L-tyrosine abundance. b L-tyrosine AUC plot differentiating between -Ent AAD (n = 59) from +Ent AAD (n = 51) patients. c Dot plot of tyramine abundance. d Tyramine AUC plot differentiating between –Ent AAD (n = 59) from +Ent AAD (n = 51) patients. e Dot plot of tyramine/tyrosine ratios. f Tyramine/tyrosine ratios AUC plot differentiating between -Ent AAD (n = 59) from +Ent AAD (n = 51) patients. Data presented as mean ± SD in panels a, c and e for FMT donors (n = 20), -AAD (n = 23), -Ent AAD (n = 59) and +Ent AAD (n = 51) patients. Statistical significance was determined at p < 0.05 and comparisons used Kruskal-Wallis tests with FDR adjusted for multiple comparisons using the Benjamini and Hochberg method. Source data is provided as a Source Data file.
Fig. 5
Fig. 5. Non-antibiotic and non-enterococcal CDI metabolomes shared a reduction in sugars and amino acids compared to enterococcal CDI and non-CDI metabolomes.
a Heatmap of metabolite abundances detected by untargeted GC-MS profiling that differentiated FMT donors (n = 18), -AAD-CDI (n = 15), -AAD + CDI (n = 7), -Ent-CDI (n = 48), -Ent+CDI (n = 11), +Ent-CDI (n = 42) and +Ent+CDI (n = 9) patients. All metabolites were normalised, Pareto scaled, and log-transformed. Metabolites with VIP scores > 1.0 and p(corr) values > 0.5 and < −0.5 were identified as a subset of metabolites with the highest potential as biomarkers. For detailed VIP and p(corr) values, see Source Data file. Each cell corresponded to the mean abundance for each metabolite per group. Dark grey indicated the lowest and red the highest value. b PLS-DA scores plot for FMT donors (purple), -AAD-CDI (light blue), -AAD + CDI (dark blue), -Ent-CDI (red), -Ent+CDI (yellow), +Ent-CDI (green) and +Ent+CDI (orange) patients. Each point represented an individual specimen. Model cross-validation (R2Y = 0.244, Q2 = 0.057, p = 0.080 CV-ANOVA). See Source Data file for all model details. c Dot plot of acetate concentrations (µg per mg of fresh weight specimen (FW). d Dot plot of butyrate concentrations (µg per mg of fresh weight specimen (FW). SCFAs GC-MS profiling data are presented as mean ± SD in panels c and d for FMT donors (n = 20), -AAD-CDI (n = 21), -AAD + CDI (n = 6), -Ent-CDI (n = 56), -Ent+CDI (n = 10), +Ent-CDI (n = 49) and +Ent+CDI (n = 7) patients. In panels c and d, statistical significance was determined at p < 0.05 and comparisons used Kruskal-Wallis tests with FDR adjusted for multiple comparisons using the Benjamini and Hochberg method. Source data provided as a Source Data file.
Fig. 6
Fig. 6. Enterococcal CDI was associated by-products of L-proline Stickland fermentation.
a Dot plot of 5-aminovaleric acid abundance as detected by untargeted GC-MS profiling. b 5-aminovaleric acid AUC plot differentiating +Ent-CDI (n = 42) from +Ent+CDI (n = 9) patients. c Dot plot of 5-aminovaleric/L-proline ratios. d 5-aminovaleric acid/L-proline ratios AUC plot differentiating +Ent-CDI (n = 42) from +Ent+CDI (n = 9) patients. Data presented as mean ± SD in panels a and c for FMT donors (n = 18), -AAD-CDI (n = 15), -AAD + CDI (n = 7), -Ent-CDI (n = 48), -Ent+CDI (n = 11), +Ent-CDI (n = 42) and +Ent+CDI (n = 9) patients. In panels a and c, statistical significance was determined at p < 0.05 and comparisons used Kruskal-Wallis tests with FDR adjusted for multiple comparisons using the Benjamini and Hochberg method. Source data provided as a Source Data file.
Fig. 7
Fig. 7. Non-enterococcal CDI was associated with by-products of L-leucine and L-valine Stickland fermentation.
a Dot plot of 4-MPA abundance as detected by untargeted GC-MS profiling. b AUC plot of 4-MPA differentiating +Ent-CDI (n = 42) from +Ent+CDI (n = 9) patients. c Dot plot of 4-MPA/L-leucine ratios. d AUC plot of 4-MPA/L-leucine ratios differentiating +Ent-CDI (n = 42) from +Ent+CDI (n = 9) patients. e Dot plot of isovalerate concentrations as detected by SCFA GC-MS profiling. f Isovalerate AUC plot differentiating +Ent-CDI (n = 49) from +Ent+CDI (n = 7). g Dot plot of isobutyrate concentrations as detected by SCFA GC-MS profiling. h Isobutyrate AUC plot differentiating +Ent-CDI (n = 49) from +Ent+CDI (n = 7). Untargeted GC-MS profiling data is presented as mean ± SD in panels a and c for FMT donors (n = 18), -AAD-CDI (n = 15), -AAD + CDI (n = 7), -Ent-CDI (n = 48), -Ent+CDI (n = 11), +Ent-CDI (n = 42) and +Ent+CDI (n = 9) patients. SCFA GC-MS profiling data is presented as mean ± SD in panels e and g for FMT donors (n = 20), -AAD-CDI (n = 21), -AAD + CDI (n = 6), -Ent-CDI (n = 56), -Ent+CDI (n = 10), +Ent-CDI (n = 49) and +Ent+CDI (n = 7). In panels a, c, e and g, statistical significance was determined at p < 0.05 and comparisons used Kruskal-Wallis tests with FDR adjusted for multiple comparisons using the Benjamini and Hochberg method. Source data provided as a Source Data file.
Fig. 8
Fig. 8. Non-enterococcal CDI was associated with by-products of tyrosine Stickland fermentation.
a Dot plot of desaminotyrosine abundance. b Desaminotyrosine AUC plot differentiating -+Ent-CDI (n = 42) from +Ent+CDI (n = 9) patients. c Dot plot of desaminotyrosine/L-tyrosine ratios. d Desaminotyrosine/L-tyrosine ratios AUC plot differentiating +Ent-CDI (n = 42) from +Ent+CDI (n = 9) patients. Data presented as mean ± SD in panels a and c for FMT donors (n = 18), -AAD-CDI (n = 15), -AAD + CDI (n = 7), -Ent-CDI (n = 48), -Ent+CDI (n = 11), +Ent-CDI (n = 42) and +Ent+CDI (n = 9) patients. Statistical significance was determined at p < 0.05 and comparisons used Kruskal-Wallis tests with FDR adjusted for multiple comparisons using the Benjamini and Hochberg method. Source data provided as a Source Data file.

Similar articles

Cited by

References

    1. Mawer D, et al. Cross-sectional study of the prevalence, causes and management of hospital-onset diarrhoea. J. Hosp. Infect. 2019;103:200–209. doi: 10.1016/j.jhin.2019.05.001. - DOI - PubMed
    1. Turner NA, Saullo JL, Polage CR. Healthcare associated diarrhea, not Clostridioides difficile. Curr. Opin. Infect. Dis. 2020;33:319–326. doi: 10.1097/QCO.0000000000000653. - DOI - PubMed
    1. Vincent C, Manges AR. Antimicrobial use, human gut microbiota and Clostridium difficile colonization and infection. Antibiotics (Basel) 2015;4:230–253. doi: 10.3390/antibiotics4030230. - DOI - PMC - PubMed
    1. Smits WK, Lyras D, Lacy DB, Wilcox MH, Kuijper EJ. Clostridium difficile infection. Nat. Rev. Dis. Prim. 2016;2:e16020. doi: 10.1038/nrdp.2016.20. - DOI - PMC - PubMed
    1. Worth LJ, Spelman T, Bull AL, Brett JA, Richards MJ. Epidemiology of Clostridium difficile infections in Australia: enhanced surveillance to evaluate time trends and severity of illness in Victoria, 2010-2014. J. Hosp. Infect. 2016;93:280–285. doi: 10.1016/j.jhin.2016.03.014. - DOI - PubMed

Publication types