. 2023 Nov 25;14(1):7731.
doi: 10.1038/s41467-023-43417-6.

The rate of epigenetic drift scales with maximum lifespan across mammals

Affiliations

The rate of epigenetic drift scales with maximum lifespan across mammals

Emily M Bertucci-Richter et al. Nat Commun. .

Abstract

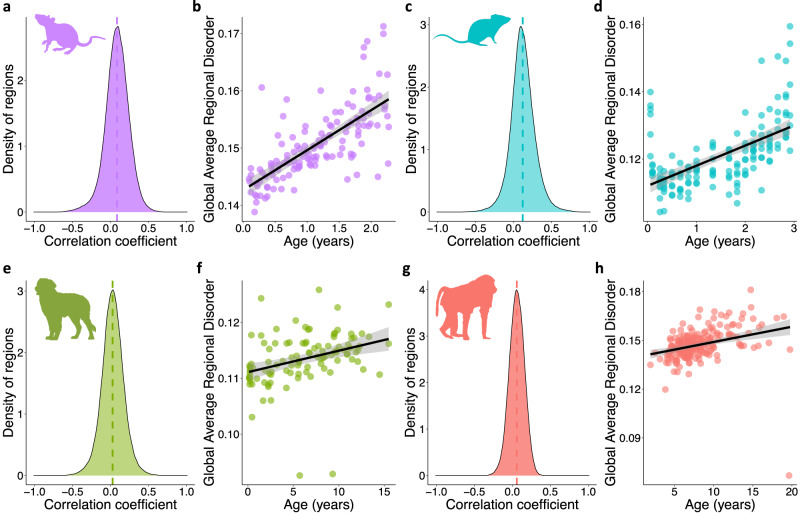
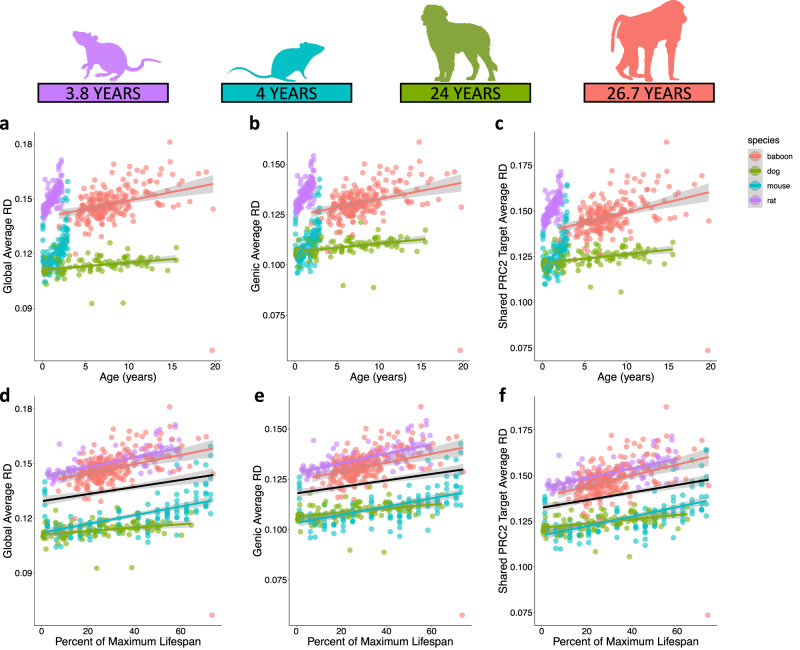
Epigenetic drift or "disorder" increases across the mouse lifespan and is suggested to underlie epigenetic clock signals. While the role of epigenetic drift in determining maximum lifespan across species has been debated, robust tests of this hypothesis are lacking. Here, we test if epigenetic disorder at various levels of genomic resolution explains maximum lifespan across four mammal species. We show that epigenetic disorder increases with age in all species and at all levels of genomic resolution tested. The rate of disorder accumulation occurs faster in shorter lived species and corresponds to species adjusted maximum lifespan. While the density of cytosine-phosphate-guanine dinucleotides ("CpGs") is negatively associated with the rate of age-associated disorder accumulation, it does not fully explain differences across species. Our findings support the hypothesis that the rate of epigenetic drift explains maximum lifespan and provide partial support for the hypothesis that CpG density buffers against epigenetic drift.


Conflict of interest statement

The authors declare no competing interests.

Figures

Fig. 1
Fig. 1. Age-associated disorder is a shared aspect of mammalian aging.
a Distribution of age-associated regional disorder across the rat genome (n = 134). b Global disorder of rats against chronological age in years (n = 134; lm ß = 0.0070, R2 = 0.51, F = 138.5, DF = 132, p < 2.2e−16). c Distribution of age-associated regional disorder across the mouse genome (n = 153). d Global disorder of mice against chronological age in years (n = 153; lm ß = 0.0060, R2 = 0.33, F = 76.06, DF = 151, p = 4.66e−15). e Distribution of age-associated regional disorder across the dog genome (n = 107). f Global disorder of dogs against chronological age in years (n = 107; lm ß = 0.00040, R2 = 0.11, F = 13.59, DF = 105, p = 0.00036). g Distribution of age-associated regional disorder across the baboon genome (n = 212). h Global disorder of baboons against chronological age in years (n = 212; lm ß = 0.00094, R2 = 0.090, F = 21.82, DF = 210, p = 5.35e−06). Species are shown by color: purple (rat), blue (mouse), green (dog), and pink (baboon). Dotted vertical lines in a, c, e, and g show the mean correlation coefficient per species. b, d, f, and h show a linear relationship with 95% confidence intervals (shaded) for age and global average regional disorder.
Fig. 2
Fig. 2. Epigenetic disorder scales with maximum lifespan.
a Global average disorder (lm R2 = 0.66, F = 299.1, DF = 601, p < 2.2e−16), b genic average disorder (lm R2 = 0.62, F = 246.2, DF = 601, p < 2.2e−16), and c shared PRC2 target average disorder across chronological age (lm R2 = 0.60, F = 225.1, DF = 601, p < 2.2e−16). d Global average disorder (lmm ß = 2.21e−04, SE = 1.74e−05, DF = 601.1, p < 2e−16), e genic average disorder (lmm ß = 1.95e−04, SE = 1.54e−05, DF = 601.1, p < 2e−16), and f shared PRC2 target (lmm ß = 2.42e−04, SE = 1.74e−05, DF = 601.1, p < 2e−16) average disorder scaled across percent of maximum lifespan. Overall linear relationship is shown in black. Shaded areas represent 95% confidence intervals. Species-specific linear relationships are indicated by color: purple (rat; n = 134), blue (mouse; n = 153), green (dog; n = 107), and pink (baboon; n = 212).
Fig. 3
Fig. 3. Age-associated disorder accumulates faster in shorter-lived species.
a Overlap of genes shared across species and genes with age-associated RD across species (bold). b Comparison of the rate of age-associated disorder (RD/year) of shared genes (n = 8440; ANOVA; F = 0.495, DF = 3, p < 2e−16). Comparison across species of the rate of age-associated disorder (RD/year) across regions of c EVX2 (n = 10–18 regions within EVX2; rat = 10, mouse = 15, dog = 17, baboon  = 18; ANOVA; F = 49.73, DF = 3, p = 8.4e−16) and d SMAD3 (n = 15–43 regions within SMAD3; rat = 16, mouse = 43, dog = 28, baboon = 15; ANOVA; F = 0.495, DF = 3, p = 0.69). Species are shown by color: purple (rat), blue (mouse), green (dog), and pink (baboon). For b, c, and d box plots center lines represent the median, box limits represent upper and lower interquartile ranges, and whiskers represent 1.5× interquartile range with all data points plotted.
Fig. 4
Fig. 4. Age-associated disorder occurs more slowly in regions with high CpG density.
a Comparison of CpG density in genes shared across species (n = 8440 genes; ANOVA; F = 407.9, DF = 3, p < 0.002). Diamonds show mean CpG density per species and violins represent density of data points. The relationship between CpG density and the rate of age-associated disorder accumulation (RD/year) in b all species (lm ß = −9.26e−04, R2 = 0.009, F = 314.8, DF = 33758, p < 2e−16) and c individual species (rat lm ß = −0.0013, R2 = 0.006, F = 50.24, DF = 8438, p = 1.47e−12; mouse lm ß = −0.0012, R2 = 0.01, F = 89.79, DF = 8438, p < 2e-16; dog lm ß = 1.28e−04, R2 = 0.005, F = 45.79, DF = 8438, p = 1.4e−11; baboon lm ß = −1.07e−04, R2 = 0.002, F = 14.81, DF = 8438, p = 0.00012). The relationship between the rate of age-associated disorder accumulation (RD/year) and log(CpG density) is shown in black. For b and c, only genes with positive slopes (RD/year) are plotted (n = 5407 genes). Species are shown by color: purple (rat), blue (mouse), green (dog), and pink (baboon). d Classification of shared genes according to their relationship between CpG density and maximum lifespan, and rate of age-associated disorder accumulation (RD/year) and maximum lifespan. Positive values indicate that longer-lived species have higher CpG density and a faster rate of age-associated RD, respectively. The number of genes in each quadrant is listed.

References

    1. Jones OR, et al. Diversity of ageing across the tree of life. Nature. 2014;505:169–173. doi: 10.1038/nature12789. - DOI - PMC - PubMed
    1. De MagalhÃes JP, Costa J. A database of vertebrate longevity records and their relation to other life-history traits. J. Evol. Biol. 2009;22:1770–1774. doi: 10.1111/j.1420-9101.2009.01783.x. - DOI - PubMed
    1. Hannum G, et al. Genome-wide methylation profiles reveal quantitative views of human aging rates. Mol. Cell. 2013;49:359–367. doi: 10.1016/j.molcel.2012.10.016. - DOI - PMC - PubMed
    1. Heyn H, et al. Distinct DNA methylomes of newborns and centenarians. Proc. Natl Acad. Sci. USA. 2012;109:10522–10527. doi: 10.1073/pnas.1120658109. - DOI - PMC - PubMed
    1. Bertucci EM, Parrott BB. Is CpG density the link between epigenetic aging and lifespan? Trends Genet. 2020;36:725–727. doi: 10.1016/j.tig.2020.06.003. - DOI - PubMed

Publication types