. 2023 Nov 25;6(1):1202.
doi: 10.1038/s42003-023-05583-7.

An immortal porcine preadipocyte cell strain for efficient production of cell-cultured fat

Affiliations

An immortal porcine preadipocyte cell strain for efficient production of cell-cultured fat

Yun-Mou Cheng et al. Commun Biol. .

Abstract

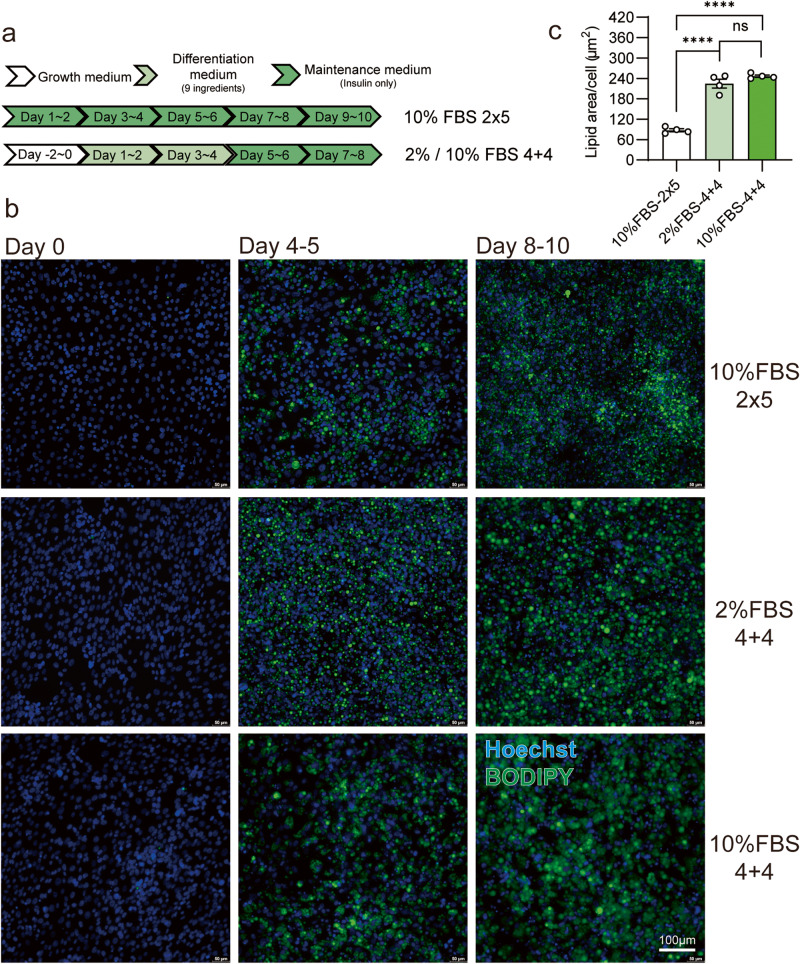
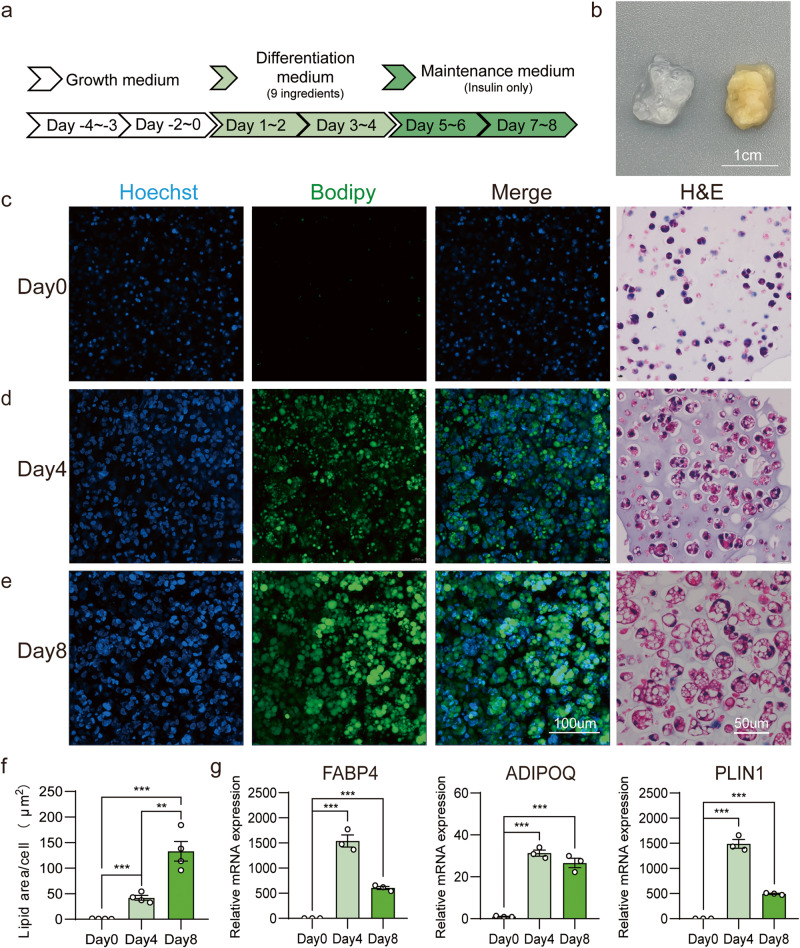
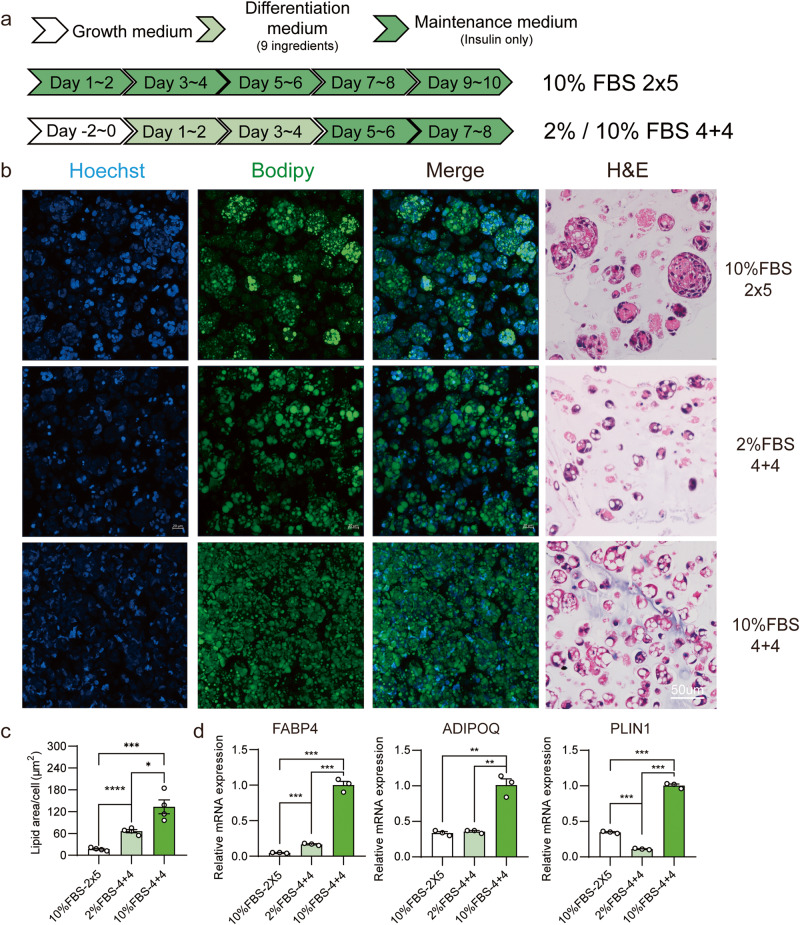
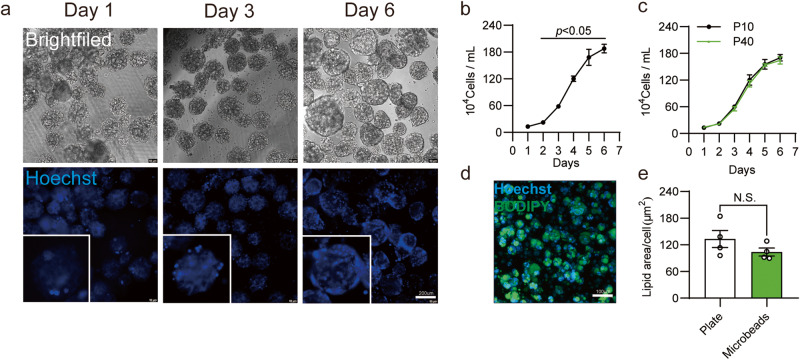
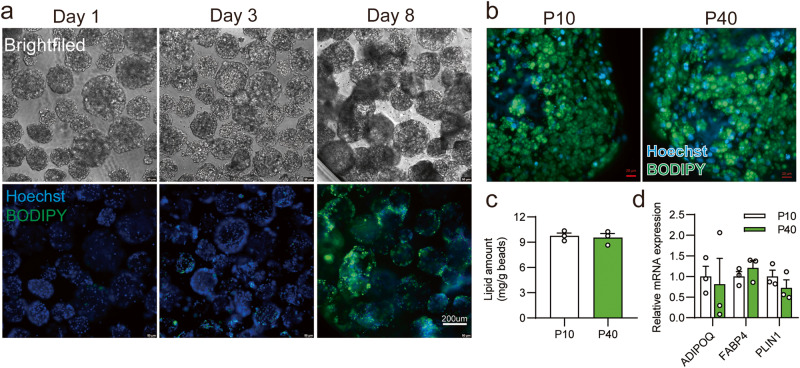
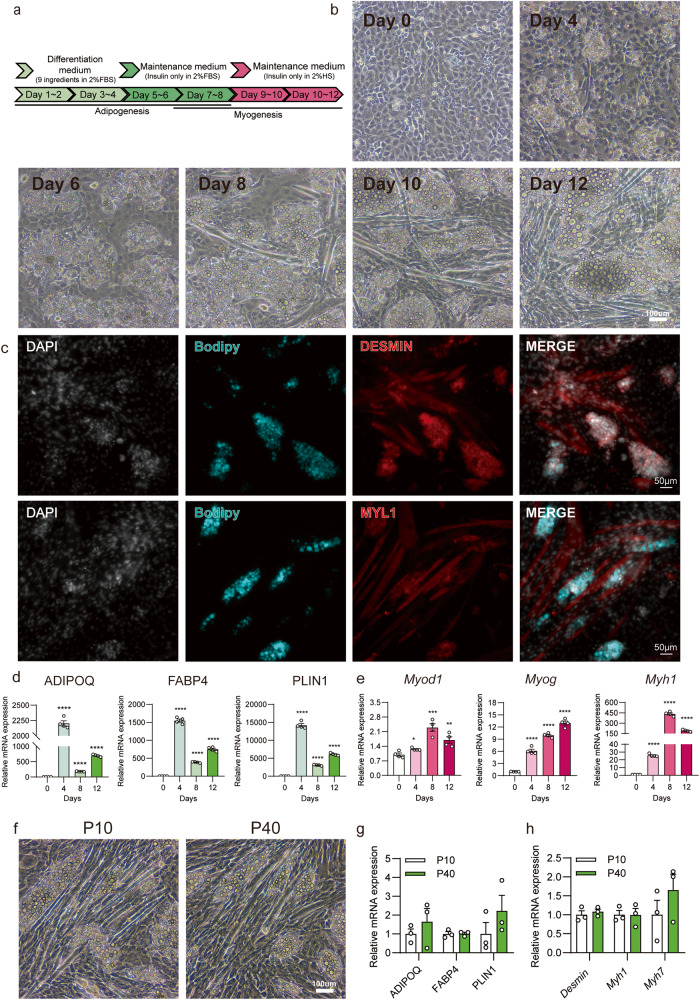
Adding adipose cells to cell-cultured meat can provide a distinctive aroma and juicy texture similar to real meat. However, a significant challenge still exists in obtaining seed cells that can be propagated for long periods, maintain their adipogenic potential, and reduce production costs. In this study, we present a cell strain derived from immortalized porcine preadipocytes that can be subculture for over 40 passages without losing differentiation capacity. This cell strain can be differentiated within 3D bioscaffolds to generate cell-cultured fat using fewer chemicals and less serum. Additionally, it can be expanded and differentiated on microcarriers with upscaled culture to reduce costs and labor. Moreover, it can co-differentiate with muscle precursor cells, producing a pattern similar to real meat. Therefore, our cell strain provides an exceptional model for studying and producing cell-cultured fat.


Conflict of interest statement

The authors declare no competing interests.

Figures

Fig. 1
Fig. 1. ISP-4 preserves adipogenic capability during long-term culture.
a Growth curves of ISP-4 at indicated passages (n = 3 biologically independent samples). b Representative fluorescent images of differentiated ISP-4 at indicated passages. Green = BODIPY, lipid, blue = Hoechst, nuclei. Scale bar = 200 µm. c The lipid content per cell was quantified by measuring the BODIPY and Hoechst fluorescence area in figure a, data were collected by ImageJ (n = 4 biologically independent samples). d The expression level of adipocyte-specific genes in ISP-4 at indicated passages on day 0, 4, 8 of adipogenic differentiation, measured by RT-qPCR and normalized against Day 0 (n = 4 biologically independent samples). e Oil-Red staining of differentiated ISP-4 at indicated passages. f Lipid contents in (e). were measured at 500 nm with a microplate reader (n = 4 biologically independent samples). g Immunoblotting against PLIN1 in differentiated ISP-4, GAPDH was used as loading control. All numerical values are presented as mean ± SEM; Two-tailed unpaired Student’s t-test p-values are indicated as: *P ≤ 0.05; **P ≤ 0.01; ***P ≤ 0.001.
Fig. 2
Fig. 2. Optimization of adipogenic methods for ISP-4 in 2D culture.
a Overview of workflow for adipogenic differentiation methods of ISP-4. b Representative fluorescent images of ISP-4 at indicated time point during adipogenic differentiation with different methods. Green = BODIPY, blue = Hoechst, scale bar = 100 µm. c The lipid content per cell was quantified by measuring the BODIPY and Hoechst fluorescence area in figure b, data were collected by ImageJ (n = 4 biologically independent samples). All numerical values are presented as mean ± SEM. Two-tailed unpaired Student’s t-test p-values are indicated as ***P  ≤  0.001, ****P  ≤  0.0001.
Fig. 3
Fig. 3. Adipogenic differentiation of ISP-4 in alginic hydrogels.
a Workflow overview: ISP-4 was embedded in alginic hydrogels, cultured in the growth medium for 4 days, and subsequently differentiated using a standard 4 + 4 protocol for adipogenesis. b Photographs of empty alginic hydrogel (left) and ISP-4 cultured fat (right) after differentiation, scale = 1 cm. ce Representative images of ISP-4 cultured fat at indicated days. Fluorescence images were taken by maximum intensity projection with confocal microscopy, green = BODIPY, blue = Hoechst, scale bar = 100 µm. Images of H&E staining were taken by a light microscope, scale bar = 50 µm. f The lipid content of cultured fat was quantified by measuring the BODIPY and Hoechst fluorescence area in figures (ce). Data were collected by ImageJ (n = 4 biologically independent samples). g Expression levels of adipose-specific genes in ISP-4 cultured fat at indicated days. Data were measured with RT-qPCR and normalized against Day0 (n = 3 biologically independent samples). All numerical values are presented as mean ± SEM. Two-tailed unpaired Student’s t-test p-values are indicated as **p ≤ 0.01, ***p ≤ 0.001, ****p ≤ 0.0001.
Fig. 4
Fig. 4. Adipogenesis differentiation of ISP-4 in alginate hydrogels using cost-effective and low-toxicity methods.
a Schematic representation of adipogenic methods for ISP-4 cultured in alginate hydrogels. b. Representative images of ISP-4 cultured fat with the indicated methods. Fluorescence images were captured using confocal microscopy with maximum intensity projection, green = BODIPY, blue = Hoechst, and scale bar = 100 µm. Light microscope images show H&E staining, and the scale bar = 50 µm. c The lipid content of the cultured fat in figure b was quantified by measuring the BODIPY and Hoechst fluorescence areas. Data were collected by ImageJ (n = 4 biologically independent samples). d Expression of adipose-specific genes for the samples presented in figure (b). RT-qPCR was used to measure the data (n = 3 biologically independent samples). All numerical values are expressed as mean ± SEM. Two-tailed unpaired student’s t-test p-values are indicated as **p ≤ 0.01, ***p ≤ 0.001, ****p ≤ 0.0001.
Fig. 5
Fig. 5. Proliferation of ISP-4 within upscale cultures.
a Representative images of ISP-4 cells on 3D TableTrix® microcarriers at indicated time points. Hoechst was used to stain the nuclei, and the enlarged images (lower left framed) show increasing spots on the microcarriers. Scale bar = 200 µm. b Growth curves of ISP-4 cultured on microcarriers. Cells were dissociated from microcarriers and counted with a hemocytometer (n = 3 biologically independent samples). c Growth curves of P10 and P40 ISP-4 cultured on microcarriers (n = 3 biologically independent samples). d Representative maximum intensity projection confocal image of alginic hydrogels with ISP-4 harvested from microcarriers. Adipogenesis was induced with the 4 + 4 protocol (10% FBS), and lipids were stained with BODIPY. Hoechst was used to stain the nuclei. Scale bar = 100 µm. e Quantification of lipid content in cultured fat with cells harvested from 2D culture or microcarriers. BODIPY and Hoechst fluorescence were measured using ImageJ from four independent samples (n = 4 biologically independent samples). All numerical values are presented as mean ± SEM. Two-tailed unpaired Student’s t-test p-values are indicated.
Fig. 6
Fig. 6. Adipogenic differentiation of ISP-4 on microcarriers within upscale cultures.
a Representative images of ISP-4 on microcarriers at indicated time points of adipogenic differentiation, scale bar = 200 µm. Lipid was stained with BODIPY, and nuclei with Hoechst, scale bar = 200 µm. b Representative images of adipogenic differentiated ISP-4 on microcarriers with a “4 + 4” protocol. Images were captured using confocal microscopy with maximum intensity projection. Scale bar = 20 µm. c Lipid contents for the samples form figure b (n = 3 biologically independent samples). d Expression of adipose-specific genes for the samples from figure (b). RT-qPCR was used to measure the data (n = 3 biologically independent samples). All numerical values are presented as mean ± SEM.
Fig. 7
Fig. 7. Co-differentiation of ISP-4 with myoblast cells.
a Workflow overview: ISP-4 was co-cultured with C2C12 cells and adipogenic differentiation was induced using a standard 4 + 4 protocol (2% FBS). Subsequently, myogenic differentiation was induced in DMEM with 2% HS for an additional 4 days. The medium was changed every 2 days. b Representative images of co-cultured ISP-4 and C2C12 cells at indicated time points after treatment. Notice the increasing number of lipid droplets and myotubes. Scale bar = 100 μm. c Representative fluorescence images of co-differentiated ISP-4 and C2C12 cells. The images were taken using confocal microscopy after immunofluorescence staining against either DESMIN or MYL1, nuclei with DAPI, and lipid droplets with BODIPY. Scale bar = 50 μm. d and e Expression of adipose-specific genes (d) and muscle-specific genes (e) for the samples presented in figure (b). The data were measured by RT-qPCR and normalized against day 0 (n = 4 biologically independent samples). f Representative images of co-cultured P10 and P40 ISP-4 and C2C12 cells after differentiation. Scale bar = 100 μm. g and h Expression of adipose-specific genes (g) and muscle-specific genes (h) for the samples presented in figure (f). The data were measured by RT-qPCR (n = 3 biologically independent samples). All numerical values are expressed as mean ± SEM. Two-tailed unpaired Student’s t-test p-values are indicated as **p ≤ 0.01, ***p ≤ 0.001, ****p ≤ 0.0001.

Similar articles

Cited by

References

    1. Eibl R, et al. Cellular agriculture: opportunities and challenges. Annu. Rev. Food Sci. Technol. 2021;12:51–73. doi: 10.1146/annurev-food-063020-123940. - DOI - PubMed
    1. Corbin CH, et al. Sensory evaluation of tender beef strip loin steaks of varying marbling levels and quality treatments. Meat Sci. 2015;100:24–31. doi: 10.1016/j.meatsci.2014.09.009. - DOI - PubMed
    1. Frank D, Joo ST, Warner R. Consumer acceptability of intramuscular fat. Korean J. Food Sci. Anim. Resour. 2016;36:699–708. doi: 10.5851/kosfa.2016.36.6.699. - DOI - PMC - PubMed
    1. Fernandez X, Mourot J, Lebret B, Gilbert S, Monin G. Influence of intramuscular fat content on lipid composition, sensory qualities and consumer acceptability of cured cooked ham. J. Sci. Food Agric. 2000;80:705–710. doi: 10.1002/(SICI)1097-0010(20000501)80:6<705::AID-JSFA592>3.0.CO;2-8. - DOI - PubMed
    1. Dreher J, Blach C, Terjung N, Gibis M, Weiss J. Formation and characterization of plant-based emulsified and crosslinked fat crystal networks to mimic animal fat tissue. J. Food Sci. 2020;85:421–431. doi: 10.1111/1750-3841.14993. - DOI - PubMed

Publication types