. 2024 Jan 11;52(1):e6.
doi: 10.1093/nar/gkad1091.

Quantification of all 12 canonical ribonucleotides by real-time fluorogenic in vitro transcription

Affiliations

Quantification of all 12 canonical ribonucleotides by real-time fluorogenic in vitro transcription

Janne Purhonen et al. Nucleic Acids Res. .

Abstract

Enzymatic methods to quantify deoxyribonucleoside triphosphates have existed for decades. In contrast, no general enzymatic method to quantify ribonucleoside triphosphates (rNTPs), which drive almost all cellular processes and serve as precursors of RNA, exists to date. ATP can be measured with an enzymatic luminometric method employing firefly luciferase, but the quantification of other ribonucleoside mono-, di-, and triphosphates is still a challenge for a non-specialized laboratory and practically impossible without chromatography equipment. To allow feasible quantification of ribonucleoside phosphates in any laboratory with typical molecular biology and biochemistry tools, we developed a robust microplate assay based on real-time detection of the Broccoli RNA aptamer during in vitro transcription. The assay employs the bacteriophage T7 and SP6 RNA polymerases, two oligonucleotide templates encoding the 49-nucleotide Broccoli aptamer, and a high-affinity fluorogenic aptamer-binding dye to quantify each of the four canonical rNTPs. The inclusion of nucleoside mono- and diphosphate kinases in the assay reactions enabled the quantification of the mono- and diphosphate counterparts. The assay is inherently specific and tolerates concentrated tissue and cell extracts. In summary, we describe the first chromatography-free method to quantify ATP, ADP, AMP, GTP, GDP, GMP, UTP, UDP, UMP, CTP, CDP and CMP in biological samples.


Figures

Graphical Abstract
Graphical Abstract
Figure 1.
Figure 1.
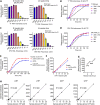
Broccoli aptamer, its fluorogenic ligand BI, and potassium acetate-supplemented buffer enable determination of rNTPs by quantitative in vitro transcription. (A, B) Comparison of Broccoli ligands (DFHBI-1T and BI) and buffer potassium concentration (enhancer of the aptamer folding) on real-time monitoring of in vitro transcription under limiting UTP concentrations with T7 RNA polymerase. (A) Representative fluorescence traces recorded during the in vitro transcription. (B) Standard curves generated from the baseline-subtracted end-point fluorescence values. The symbols and colors represent the same assay conditions as in (A). (C) Optimization of the template concentration. (D) Optimization of BI concentration. (E) Real-time detection of Broccoli-BI fluorescence during the assay reactions with T7 RNA polymerase, and (F) standard curves generated from the end-point fluorescence values. A linear regression line is shown for the linear part of the standard curve. (G) Real-time detection of Broccoli-BI fluorescence during the CTP and GTP assay reactions with SP6 RNA polymerase, and (H) the corresponding standard curves. The initial (0 to 5 min) drop in fluorescence is due to temperature-dependent properties BI (see main text and Supplementary Figure S1I). (I) Assay conditions in graphs A to H. The signal-to-noise ratio was defined as background-subtracted fluorescence divided by the standard deviation of the background (n = 7 replicates).
Figure 2.
Figure 2.
Optimization of in vitro transcription for quantification of rNTPs. (AB) Optimization of T7 RNA polymerase concentration with UTP as the limiting nucleotide. (C, D) Optimization of SP6 RNA polymerase concentration with CTP as the limiting nucleotide. (EF) Comparison of a double-stranded single-stranded hybrid template and the fully double-stranded equivalent with T7 RNA polymerase. (G) Reaction volume and variation of technical replicates (T7 RNA polymerase and 6.25 μM UTP). CV, coefficient of variation. (H) Linearization of the standard curves by the addition of low basal concentrations of the limiting nucleotide. The basal limiting nucleotide concentrations were 1 μM for the quantification of ATP, UTP, CTP and 2 μM for the quantification of GTP. The standard curves were generated without technical replicates.
Figure 3.
Figure 3.
Dimeric Broccoli enhances sensitivity and resolution of the rNTP quantification. (A) Signal amplification with stabilized dimeric Broccoli. UTP quantification reactions were performed in a qPCR instrument, and the rest of the reactions in a plate reader. (B) Representative fluorescence traces of ATP quantification reactions with templates encoding monomeric or dimeric Broccoli. (C) Similar experiment as in (B) but with GTP instead of ATP as the limiting nucleotide. Stable plateau phases are marked with black bars for the GTP quantification reactions. (D) Evaluation of assay resolution by quantification of 3–4% differences in limiting rNTP concentration. The symbols represent the mean value of three replicates. The error bars represent SEM. Where error bars are not visible, they are smaller than the symbols. *P< 0.05 for adjacent concentrations (Fisher's LSD, one-sided P value).
Figure 4.
Figure 4.
Quantification of rNMPs and rNDPs. (A) Quantification of the indicated rNDP and rNTP combinations by inclusion of nucleoside diphosphate kinase in the assay reactions. (B) Representative fluorescence traces of assay reactions containing nucleoside diphosphate kinase and either rNTP or rNDP as a limiting nucleotide. (C) Quantification of the indicated rNMP and rNTP combinations by inclusion of nucleoside diphosphate kinase and rNMP kinases in the assay reactions. (D) Representative fluorescence traces of assay reactions containing nucleoside diphosphate kinase and rNMP kinase and either an rNTP or rNMP as the limiting nucleotide. Supplementary Figure S2 shows the indispensability of the added kinases for signal generation from rNMPs and rNDPs.
Figure 5.
Figure 5.
Quantification of rNTPs from mouse liver. (A) Estimation of sample-related interference by a dilution series. The input refers to the polar metabolite extract worth of initial tissue mass. The reaction volumes were 4 μl (1 μl sample + 3 μl assay reagent). The data points are technical replicates from four pooled liver extracts. (BE) Recovery of exogenous rNMPs, rNDPs, and rNTPs spiked into liver extracts. The purified nucleotides were added as mixtures comprising 2000 pmol adenosine nucleotides (AMP, ADP or ATP), 200 pmol uridine nucleotides (UMP, UDP or UTP), 200 pmol guanosine nucleotides (GMP, GDP or GTP), and 50 pmol cytidine nucleotides (CMP, CDP or CTP) per mg tissue. Sample inputs (relative to pre-extraction tissue weight) were the following: 11.25 μg for ATP, 112.5 μg for GTP and UTP, and 450 μg for CTP. The reaction volumes were 10 μl (5 μl sample + 5 μl assay reagent). The bar graphs represent mean and SEM from 4 independent liver extracts.
Figure 6.
Figure 6.
Effect of warm ischemia on hepatic ribonucleotide pools. (A–C) Quantification of adenylate nucleotides. (D) Adenylate energy charge defined as (ATP + 0.5ADP)/(ATP + ADP + AMP). (E) Total adenylate nucleotides (ATP + ADP + AMP). (FJ) Quantification of guanosine nucleotides and GTP/GDP ratio. (KO) Quantification of uridine nucleotides and UTP/UDP ratio. (PT) Quantification of cytidine nucleotides and CTP/CDP ratio. The data points represent mean and SD from four non-fasted male mice of 2 months of age. Where error bars are not visible, the SD was smaller than the size of the symbol. Supplementary Figure S4 shows data from a similar experiment in which the extracts were prepared as described in the Supplementary methods (no boiling step).
Figure 7.
Figure 7.
rNTP levels and adenylate energy charge after inhibition of oxidative phosphorylation in cultured mammalian cells. (A) Data from the AML12 mouse hepatocyte line. (B) Data from the Hepa1–6 mouse hepatoma cell line. The inhibitor concentrations were: 100 nM rotenone, 100 nM myxothiazol, 1 μM oligomycin A, and 5 μM FCCP. These inhibitors target mitochondrial NADH dehydrogenase (complex I), cytochrome bc1 complex (complex III), ATP synthase, and mitochondrial membrane potential, respectively. The data points represent individual cell culture dishes and the error bars SD. *, two-sided P value < 0.002 (versus control, one-way ANOVA and Dunnett's test or t-test).
Figure 8.
Figure 8.
Comparison of the fluorogenic in vitro transcription rNTP assay against luciferin-luciferase ATP assay and HPLC. (A) Correlation between mouse liver ATP levels as determined by the novel RNA polymerase-based method and a luciferin-luciferase ATP assay. The samples derive from the mouse liver ischemia experiment presented in Supplementary Figure S4. (BE) Correlation plots of mouse liver nucleotide levels determined by the novel enzymatic method and HPLC. In these comparisons, the samples derive from the liver ischemia experiment shown in Figure 6. The same rNTP standards were used in both methods. In the enzymatic method, rNMP and rNDP levels were quantified indirectly (Materials and Methods) using rNTP standards. In HPLC, separate rNMP and rNDP standards were used. (FR) Relative changes in hepatic nucleotide levels and adenylate energy charge during ischemia as determined by the enzymatic assay (red symbols) and HPLC (blue symbols). The error bars represent SD from four non-fasted male mice of 2 month of age.

Similar articles

Cited by

References

    1. Chandel N.S. Nucleotide metabolism. Cold Spring Harb. Perspect. Biol. 2021; 13:a040592. - PMC - PubMed
    1. Traut T.W. Physiological concentrations of purines and pyrimidines. Mol. Cell. Biochem. 1994; 140:1–22. - PubMed
    1. Zhu B., Wei H., Wang Q., Li F., Dai J., Yan C., Cheng Y.. A simultaneously quantitative method to profiling twenty endogenous nucleosides and nucleotides in cancer cells using UHPLC-MS/MS. Talanta. 2018; 179:615–623. - PubMed
    1. Zborníková E., Knejzlík Z., Hauryliuk V., Krásný L., Rejman D. Analysis of nucleotide pools in bacteria using HPLC-MS in HILIC mode. Talanta. 2019; 205:120161. - PubMed
    1. Kong Z., Jia S., Chabes A.L., Appelblad P., Lundmark R., Moritz T., Chabes A.. Simultaneous determination of ribonucleoside and deoxyribonucleoside triphosphates in biological samples by hydrophilic interaction liquid chromatography coupled with tandem mass spectrometry. Nucleic Acids Res. 2018; 46:e66. - PMC - PubMed