. 2023 Nov 26;15(1):100.
doi: 10.1186/s13073-023-01259-3.

GITR and TIGIT immunotherapy provokes divergent multicellular responses in the tumor microenvironment of gastrointestinal cancers

Affiliations

GITR and TIGIT immunotherapy provokes divergent multicellular responses in the tumor microenvironment of gastrointestinal cancers

Anuja Sathe et al. Genome Med. .

Abstract

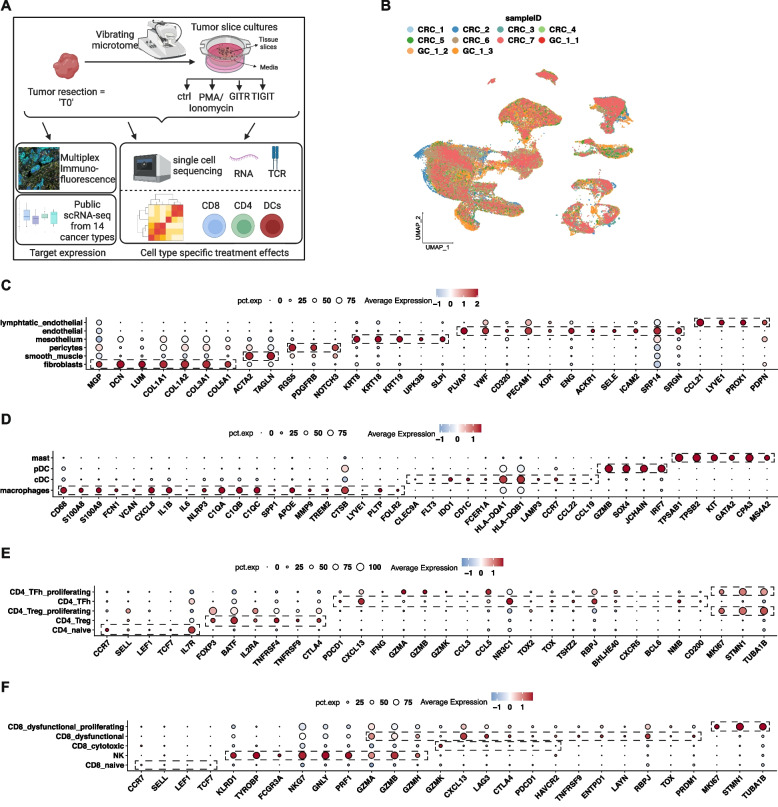
Background: Understanding the mechanistic effects of novel immunotherapy agents is critical to improving their successful clinical translation. These effects need to be studied in preclinical models that maintain the heterogenous tumor microenvironment (TME) and dysfunctional cell states found in a patient's tumor. We investigated immunotherapy perturbations targeting co-stimulatory molecule GITR and co-inhibitory immune checkpoint TIGIT in a patient-derived ex vivo system that maintains the TME in its near-native state. Leveraging single-cell genomics, we identified cell type-specific transcriptional reprogramming in response to immunotherapy perturbations.

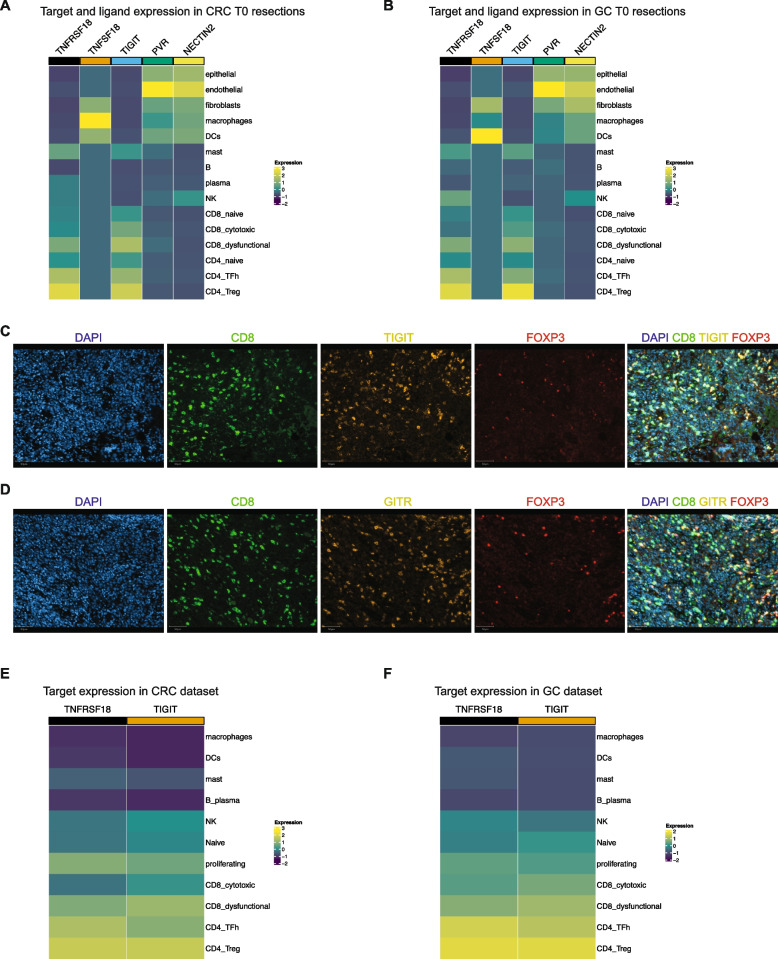
Methods: We generated ex vivo tumor slice cultures from fresh surgical resections of gastric and colon cancer and treated them with GITR agonist or TIGIT antagonist antibodies. We applied paired single-cell RNA and TCR sequencing to the original surgical resections, control, and treated ex vivo tumor slice cultures. We additionally confirmed target expression using multiplex immunofluorescence and validated our findings with RNA in situ hybridization.

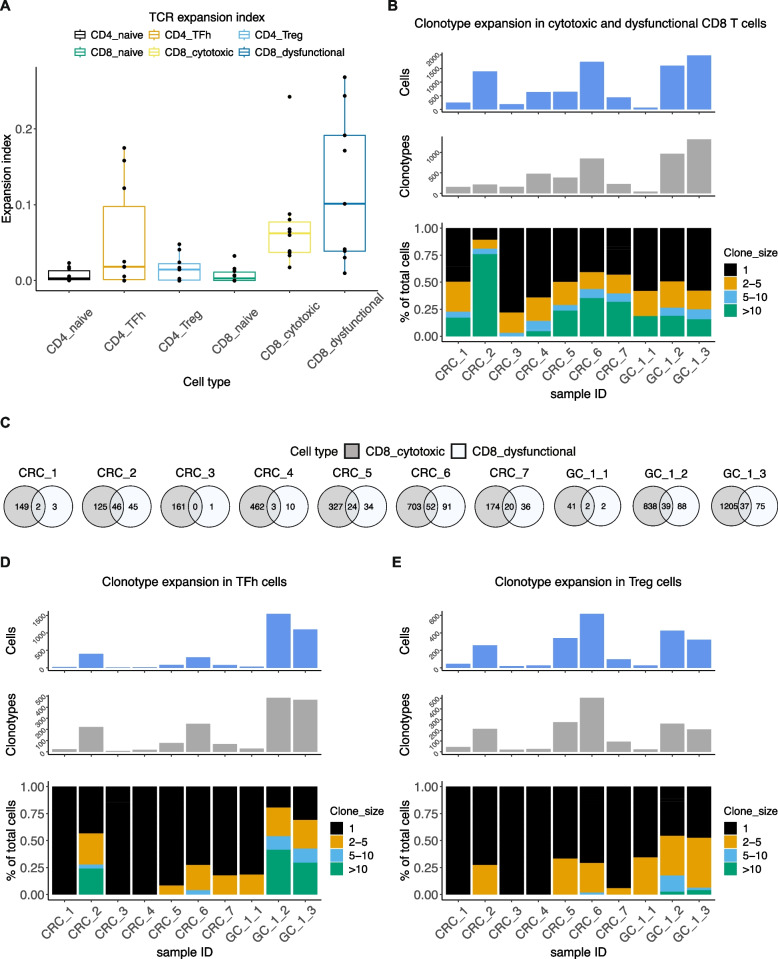
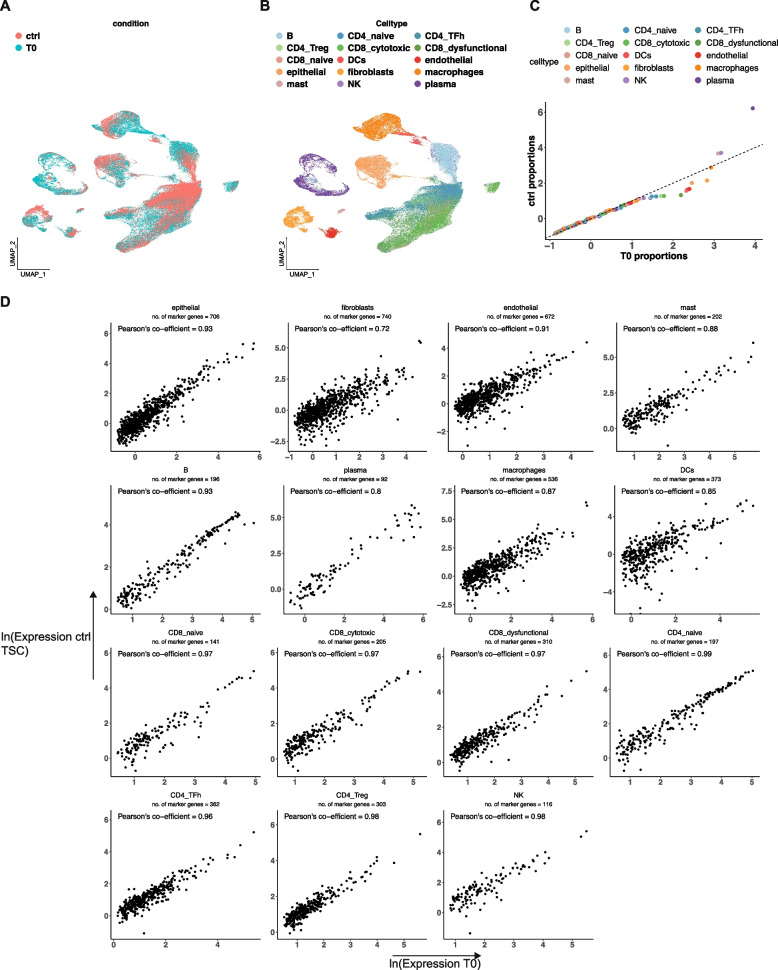
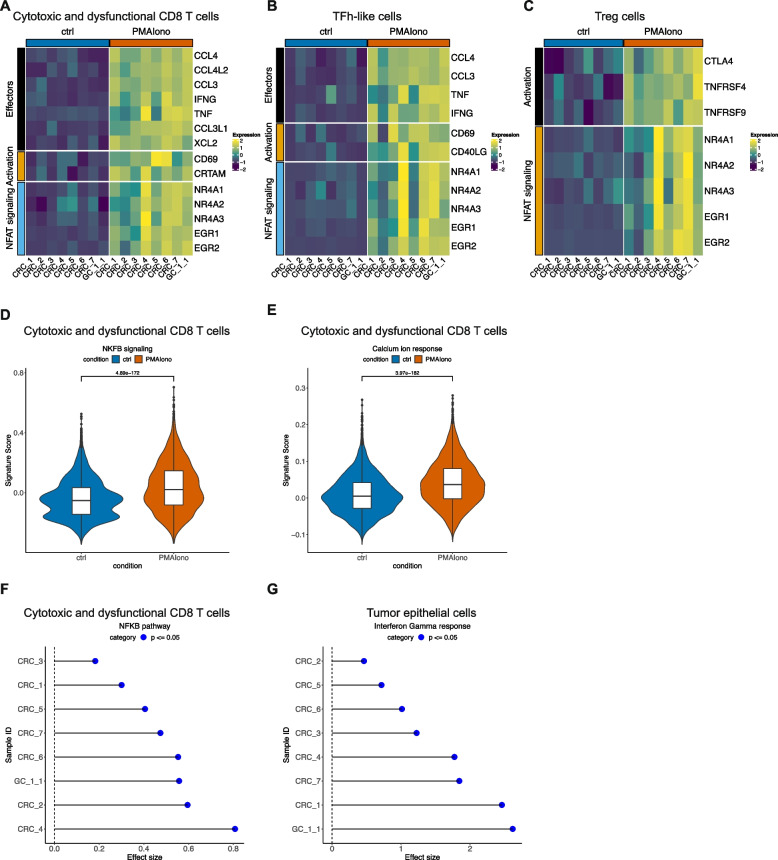
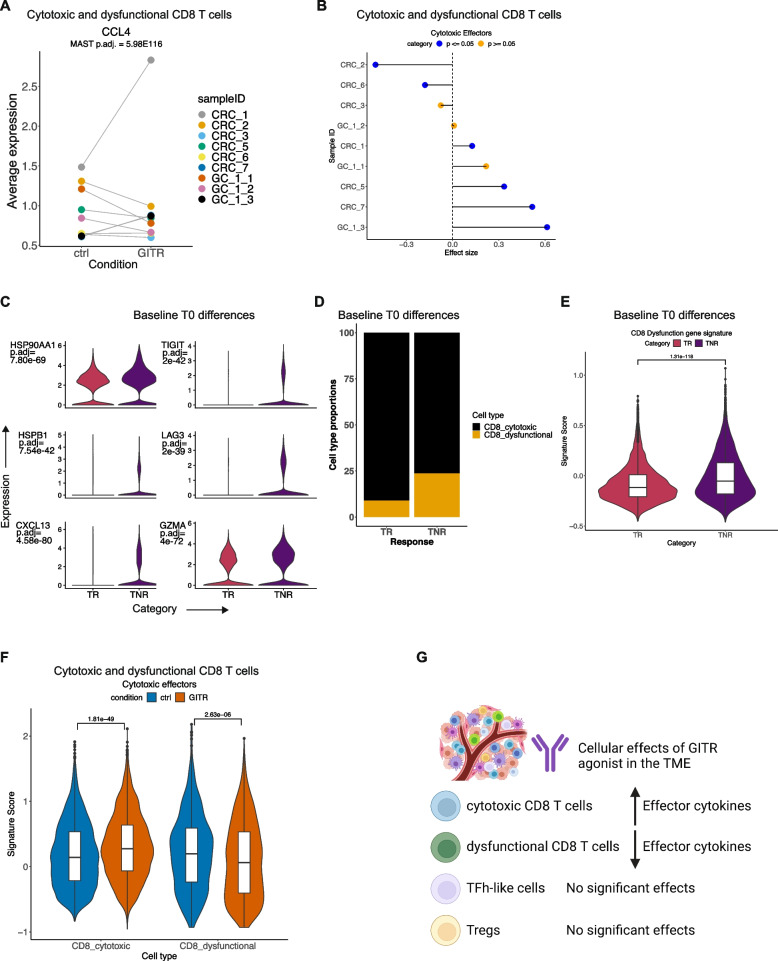
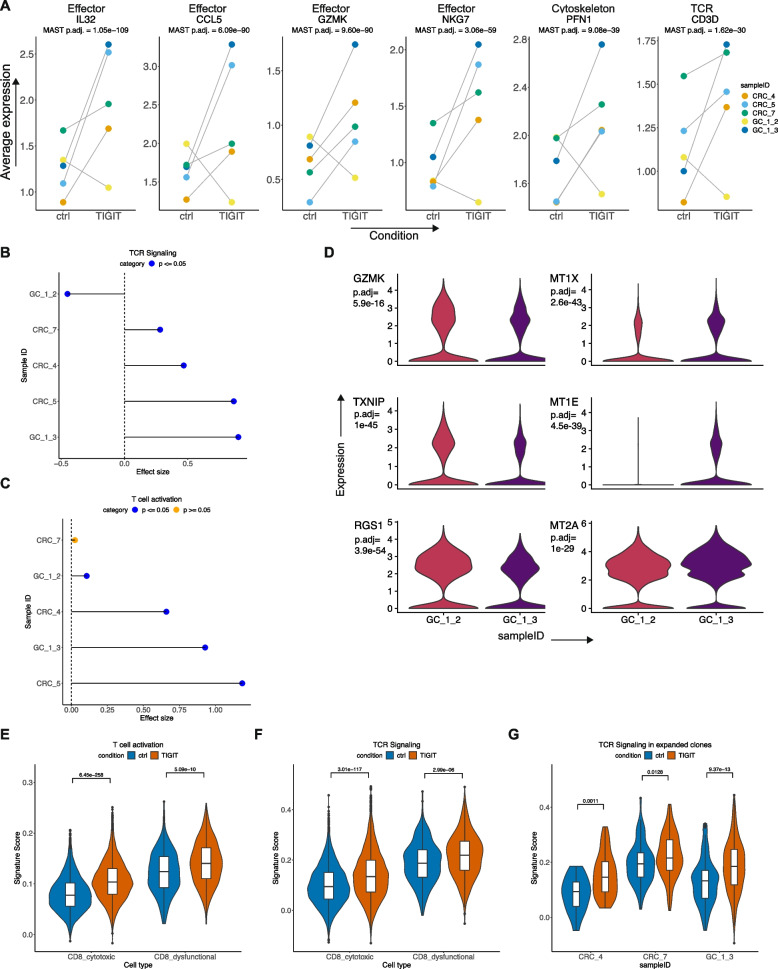
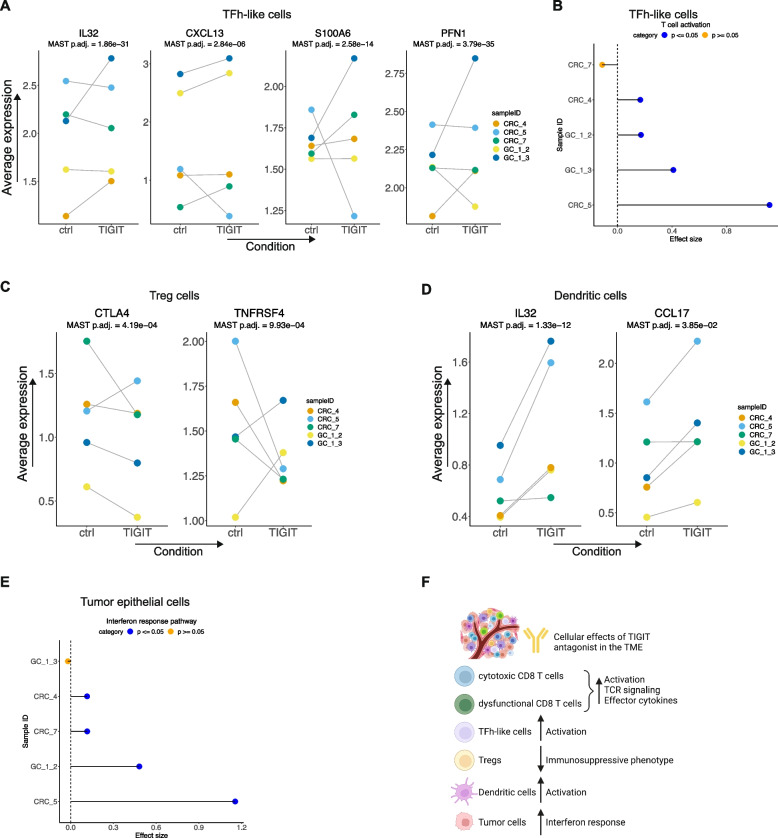
Results: We confirmed that tumor slice cultures maintained the cell types, transcriptional cell states and proportions of the original surgical resection. The GITR agonist was limited to increasing effector gene expression only in cytotoxic CD8 T cells. Dysfunctional exhausted CD8 T cells did not respond to GITR agonist. In contrast, the TIGIT antagonist increased TCR signaling and activated both cytotoxic and dysfunctional CD8 T cells. This included cells corresponding to TCR clonotypes with features indicative of potential tumor antigen reactivity. The TIGIT antagonist also activated T follicular helper-like cells and dendritic cells, and reduced markers of immunosuppression in regulatory T cells.

Conclusions: We identified novel cellular mechanisms of action of GITR and TIGIT immunotherapy in the patients' TME. Unlike the GITR agonist that generated a limited transcriptional response, TIGIT antagonist orchestrated a multicellular response involving CD8 T cells, T follicular helper-like cells, dendritic cells, and regulatory T cells. Our experimental strategy combining single-cell genomics with preclinical models can successfully identify mechanisms of action of novel immunotherapy agents. Understanding the cellular and transcriptional mechanisms of response or resistance will aid in prioritization of targets and their clinical translation.

Keywords: Colon cancer; GITR; Gastric cancer; TIGIT; Tumor microenvironment; scRNA-seq.


Conflict of interest statement

The authors declare that they have no competing interests.

Figures

Fig. 1
Fig. 1
A Schematic representation of study design. B UMAP representation of dimensionally reduced data following batch-corrected graph-based clustering of all datasets colored by samples. CF Dot plot depicting average expression levels of specific lineage-based marker genes together with the percentage of cells expressing the marker in C stromal, D myeloid, and E, F lymphocytes
Fig. 2
Fig. 2
A TCR expansion index for respective cell types. B Frequencies of clonotypes in CD8 T cells from respective patients together with absolute number of cells and clonotypes examined. C Overlap between TCR clonotypes in cytotoxic and dysfunctional CD8 T cells from respective patients. D, E Frequencies of clonotypes in D TFh-like and E Treg cells from respective patients together with absolute number of cells and clonotypes examined
Fig. 3
Fig. 3
A, B Scaled average expression of respective genes in various cell types from A all CRC T0 resections and B all GC T0 resections. CD Immunofluorescence staining for respective proteins or their merged image in an example region of interest from sample CRC-2. Scale bar = 50 μm. EF Scaled expression of respective genes in various cell types from E CRCs in the publicly available tumor immune atlas dataset and F our previously published GC dataset
Fig. 4
Fig. 4
A, B UMAP representation of dimensionally reduced data from T0 and 24 h ctrl TSCs following batch-corrected graph-based clustering of all datasets colored by A experimental condition and B cell type. C Quantile-quantile plot comparing the proportion distributions of respective cell lineages across all T0 and ctrl TSCs. D Scatter plot indicating average log expression of marker genes for T0 cell lineages in T0 and ctrl TSC in respective cell lineage, annotated with the number of marker genes examined. Pearson’s co-efficient was calculated using non-log transformed values
Fig. 5
Fig. 5
AC Scaled average expression of respective genes in control or PMA/Ionomycin-treated samples in A CD8 T cells, B TFh-like cells, and C Treg cells. D, E Respective pathway activity in control and treated CD8 T cells with T-test p. F, G Cohen’s effect size and p of t-test comparison of respective pathway activity between control and treated cells from each individual sample
Fig. 6
Fig. 6
A Average expression of CCL4 in each sample in control and treated CD8 T cells with MAST DE adjusted p. B Cohen’s effect size and p of t-test comparison of cytotoxic effector pathway activity between control and treated CD8 T cells from each individual sample. C Expression of respective genes in cells from TR or TNR baseline T0 samples with Seurat Wilcoxon adjusted p. D Proportions of CD8 T cell subtypes in baselineT0 samples corresponding to transcriptional responders (TR) or non-responders (TNR). E Expression of gene signature of CD8 T cell dysfunction in TR and TNR with t-test p. F Cytotoxic effector pathway activity in control and treated cytotoxic and dysfunctional CD8 T cells with t-test p. G Schematic representation summarizing the ex vivo effects of GITR agonist in the TME
Fig. 7
Fig. 7
A Average expression of respective genes in each sample in control or TIGIT inhibitor-treated CD8 T cells with MAST DE adjusted p. B, C Cohen’s effect size and p of t-test comparison of respective pathway activity between control and treated cells from each individual sample. D Violin plots depicting the expression of respective genes in CD8 T cells from GC-1-2 and GC-1-3 samples with Seurat Wilcoxon adjusted p. EG Respective pathway activity in control and treated CD8 T cells with t-test p in E, F CD8 T cell subtypes and G baseline expanded CD8 TCR clonotypes per sample
Fig. 8
Fig. 8
A Average expression of respective genes in each sample in control or TIGIT inhibitor-treated TFh-like cells with MAST DE adjusted p. B Cohen’s effect size and p of t-test comparison of pathway activity between control and treated TFh-like cells from each individual sample. C, D Average expression of respective genes in each sample in control or TIGIT inhibitor-treated C Treg cells and D DCs with MAST DE adjusted p. E Cohen’s effect size and p of t-test comparison of pathway activity between control and treated tumor epithelial cells from each individual sample. F Schematic representation summarizing the ex vivo effects of TIGIT antagonist in the TME

Update of

Similar articles

Cited by

References

    1. Ho WW, Pittet MJ, Fukumura D, Jain RK. The local microenvironment matters in preclinical basic and translational studies of cancer immunology and immunotherapy. Cancer Cell. 2022;40(7):701–702. doi: 10.1016/j.ccell.2022.05.016. - DOI - PMC - PubMed
    1. van der Leun AM, Thommen DS, Schumacher TN. CD8(+) T cell states in human cancer: insights from single-cell analysis. Nat Rev Cancer. 2020;20(4):218–232. doi: 10.1038/s41568-019-0235-4. - DOI - PMC - PubMed
    1. Voabil P, de Bruijn M, Roelofsen LM, Hendriks SH, Brokamp S, van den Braber M, et al. An ex vivo tumor fragment platform to dissect response to PD-1 blockade in cancer. Nat Med. 2021;27(7):1250–1261. doi: 10.1038/s41591-021-01398-3. - DOI - PubMed
    1. Jiang X, Seo YD, Sullivan KM, Pillarisetty VG. Establishment of slice cultures as a tool to study the cancer immune microenvironment. Methods Mol Biol. 2019;1884:283–295. doi: 10.1007/978-1-4939-8885-3_20. - DOI - PubMed
    1. Kenerson HL, Sullivan KM, Labadie KP, Pillarisetty VG, Yeung RS. Protocol for tissue slice cultures from human solid tumors to study therapeutic response. STAR Protoc. 2021;2(2):100574. doi: 10.1016/j.xpro.2021.100574. - DOI - PMC - PubMed

Publication types