. 2023 Nov 27;11(1):266.
doi: 10.1186/s40168-023-01680-1.

Vitamin D modulation of brain-gut-virome disorder caused by polystyrene nanoplastics exposure in zebrafish (Danio rerio)

Affiliations

Vitamin D modulation of brain-gut-virome disorder caused by polystyrene nanoplastics exposure in zebrafish (Danio rerio)

Miaomiao Teng et al. Microbiome. .

Abstract

Background: Many studies have investigated how nanoplastics (NPs) exposure mediates nerve and intestinal toxicity through a dysregulated brain-gut axis interaction, but there are few studies aimed at alleviating those effects. To determine whether and how vitamin D can impact that toxicity, fish were supplemented with a vitamin D-low diet and vitamin D-high diet.

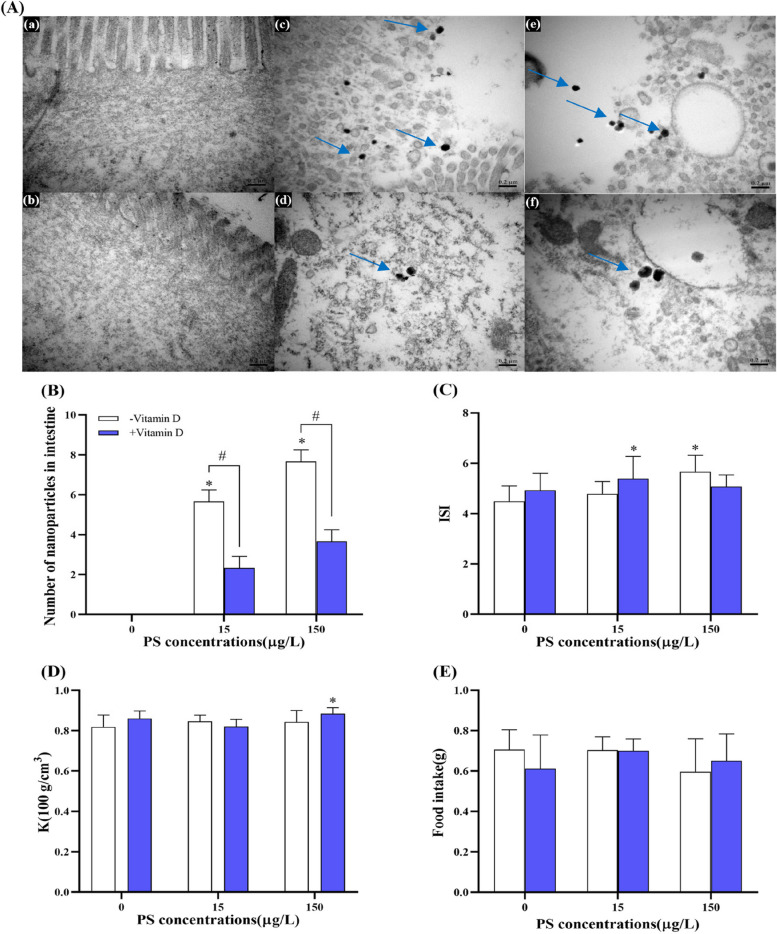
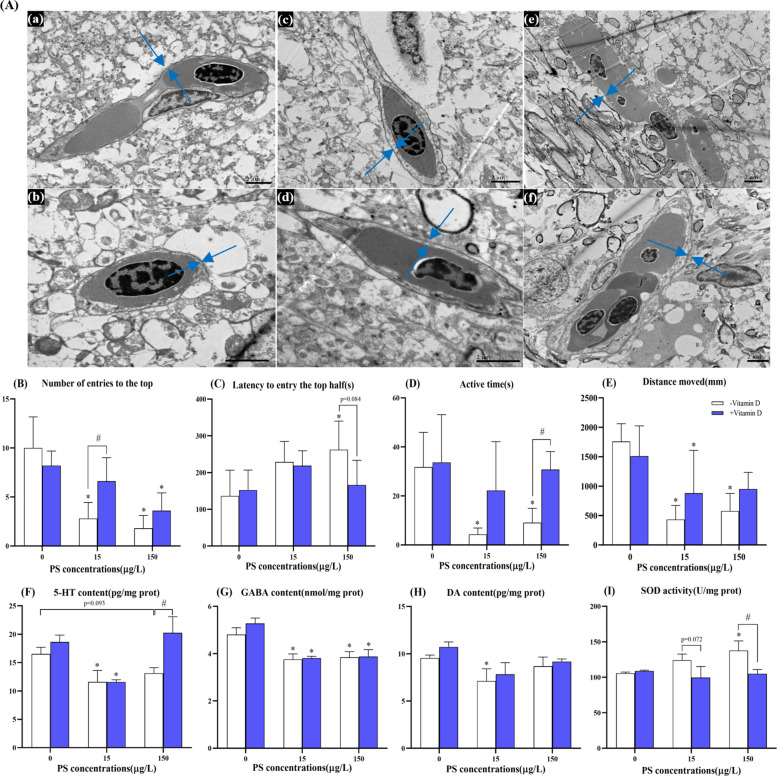
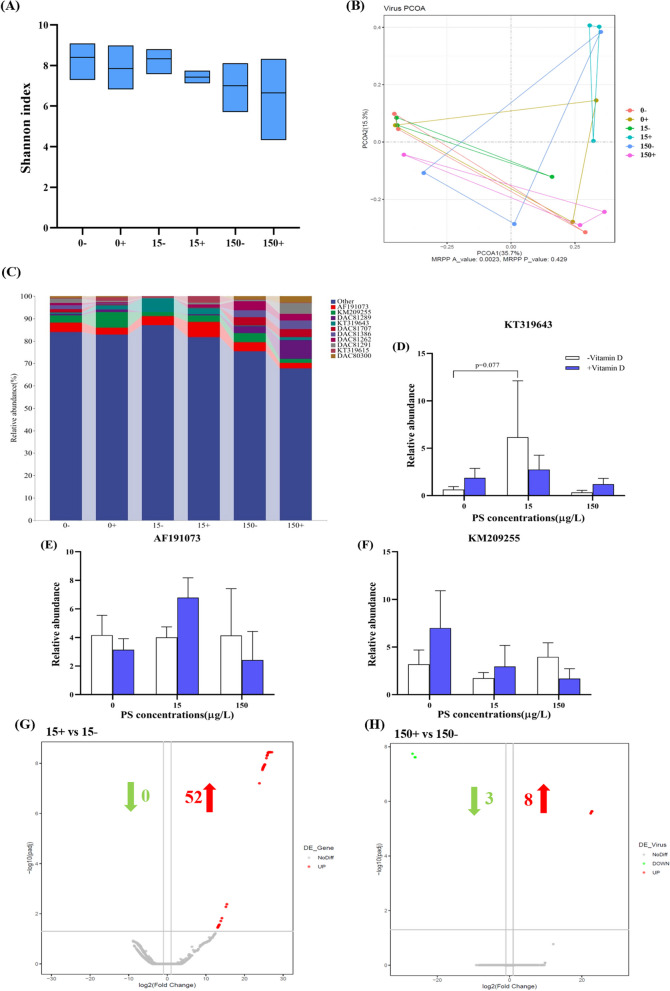
Results: Transmission electron microscopy (TEM) showed that polystyrene nanoplastics (PS-NPs) accumulated in zebrafish brain and intestine, resulting in brain blood-brain barrier basement membrane damage and the vacuolization of intestinal goblet cells and mitochondria. A high concentration of vitamin D reduced the accumulation of PS-NPs in zebrafish brain tissues by 20% and intestinal tissues by 58.8% and 52.2%, respectively, and alleviated the pathological damage induced by PS-NPs. Adequate vitamin D significantly increased the content of serotonin (5-HT) and reduced the anxiety-like behavior of zebrafish caused by PS-NPs exposure. Virus metagenome showed that PS-NPs exposure affected the composition and abundance of zebrafish intestinal viruses. Differentially expressed viruses in the vitamin D-low and vitamin D-high group affected the secretion of brain neurotransmitters in zebrafish. Virus AF191073 was negatively correlated with neurotransmitter 5-HT, whereas KT319643 was positively correlated with malondialdehyde (MDA) content and the expression of cytochrome 1a1 (cyp1a1) and cytochrome 1b1 (cyp1b1) in the intestine. This suggests that AF191073 and KT319643 may be key viruses that mediate the vitamin D reduction in neurotoxicity and immunotoxicity induced by PS-NPs.

Conclusion: Vitamin D can alleviate neurotoxicity and immunotoxicity induced by PS-NPs exposure by directionally altering the gut virome. These findings highlight the potential of vitamin D to alleviate the brain-gut-virome disorder caused by PS-NPs exposure and suggest potential therapeutic strategies to reduce the risk of NPs toxicity in aquaculture, that is, adding adequate vitamin D to diet. Video Abstract.

Keywords: Brain; Polystyrene nanoplastics; Viruses; Vitamin D; Zebrafish.


Conflict of interest statement

The authors declare no competing interests.

Figures

Fig. 1
Fig. 1
Accumulation of PS-NPs in the intestinal tissues of zebrafish and changes in related growth parameters. A Transmission electron microscopy (TEM) observation of PS-NPs in intestinal tissue (0.2 μm), a, b, c, d, e, and f represent the group of 0 − , 0 + , 15 − , 15 + , 150 − , and 150 + , respectively; the blue arrow points to the NPs. B The number of NPs in intestine tissue (n = 3 replicates). C ISI (%). D K (100 g/cm3). E FI (g). Data are expressed as means ± standard deviation (SD). *p < 0.05 indicate significant differences between exposure groups and the control group; #p < 0.05 indicate significant differences between vitamin D-high and vitamin D-low groups at the same PS-NPs concentration
Fig. 2
Fig. 2
Representative histological changes of brain tissue samples and changes of related parameters. A TEM of the blood–brain barrier (2 μm), a, b, c, d, e, and f represent the group of 0 − , 0 + , 15 − , 15 + , 150 − , and 150 + , respectively. The blue arrow represents the basement membrane of the blood–brain barrier. B The number of entries to the top. C Latency to entry the top half. D Active time. E Distance moved. F, G, and H represent the content of 5-HT, GABA, and DA in zebrafish brain samples. I The activity of SOD in zebrafish intestinal samples. Data are expressed as means ± SD. *p < 0.05 indicate significant differences between exposure groups and the control group. #p < 0.05 indicate significant differences between vitamin D-high and vitamin D-low groups at the same PS-NPs concentration
Fig. 3
Fig. 3
Representative histological changes of intestinal samples and changes of related parameters. A TEM of goblet cells (2 μm). B TEM of mitochondria (1 μm). a, b, c, d, e, and f represent the group of 0 − , 0 + , 15 − , 15 + , 150 − , and 150 + , respectively. The blue arrow represents the cytoplasmic matrix vacuolization, and the red arrow represents the mitochondrial vacuole. C The activity of SOD in zebrafish intestinal samples. D The content of MDA in zebrafish intestinal samples. E The content of IgM in zebrafish intestinal samples. F The activity of DAO in zebrafish intestinal samples. G The content of D-LA in zebrafish serum samples. H Expression of genes related to intestinal inflammation and permeability. Data are expressed as means ± SD. *p < 0.05 indicate significant differences between exposure groups and the control group; #p < 0.05 indicate significant differences between vitamin D-high and vitamin D-low groups at the same PS-NPs concentration
Fig. 4
Fig. 4
Virus metagenome sequencing of zebrafish intestinal content. A Alpha diversity (Shannon index) of zebrafish intestinal viruses. B The PCoA plot of zebrafish intestinal viruses. C Relative abundance of viruses at the species level (top 10). D The relative abundance of KT319643 (UNVERIFIED: Listeria phage WIL-3). E The relative abundance of AF191073 (stealth virus 1 clone 3B43). F The relative abundance of KM209255 (Dickeya phage phiDP10.3 clone pD10). G Viruses with significant differences between the 15 + and 15 − group. H Viruses with significant differences between the 150 + and 150 − group. The green arrow represents downregulation, and the red arrow represents upregulation. DESeq2 was used for analysis, and viruses with FDR (false discovery rate) < 0.05 and fold change (FC) ≥ 2 were selected as significant differentially expressed viruses. Data are expressed as means ± SD. *p < 0.05 indicate significant differences between the exposure groups and the control group
Fig. 5
Fig. 5
A Correlation analysis between viruses and brain biochemical indicators. B Correlation analysis between viruses and intestinal biochemical indicators. The smaller the oval area is, the larger the correlation coefficient is. Red represents a positive correlation, and blue represents a negative correlation. Pearson correlation analysis was used. *p ≤ 0.05, **p ≤ 0.01, ***p ≤ 0.001

References

    1. Danso D, Chow J, Streit WR. Plastics: environmental and biotechnological perspectives on microbial degradation. Appl Environ Microbiol. 2019;85(19):e01095–e1119. doi: 10.1128/AEM.01095-19. - DOI - PMC - PubMed
    1. Hossain R, Islam MT, Ghose A, Sahajwalla V. Full circle: challenges and prospects for plastic waste management in Australia to achieve circular economy. J Clean Prod. 2022;368:133127. doi: 10.1016/j.jclepro.2022.133127. - DOI
    1. Borrelle SB, Ringma J, Law KL, Monnahan CC, Lebreton L, Mcgivern A, et al. Predicted growth in plastic waste exceeds efforts to mitigate plastic pollution. Science. 2020;369(6510):1515–1518. doi: 10.1126/science.aba3656. - DOI - PubMed
    1. Dawson AL, Kawaguchi S, King CK, Townsend KA, King R, Huston WM, et al. Turning microplastics into nanoplastics through digestive fragmentation by Antarctic krill. Nat Commun. 2018;9(1):1001–1008. doi: 10.1038/s41467-018-03465-9. - DOI - PMC - PubMed
    1. Li L, Li F, Deng M, Wu C, Zhao X, Song K, et al. Microplastics distribution characteristics in typical inflow rivers of Taihu Lake: linking to nitrous oxide emission and microbial analysis. Water Res. 2022;225:119117. doi: 10.1016/j.watres.2022.119117. - DOI - PubMed

Publication types

LinkOut - more resources