. 2023 Nov 27;4(1):43.
doi: 10.1186/s43556-023-00159-7.

MSCs overexpressing GDNF restores brain structure and neurological function in rats with intracerebral hemorrhage

Affiliations

MSCs overexpressing GDNF restores brain structure and neurological function in rats with intracerebral hemorrhage

Xiaoqian Jiang et al. Mol Biomed. .

Abstract

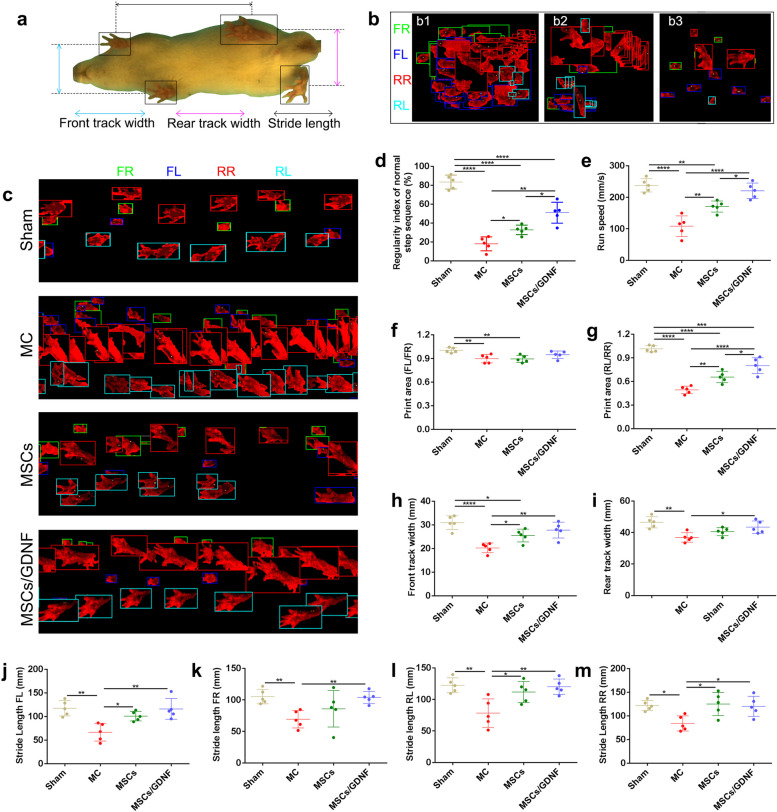
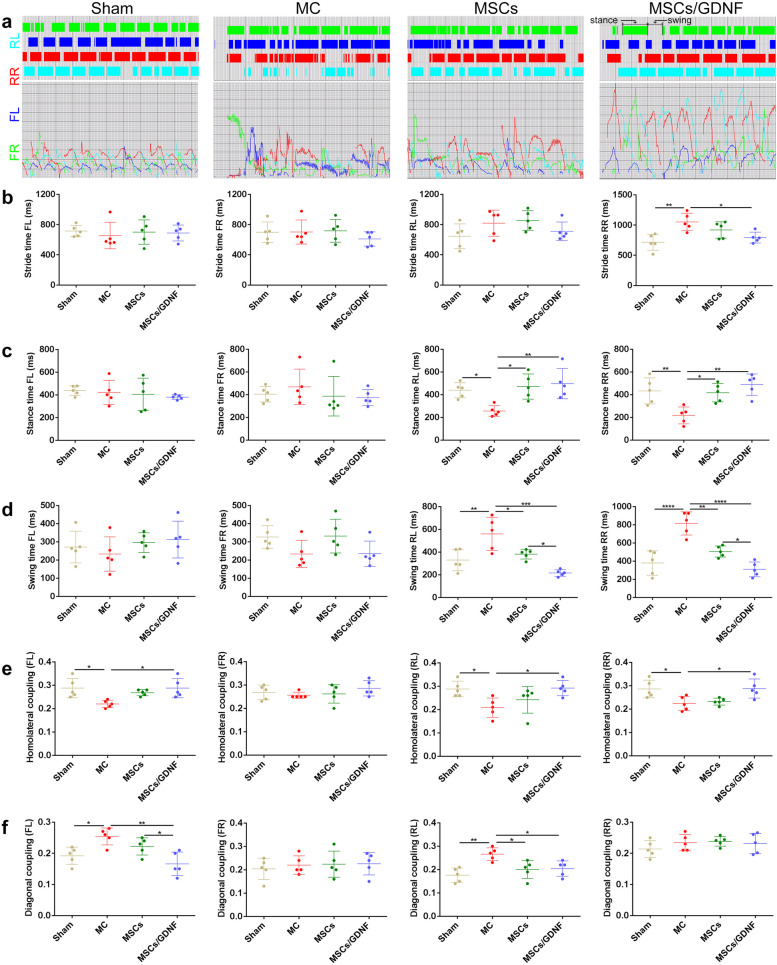
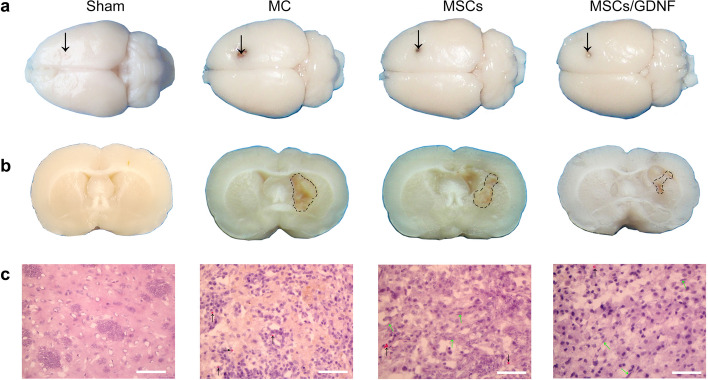
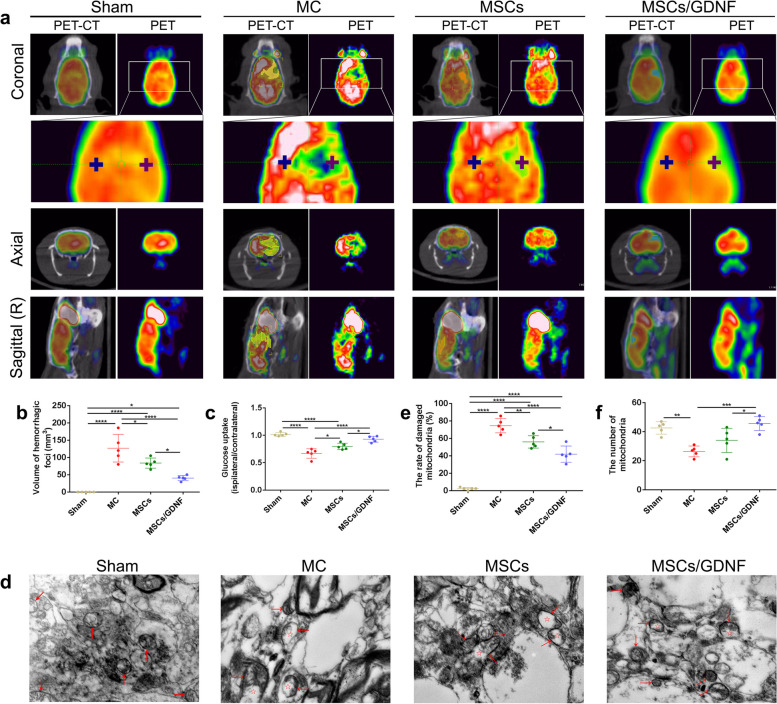
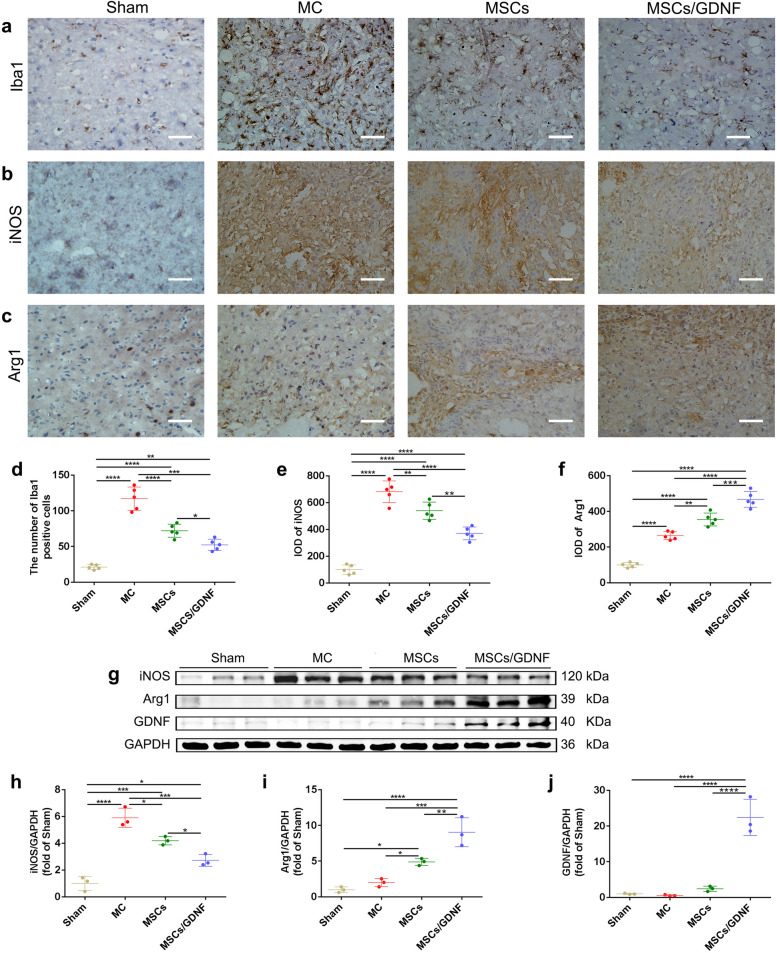
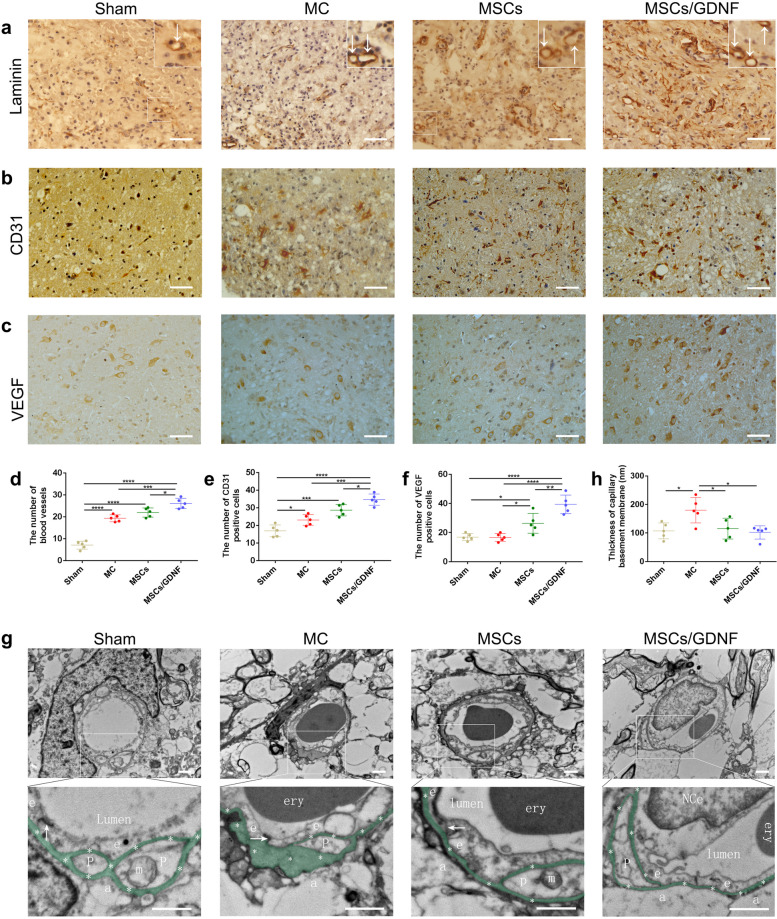
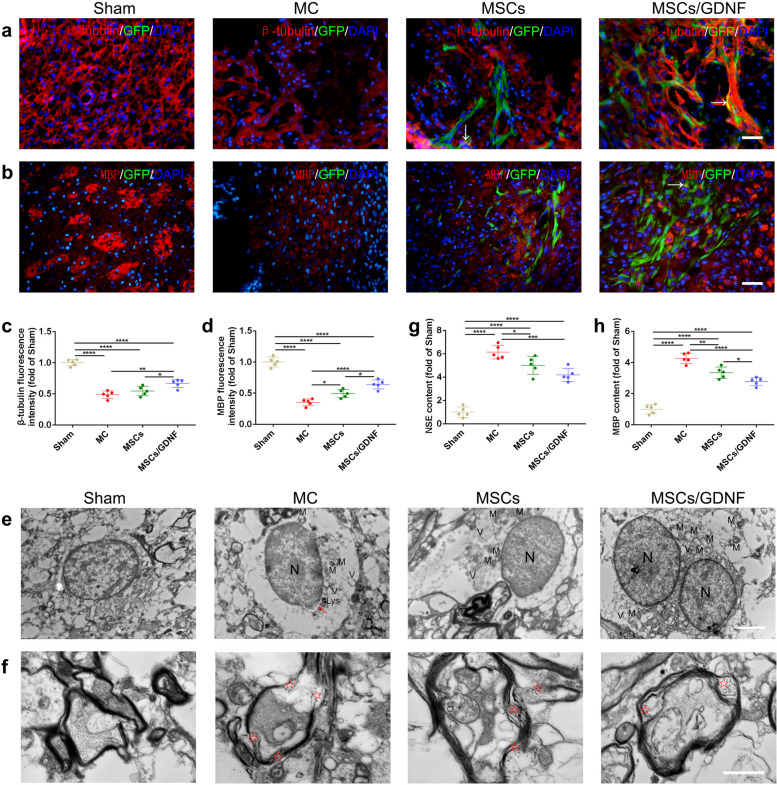
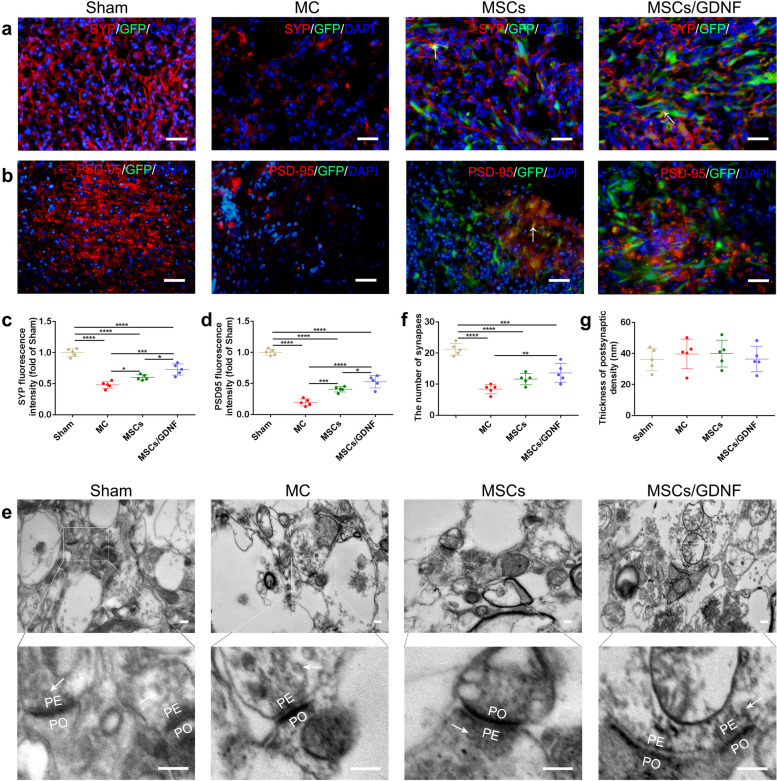
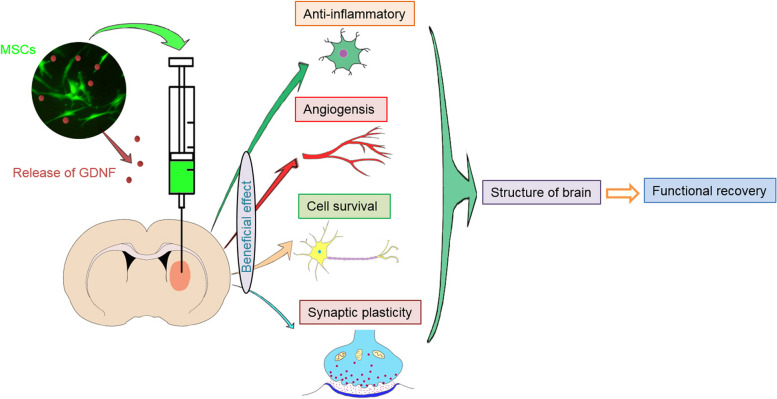
Mesenchymal stem cells (MSCs) have been applied in transplantation to treat intracerebral hemorrhage (ICH) but with limited efficacy. Accumulated evidence has shown that glial cell-derived neurotrophic factor (GDNF) plays a crucial part in neuronal protection and functional recovery of the brain after ICH; however, GDNF has difficulty crossing the blood-brain barrier, which limits its application. In this study, we investigated the influences of MSCs overexpressing GDNF (MSCs/GDNF) on the brain structure as well as gait of rats after ICH and explored the possible mechanisms. We found that cell transplantation could reverse the neurological dysfunction and brain damage caused by ICH to a certain extent, and MSCs/GDNF transplantation was superior to MSCs transplantation. Moreover, Transplantation of MSCs overexpressing GDNF effectively reduced the volume of bleeding foci and increased the level of glucose uptake in rats with ICH, which could be related to improving mitochondrial quality. Furthermore, GDNF produced by transplanted MSCs/GDNF further inhibited neuroinflammation, improved mitochondrial quality and function, promoted angiogenesis and the survival of neurons and oligodendrocytes, and enhanced synaptic plasticity in ICH rats when compared with simple MSC transplantation. Overall, our data indicate that GDNF overexpression heightens the curative effect of MSC implantation in treating rats following ICH.

Keywords: Glial cell-derived neurotrophic factor; Intracerebral hemorrhage; Mesenchymal stem cells; Neurological recovery; Synaptic plasticity.


Conflict of interest statement

The authors declare no conflict of interest.

Figures

Fig. 1
Fig. 1
Gait analysis using TreadScan to evaluate motor ability of rats. a Representative rat moving image. b Representative paw prints of motor dysfunction symptoms in rats after ICH (b1: rotation; b2: slow movements; b3: smaller footprints). c Representative paw prints of rats in different groups. d-m Gait parameters of the rats in different groups were dealt with GAIT SCAN analysis software (n = 5 per group). The parameters include regularity index of normal step sequence, run speed, print area, track width, and stride length. FL, FR, RL and RR represent front left, front right, rear left and rear right paws, respectively. *P < 0.05, **P < 0.01, ***P < 0.001, and ****P < 0.0001
Fig. 2
Fig. 2
Motor function measured by TreadScan. a Representative strides (including stance and swing) of the rats in different groups. b-f Gait parameters of the rats in different groups were dealt with GAIT SCAN analysis software (n = 5 per group). The parameters include stride time, stance time, swing time, homolateral coupling, and diagonal coupling. FL, FR, RL and RR represent front left, front right, rear left and rear right paws, respectively. *P < 0.05, **P < 0.01, and ****P < 0.0001
Fig. 3
Fig. 3
MSCs/GDNF treatment improves brain tissue structure. a The upper views of whole rat brains in different groups. The arrow represents the needle entry point. b Coronal sections of rat brains show the hemorrhagic focus in different groups. The dashed line area indicates the hemorrhagic focus. c H&E staining shows pathological structure of brain tissues of rats in different groups. Black arrow: red blood cell; green arrow: transplanted cell. Scale bar, 100 μm
Fig. 4
Fig. 4
MSCs/GDNF treatment improves glucose uptake level and mitochondrial structure. a PET-CT images of rat brains in the different groups. Pluses indicate the points where glucose uptake was measured, and the shadow represents the hemorrhagic focus. b The quantitative analysis of lesion volume via 18F-FDG micro-PET-CT scan (n = 5 per group). c The quantitative analysis of glucose uptake (ipsilateral/contralateral) via.18F-FDG micro-PET-CT scan (n = 5 per group). d Representative electron micrographs of the peripheral area of the bleeding foci in the different groups. Red arrow: mitochondria; red pentagram: part of the mitochondrial vacuole. e The percentage of damaged mitochondria in the different groups (n = 5 per group). f The number of mitochondria in the different groups (n = 5 per group). Scale bar, 1 µm. *P < 0.05, **P < 0.01 and ****P < 0.001
Fig. 5
Fig. 5
The effect of MSCs/GDNF transplantation on microglia. a-c The images of Iba1, iNOS, Arg1 IHC staining in the ipsilateral striata of rats. d-f Quantitative analysis of the expressions of Iba1, iNOS, and Arg1 immunopositive staining. g Arg1, iNOS and GDNF protein bands were determined by Western blotting. h-j Quantitative analyses of Western blot bands showing GDNF, iNOS and Arg1 protein levels in different groups (n = 3 per group). Scale bars, 100 μm (a-c). *P < 0.05, **P < 0.01, ***P < 0.001, and ****P < 0.0001
Fig. 6
Fig. 6
The effect of MSCs/GDNF transplantation on blood vessels and associated proteins. a-c The images of laminin, CD31, VEGF IHC staining in ipsilateral striata of rats. d-f The numbers of blood vessels, CD31- and VEGF-positive cells in the striata of the different groups (n = 5 per group). g Representative electron micrographs of brain capillaries in the different groups. The arrowhead indicates a tight junction between two endothelial cells. Asterisks show the basement membrane of the brain capillary. NCe, the nucleus of the endothelial cell; ery, erythrocyte; e, endothelial cell; p, pericyte; a, foot of astrocyte; m, mitochondrion. h Quantitative analysis of the thickness of capillary basement membrane. Scale bar, 100 μm (a-c) and 1 μm (g). *P < 0.05, ***P < 0.001, and ****P < 0.0001
Fig. 7
Fig. 7
The effect of MSCs/GDNF transplantation on neurons and the myelin sheath. a-b The images of β-tubulin and MBP IF staining in different groups. White arrows indicate the transplanted cells expressing β-tubulin or MBP protein. c-d Relative fluorescence intensities of β-tubulin and MBP (n = 5 per group). ef Electron micrographs of neurons (e) and the myelin sheath (f) in the striata of the different groups. Red arrows show defective or blurred nuclear membranes, and red pentagrams represent demyelination. N, nucleus; V, vacuole; M, mitochondrion; Lys, lysosome. (g-h) ELISA shows the NSE content (g) and MBP content (h) in sera of the different groups (n = 5 per group). Scale bars, 100 μm (a-b), 2 μm (e) and 1 μm (f). *P < 0.05, **P < 0.001, and ****P < 0.0001
Fig. 8
Fig. 8
The effect of MSCs/GDNF transplantation on synaptic plasticity. a-b The images of SYP and PSD-95 IF staining in the different groups. White arrows indicate the transplanted cells expressing SYP or PSD-95 protein. c-d Relative fluorescence intensities of SYP and PSD-95 (n = 5 per group). e The electron micrographs of synapses around hemorrhagic foci. The white arrows show synaptic vesicles. PO, postsynaptic element; PE, presynaptic element. f-g The number of synapses and thickness of postsynaptic density in the different groups (n = 5 per group). Scale bars, 100 μm (a-b) and 200 nm (e). *P < 0.05, **P < 0.01, ***P < 0.001, and ****P < 0.0001
Fig. 9
Fig. 9
Graphical summary

Similar articles

Cited by

References

    1. Cordonnier C, Demchuk A, Ziai W, Anderson CS. Intracerebral haemorrhage: current approaches to acute management. Lancet. 2018;392(10154):1257–68. doi: 10.1016/S0140-6736(18)31878-6. - DOI - PubMed
    1. Chen Y, Chen S, Chang J, Wei J, Feng M, Wang R. Perihematomal edema after intracerebral hemorrhage: an update on pathogenesis, risk factors, and therapeutic advances. Front Immunol. 2021;12:740632. doi: 10.3389/fimmu.2021.740632. - DOI - PMC - PubMed
    1. Zhang S, Shu Y, Chen Y, Liu X, Liu Y, Cheng Y, et al. Low hemoglobin is associated with worse outcomes via larger hematoma volume in intracerebral hemorrhage due to systemic disease. MedComm. 2022;3(1):e96. doi: 10.1002/mco2.96. - DOI - PMC - PubMed
    1. Qureshi AI, Quresh AI, Huang W, Lobanova I, Barsan WG, Hanley DF, et al. Outcomes of intensive systolic blood pressure reduction in patients with intracerebral hemorrhage and excessively high initial systolic blood pressure: Post Hoc analysis of a randomized clinical trial. JAMA Neurol. 2020;77(11):1355–65. doi: 10.1001/jamaneurol.2020.3075. - DOI - PMC - PubMed
    1. Chen W, Guo C, Feng H, Chen Y. Mitochondria: Novel mechanisms and therapeutic targets for secondary brain injury after intracerebral hemorrhage. Front Aging Neurosci. 2021;12:615451. doi: 10.3389/fnagi.2020.615451. - DOI - PMC - PubMed

LinkOut - more resources