

Unlocking the Secrets of Longevity: Exploring the Impact of Socioeconomic Factors and Health Resources on Life Expectancy in Oman and Qatar
- PMID: 38008897
- PMCID: PMC10683384
- DOI: 10.1177/00469580231212224
Unlocking the Secrets of Longevity: Exploring the Impact of Socioeconomic Factors and Health Resources on Life Expectancy in Oman and Qatar
Abstract
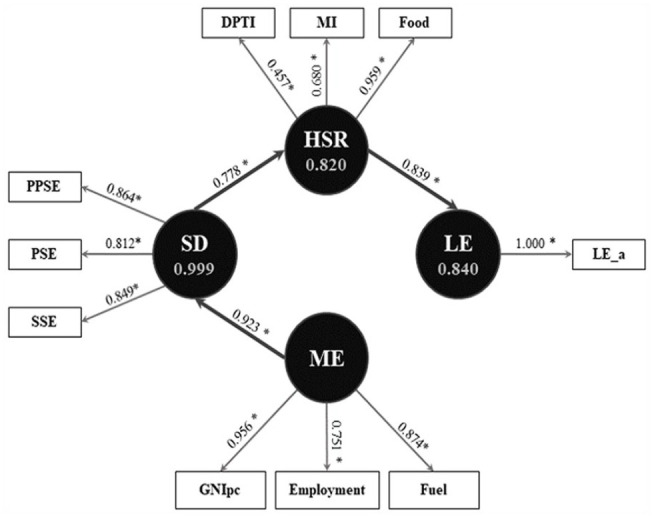
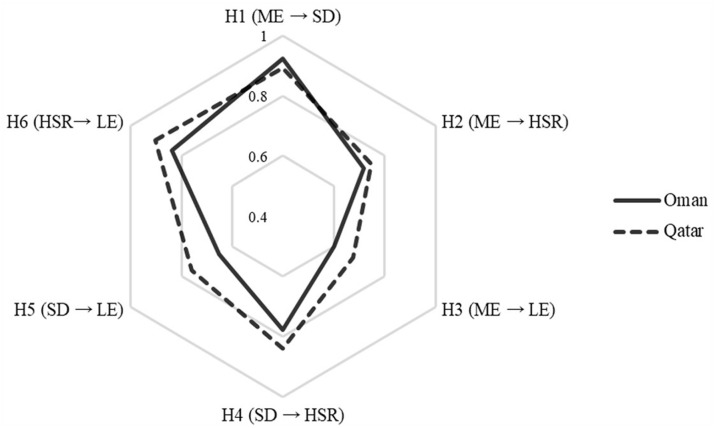
In an era marked by a sweeping pandemic and the encroaching shadow of an energy crisis, the well-being and lifespan of global populations have become pressing concerns for every nation. This research zeroes in on life expectancy (LE), a powerful indicator of societal health in Oman and Qatar. Our study juxtaposes 3 key factors affecting LE: health status and resources (HSR), macroeconomics (ME), and sociodemographic (SD) factors. To achieve this, we tapped into a comprehensive data set from the World Bank, encompassing a transformative 3-decade span from 1990 to 2020. The intricate interplay between these factors and LE was deciphered through robust Structural Equation Modeling (SEM). Our findings construct a compelling narrative: ME has an indirect yet considerable influence on LE-manifesting with an effect of 0.602 for Oman and 0.676 for Qatar. This influence is mediated by SD and HSR components. Similarly, SD elements impact LE indirectly-with an effect of 0.653 for Oman and 0.759 for Qatar- this effect is mediated by HSR. In contrast, HSR themselves wield a robust and direct influence on LE, indicated by an effect of 0.839 for Oman and 0.904 for Qatar. All these aforementioned effects were statistically substantial (P < .001). Our research magnifies the robust direct influence of HSR on LE in both Oman and Qatar, simultaneously highlighting the noteworthy indirect role of ME and SD factors. This emphasizes the significance of adopting an integrated policy approach that considers all the SD, ME, and HSR factors to improve the population health in both countries, which are also crucial for promoting LE growth in the Gulf Cooperation Council region.
Keywords: Gulf Cooperation Council; Oman; Qatar; health campaigns; health education; health policy; health promotion; health resources; health services accessibility; health status; life expectancy; macroeconomic; sociodemographic; socioeconomic factors; structural equation model.
Conflict of interest statement
Declaration of Conflicting InterestsThe author(s) declared no potential conflicts of interest with respect to the research, authorship, and/or publication of this article.
Figures


Similar articles
-
A structural equation model to explore sociodemographic, macroeconomic, and health factors affecting life expectancy in Oman.Pan Afr Med J. 2022 Jan 26;41:75. doi: 10.11604/pamj.2022.41.75.28488. eCollection 2022. Pan Afr Med J. 2022. PMID: 35382046 Free PMC article.
-
Comparing Life Expectancy Determinants Between Indonesia and Oman from 1980 to 2020.J Cross Cult Gerontol. 2025 Mar;40(1):29-48. doi: 10.1007/s10823-024-09511-y. Epub 2024 Jul 9. J Cross Cult Gerontol. 2025. PMID: 38980597
-
Comparing Life Expectancy Determinants between Saudi Arabia and United Arab Emirates from 1980-2020.Eur J Investig Health Psychol Educ. 2023 Jul 13;13(7):1293-1305. doi: 10.3390/ejihpe13070095. Eur J Investig Health Psychol Educ. 2023. PMID: 37504486 Free PMC article.
-
A theory-informed systematic review to understand physical activity among women in Gulf Cooperation Council countries.BMC Public Health. 2023 May 30;23(1):1009. doi: 10.1186/s12889-023-15725-5. BMC Public Health. 2023. PMID: 37254154 Free PMC article.
-
Tackling cancer control in the Gulf Cooperation Council Countries.Lancet Oncol. 2015 May;16(5):e246-57. doi: 10.1016/S1470-2045(15)70034-3. Lancet Oncol. 2015. PMID: 25943069 Review.
Cited by
-
The burden of prostate cancer in the North Africa and Middle East Region from 1990 to 2021.Sci Rep. 2025 Jan 13;15(1):1853. doi: 10.1038/s41598-024-83840-3. Sci Rep. 2025. PMID: 39805870 Free PMC article.
-
Comparison of life expectancy determinants among gulf cooperation council members.BMC Public Health. 2025 Jan 15;25(1):161. doi: 10.1186/s12889-025-21296-4. BMC Public Health. 2025. PMID: 39815262 Free PMC article.
-
The Impact of Social Determinants of Health, Health Resources, and Environmental Factors on Infant Mortality Rates in Three Gulf Cooperation Council (GCC) Countries.Eur J Investig Health Psychol Educ. 2025 Feb 21;15(3):26. doi: 10.3390/ejihpe15030026. Eur J Investig Health Psychol Educ. 2025. PMID: 40136765 Free PMC article.
-
Investigating the Determinants of Dengue Outbreak in Oman: A Study in Seeb.J Epidemiol Glob Health. 2024 Dec;14(4):1464-1475. doi: 10.1007/s44197-024-00324-3. Epub 2024 Nov 4. J Epidemiol Glob Health. 2024. PMID: 39495476 Free PMC article. Review.
References
-
- Guénette J, Kose M, Sugawara N. Is a Global Recession Imminent? – EFI Policy Note 4.
-
- Wilson R. (ed.). Economic Development in the Middle East, 3rd ed. Routledge; 2021.
Publication types
MeSH terms
LinkOut - more resources
Full Text Sources
