. 2023 Dec 6;25(47):32393-32406.
doi: 10.1039/d3cp02197a.

Expanded ensemble predictions of absolute binding free energies in the SAMPL9 host-guest challenge

Affiliations

Expanded ensemble predictions of absolute binding free energies in the SAMPL9 host-guest challenge

Matthew F D Hurley et al. Phys Chem Chem Phys. .

Abstract

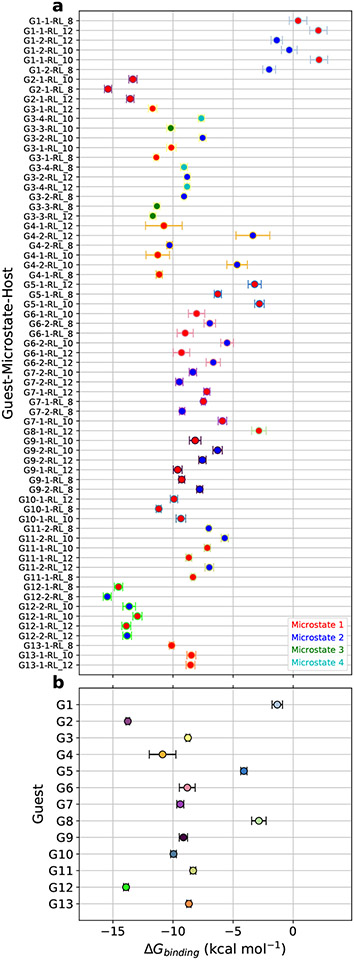
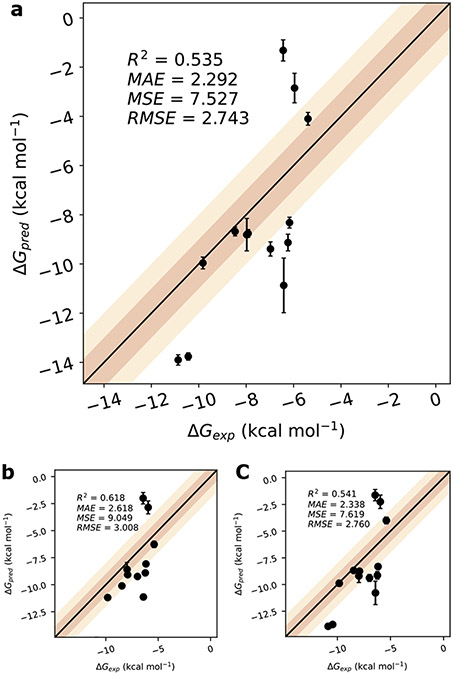
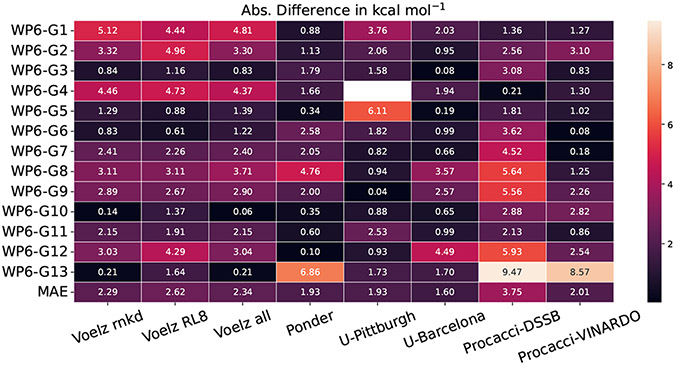
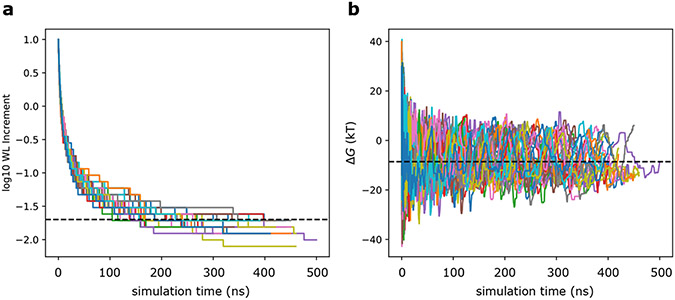
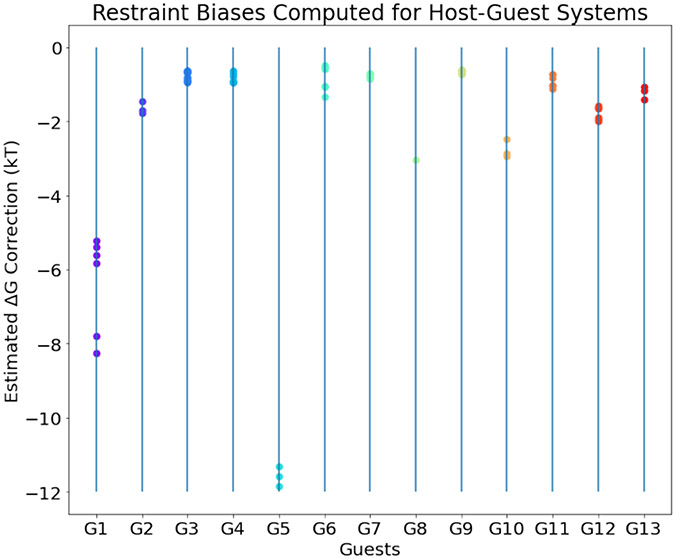
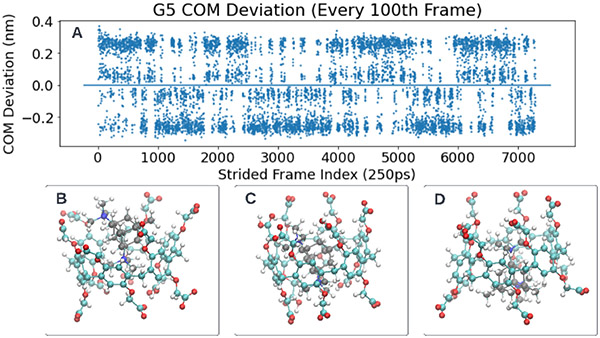
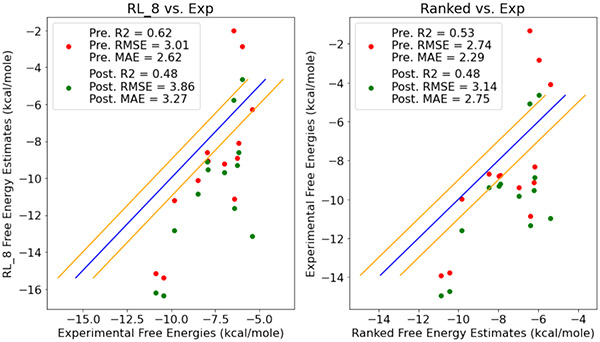
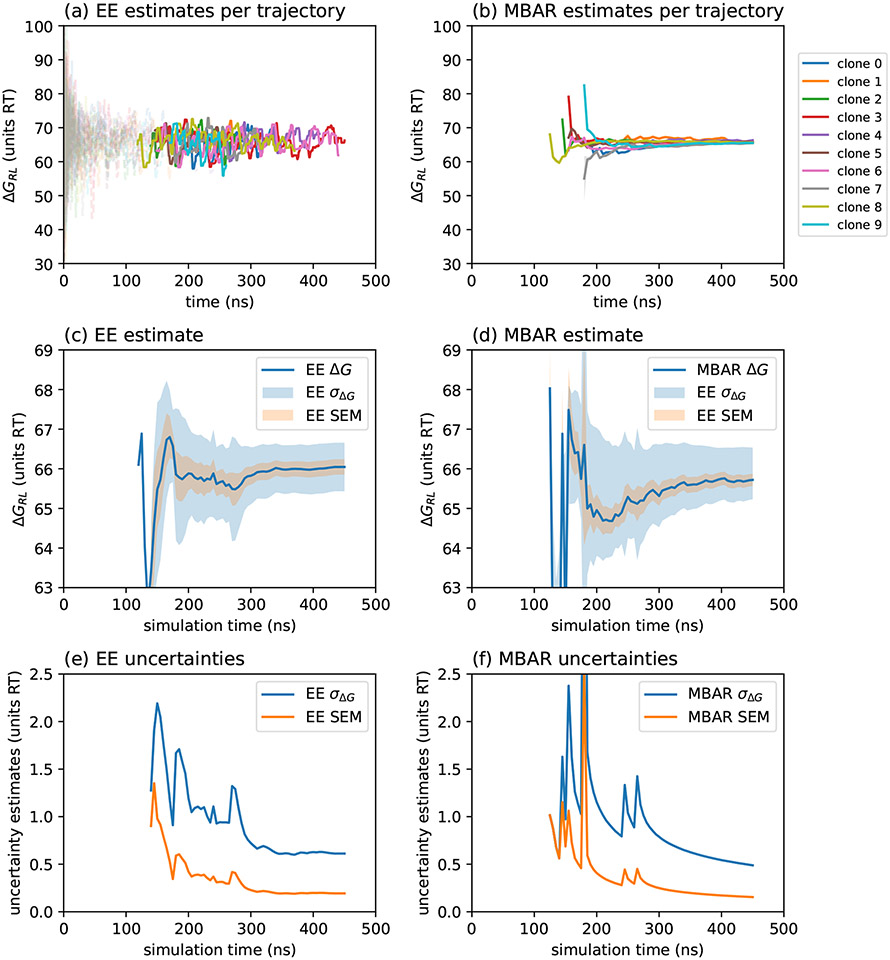
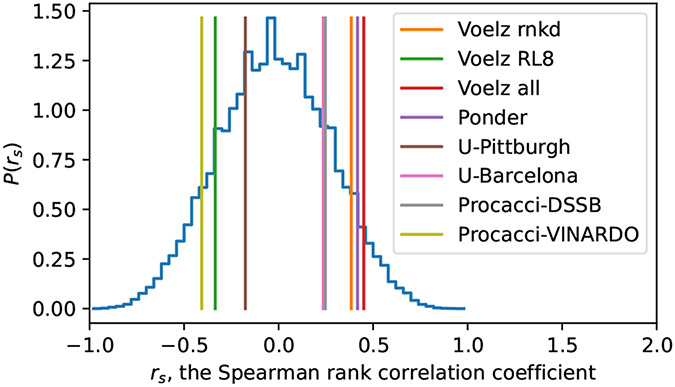
As part of the SAMPL9 community-wide blind host-guest challenge, we implemented an expanded ensemble workflow to predict absolute binding free energies for 13 small molecules against pillar[6]arene. Notable features of our protocol include consideration of a variety of protonation and enantiomeric states for both host and guests, optimization of alchemical intermediates, and analysis of free energy estimates and their uncertainty using large numbers of simulation replicates performed using distributed computing. Our predictions of absolute binding free energies resulted in a mean absolute error of 2.29 kcal mol-1 and an R2 of 0.54. Overall, results show that expanded ensemble calculations using all-atom molecular dynamics simulations are a valuable and efficient computational tool in predicting absolute binding free energies.


Conflict of interest statement

Conflicts of interest

There are no conflicts to declare.

Figures

Fig. 1
Fig. 1
Molecular structures of the pillar[6]arene host (WP6) and guests (G1–G13).
Fig. 2
Fig. 2
An example of λ-value optimization using pylambdaopt. The top panel shows λi values before optimization. The bottom panel shows the optimized λi values. Since the vdW decoupling transformation occurs independently and subsequent to the Coulomb decoupling transformation, pylambdaopt treats the transformation using a single λ=02, where λ=01 represents Coulomb decoupling and λ=12 represents vdW decoupling.
Fig. 3
Fig. 3
(a) Predicted free energies of host–guest binding using single microstates i (ΔGbinding=ΔGrest+ΔGL,iΔGRL,i) between host microstates and guest microstates. Error bars are colored by guest (see panel b) and data markers are colored by microstate index (see legend). (b) ΔGbinding in kcal mol−1 for each guest to WP6 (colored by guest) calculated according to Equation (3)
Fig. 4
Fig. 4
(a) Comparisons of predicted (ranked submission) vs. experimental binding free energies for all host–guest systems. Annotations report the correlation coefficient (R2), mean absolute error (MAE), mean standard error (MSE), root-mean squared error (RMSE). (b) Comparisons for the “Voelz RL8” submission. (c) Comparisons for the “Voelz all” submission.
Fig. 5
Fig. 5
Predictions of host–guest binding free energies submitted by all SAMPL9 participants. The color map and numerical values inside the cells are the absolute difference in predictions against experiment (in kcal mol−1). The last row is the mean absolute error (MAE) over all host–guest predictions for each group.
Fig. 6
Fig. 6
Convergence of expanded ensemble (EE) estimates of guest-only decoupling free energies ΔGL for G13. Superimposed are (up to) fifty independent trajectories (distinguished by color). (a) The Wang-Landau (WL) increment vs. simulation time, with a dotted line denoting our 0.02 convergence threshold. (b) EE estimates of ΔGL vs. simulation time, with a dotted line denoting the final estimate.
Fig. 7
Fig. 7
Convergence of expanded ensemble (EE) estimates of host–guest decoupling free energies ΔGRL for G13. Superimposed are (up to) fifty independent trajectories (distinguished by color). (a) The Wang-Landau (WL) increment vs. simulation time, with a dotted line denoting our 0.02 convergence threshold. (b) EE estimates of ΔGRL vs. simulation time, with a dotted line denoting the final estimate.
Fig. 8
Fig. 8
Convergence of expanded ensemble (EE) estimates of guest-only decoupling free energies ΔGL for G6. Superimposed are (up to) fifty independent trajectories (distinguished by color). (a) The Wang-Landau (WL) increment vs. simulation time, with a dotted line denoting our 0.02 convergence threshold. (b) EE estimates of ΔGL vs. simulation time, with a dotted line denoting the final estimate.
Fig. 9
Fig. 9
Convergence of expanded ensemble (EE) estimates of host–guest decoupling free energies ΔGRL for G6. Superimposed are (up to) fifty independent trajectories (distinguished by color). (a) The Wang-Landau (WL) increment vs. simulation time, with a dotted line denoting our 0.02 convergence threshold. (b) EE estimates of ΔGRL vs. simulation time, with a dotted line denoting the final estimate.
Fig. 10
Fig. 10
Estimated correction terms to our submitted free energy predictions for each guest, to correctly account for restraint biases.
Fig. 11
Fig. 11
Transitions between a number of host-bound states are shown for G5. (a) A trace of the z-axis displacement of the guest center-of-mass (COM) with respect to the host COM shows free energy minima at both +/− edges of the host, in addition to those near the center of mass. (b,c, and d) depict Conformations representative of binding for G5 are shown for poses near the (b) top, (c) middle, and (d) bottom of the host.
Fig. 12
Fig. 12
Changes to our submitted predicted before (red) and after (green) corrections are applied to correctly account for restraint biases. Left: “Voelz RL_8” submissions vs. experiment. Right: “Voelz ranked” submissions vs. experiment.
Fig. 13
Fig. 13
Comparison of the convergence of free energies from expanded ensemble simulations, calculated using the EE biases versus the MBAR free energy estimator. Ten independent EE trajectories for the decoupling of guest G13 from the WP6 (−12) host (see Figure 7) were used for these tests. (a) Free energies ΔGRL over time for each trajectory estimated from the EE biases. Traces change from transparent to solid lines as each trajectory reached the δ<0.02 convergence criterion. (b) Free energies ΔGRL over time for each trajectory estimated from MBAR. The appearance of each trace over time occurs when both the convergence criterion is met, and there are samples from each thermodynamic ensemble. Mean free energy estimates averaged over each trajectory, standard deviations σΔG across trajectories, and standard errors of the mean, shown over time for the EE bias estimator (c,e) and MBAR estimator (d,f).
Fig. 14
Fig. 14
Spearman rank correlation coefficients rs for participants in the SAMPL9 host–guest challenge, in comparison with the null distribution P(rs) constructed from the nonparametric sampling of randomly permuted ranks.

Similar articles

Cited by

References

    1. Muddana HS, Daniel Varnado C, Bielawski CW, Urbach AR, Isaacs L, Geballe MT and Gilson MK, Journal of computer-aided molecular design, 2012, 26, 475–487. - PMC - PubMed
    1. Muddana HS, Fenley AT, Mobley DL and Gilson MK, Journal of computer-aided molecular design, 2014, 28, 305–317. - PMC - PubMed
    1. Yin J, Henriksen NM, Slochower DR, Shirts MR, Chiu MW, Mobley DL and Gilson MK, Journal of computer-aided molecular design, 2017, 31, 1–19. - PMC - PubMed
    1. Rizzi A, Murkli S, McNeill JN, Yao W, Sullivan M, Gilson MK, Chiu MW, Isaacs L, Gibb BC, Mobley DL et al., Journal of computer-aided molecular design, 2018, 32, 937–963. - PMC - PubMed
    1. Amezcua M, El Khoury L and Mobley DL, Journal of computer-aided molecular design, 2021, 35, 1–35. - PMC - PubMed

LinkOut - more resources