. 2022 Jul-Sep;12(3):031027.
doi: 10.1103/physrevx.12.031027. Epub 2022 Aug 17.

Cell-Matrix Elastocapillary Interactions Drive Pressure-based Wetting of Cell Aggregates

Affiliations

Cell-Matrix Elastocapillary Interactions Drive Pressure-based Wetting of Cell Aggregates

M S Yousafzai et al. Phys Rev X. 2022 Jul-Sep.

Abstract

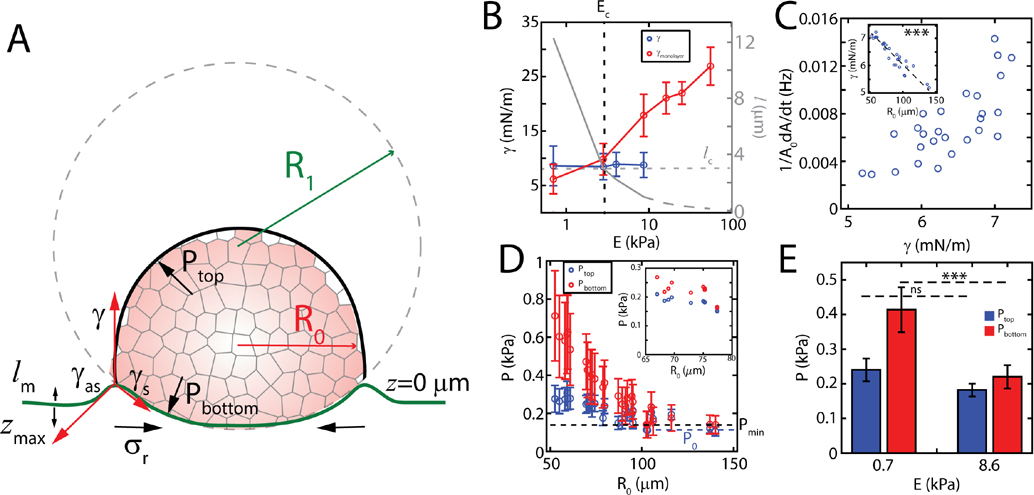
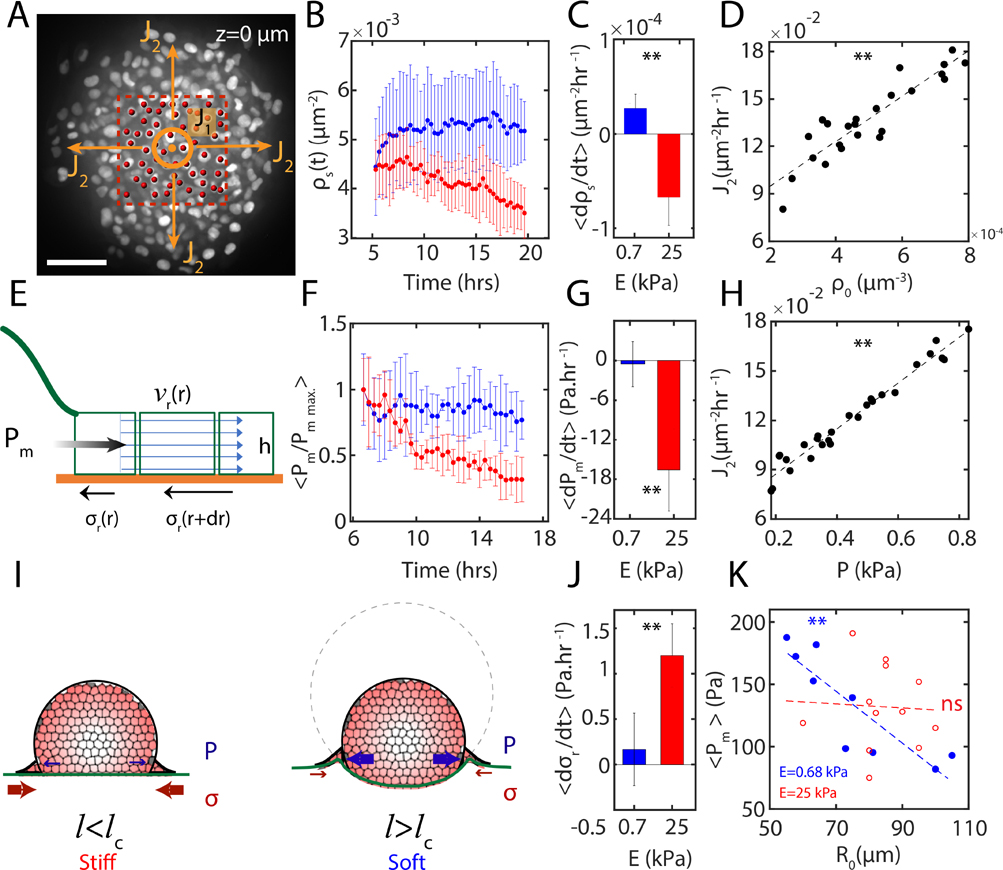
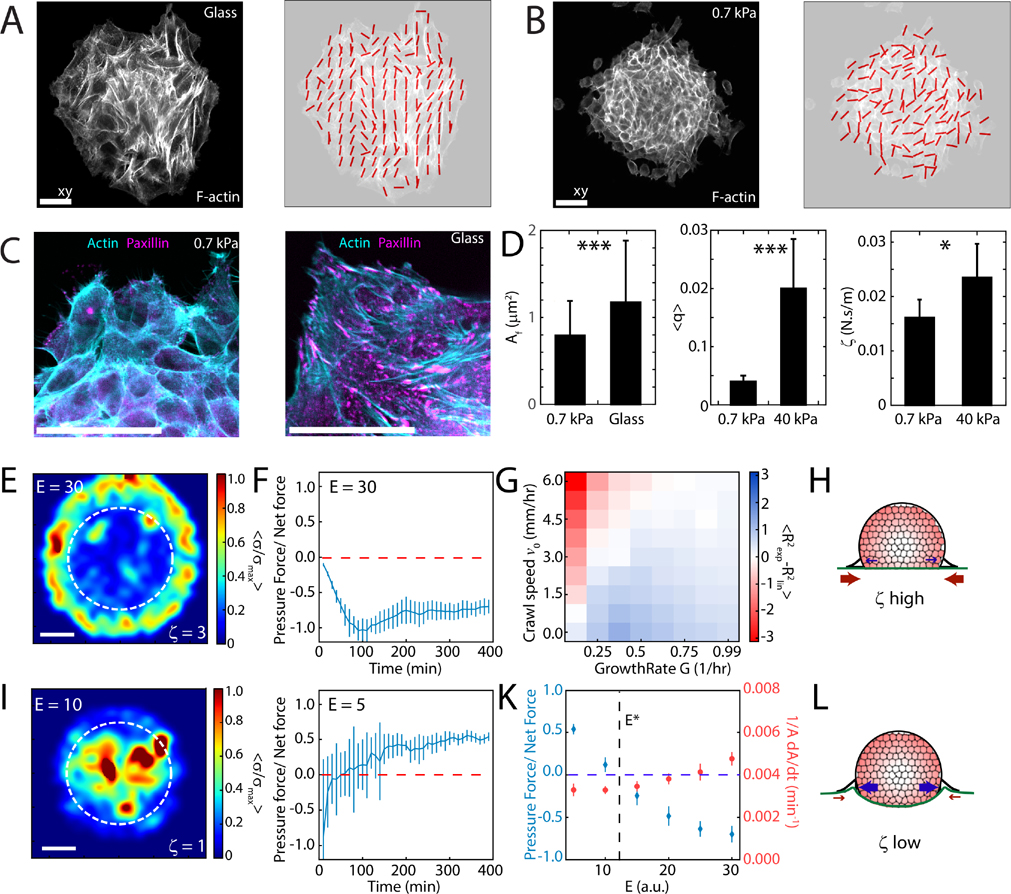
Cell-matrix interfacial energies and the energies of matrix deformations may be comparable on cellular length-scales, yet how capillary effects influence tis sue shape and motion are unknown. In this work, we induce wetting (spreading and migration) of cell aggregates, as models of active droplets onto adhesive substrates of varying elasticity and correlate the dynamics of wetting to the balance of interfacial tensions. Upon wetting rigid substrates, cell-substrate tension drives outward expansion of the monolayer. By contrast, upon wetting compliant substrates, cell substrate tension is attenuated and aggregate capillary forces contribute to internal pressures that drive expansion. Thus, we show by experiments, data-driven modeling and computational simulations that myosin-driven 'active elasto-capillary' effects enable adaptation of wetting mechanisms to substrate rigidity and introduce a novel, pressure-based mechanism for guiding collective cell motion.


Figures

FIG. 7.
FIG. 7.. Indentation follows a 1/R0 decay on substrates of different stiffnesses.
(A) Maximum indentation at R=R0 as a function of aggregate size R0 and substrate stiffnesses (0.7 kPa and 2.8 kPa). In both cases we observe that the indentation behavior is well approximated by a 1/R0 decay. (B) Maximum indentation scaled by elasto-capillary length scale, γ/E as function of size R0. Collapse of the data to a single regime indicates that indentation is proportional to elasto-capillary length. Each point represents a single experiment.
FIG. 8.
FIG. 8.. Estimation of Aggregate surface tension from 3D deformation data:
(A) A schematic showing force balance at the meniscus. The surface tension of the adhered aggregate was estimated by measuring the z-indentation, meniscus height, and radial traction forces. γ is the tension at the aggregate-media interface, γas is the tension at the substrate-media interface, γs is the tension at the substrate-aggregate interface. (B) Traction forces are calculated in the transparent yellow circular region of the TFM maps. Red dashed line show r=R0. The width of yellow region is 25 μm.
FIG. 9.
FIG. 9.. Pressure profiles obtained using continuum fluid model.
Pressure profiles of aggregates spreading on soft (A) and stiff (C) substrates, showing a size-independent maximum pressure for aggregates spreading on stiff substrates (B) and size-dependent maximum pressure for aggregates spreading on soft substrates (D). To check of the results on internal pressure from the data-driven model were independent the choice of μs and μb, using a set of combinations of the viscosities, qualitatively similar pressure profiles were obtained (E). Mean central pressure as a function of R0 with a different set of viscosities (μs=3000Pa.s and μb=1500Pa.s) remained uncorrelated for stiff substrates (E=25kPa) (F) and exhibited a significant inverse correlation for soft substrates (E=0.7kPa) (G). Magnitude of traction stresses on soft E=0.7kPa vs stiff E=25kPa substrates (H).
FIG. 10.
FIG. 10.. Differential growth or traction can capture spreading dynamics.
(A-F) Results from simulations in which cell crawl speed depends on substrate stiffness and growth rate is constant. (A) Cell crawl speed, and (B) growth rate as a function of substrate stiffness (E), for different gradients corresponding to C. (C) Average difference in fitting R2 values, using exponential against linear curves, as a function of substrate stiffness and crawl speed gradient (n=5). (D-F) Average traction stress (σ) as a function of distance from the center of the monolayer, r (n=5), from soft to stiff substrates (dark to light) when (D) crawl speed decreasing with stiffness, v0E=0.06, (E) constant crawl speed v0E=0, and (F) crawl speed increasing with stiffness v0E=0.06. (G-L) Results from simulations in which growth rate depends on substrate stiffness and cell crawl speed is constant. (G) Cell crawl speed, and (H) growth rate as a function of substrate stiffness (E), for different gradients corresponding to I. (I) Average difference in fitting R2 values, using exponential against linear curves, as a function of substrate stiffness and growth gradient (n=5). (J-L) Average traction stress (σ) as a function of distance from the center of the monolayer, r (n=5), from soft to stiff substrates (dark to light) when (J) growth rate decreasing with stiffness, GE=0.033, (K) constant growth rate GE=0, and (L) growth rate increasing with stiffness GE=0.033.
FIG. 11.
FIG. 11.. Pressure measurement on the bottom surface of the aggregate using JKR
Laplace independent measurement of pressure on the bottom surface of aggregate using JKR approximation, agrees qualitatively and quantitatively with Laplace based measurements.
FIG. 1.
FIG. 1.. Substrate stiffness and aggregate size determine wetting dynamics.
(A) Diagram of an aggregate spreading on a fibronectin-coated polyacrylamide gel. (B) z-profile of F-actin stained aggregate adhered to glass. (C) DIC image of an aggregate spreading on glass. A0 is the projected area of an un-deformed aggregate, and A is the instantaneous contact area over which the monolayer has spread. (D) Normalized spread area A/A0 as a function of time and stiffness. (E) Difference in fitting R2 values as a function of stiffness. (F) Spreading rate 1A0dAdt measured between A=A0 and A=2A0(n=13 for 0.7 kPa and n=10 for 40 kPa). (G) Spreading rate as a function of aggregate size for 0.7 kPa substrate (red, n=27), 40 kPa substrate (blue, n=18), and glass (black, n=8). Scale bars are 50μm. *P < 0.05, **P < 0.01, ***P < 0.001. ns is non-significant. Error bars are mean ± standard deviation.
FIG. 2.
FIG. 2.. Traction stresses are attenuated during wetting to soft substrates
(A) Normalized radial velocity fields (|vr|/|vr,max|) for cumulative displacement of cell motion. F-actin images are used for flow calculation. (B, left) Magnitude of stress vectors (|σ|) calculated via TFM of an aggregate spreading on substrates of stiffness 0.7 kPa (top), 2.8 kPa (middle), and 40 kPa (bottom). (B, right) Corresponding kymograph of data in (B, left).(C) Velocity gradient d|v|dr, as a function of substrate stiffness, E (n=12). (D) Radial stress distribution of a spread aggregate on substrates with stiffness 0.7kPa, 2.8kPa, and 40kPa (n=3). (E) Stress gradient d|σ|dr as a function of substrate stiffness, E (n=12). (F) Normalized radial stresses (|σr|/|σr,max|) for the substrate stiffnesses in A. Red indicating inward tractions, blue indicating outward tractions. dashed black line indicates the contact line of aggregates. Yellow dashed lines in A and F indicate region where the gradients are calculated. ns is non-significant. Scale bar is 50 μm. Error bars are mean ± standard deviation.
FIG. 3.
FIG. 3.. Aggregate adhesion induces capillary deformations in the substrate.
(A, top) A reconstructed z-slice showing F-actin in a cell aggregate (green) indenting a 0.7 kPa substrate (red). (A, bottom) A schematic showing relative magnitudes of out-of-plane deformations (l,z). (B) z-indentation as a function of radial distance from the center of an aggregate. (C) Mean elasto-capillary length for all aggregates, as a function of substrate stiffness, E. The indentation measured at 8.6 kPa corresponds to noise in the measurement of indentation. (D) Meniscus height as a function of aggregate size on E=0.7kPa. (E) Maximum indentation as a function of scaled contact area, A/A0 for untreated (blue) and 10 μM Blebbistatin treated (red) aggregates. (F) Maximum indentation, zmax, as a function of aggregate radius, R0. Pharmacological treatment with Blebbistatin vanishes Laplace-like behavior. 0μM(n=75), 2μM(n=30), 10μM(n=20). (G) Diagram of aggregates of different sizes inducing different out-of-plane deformations. Scale bar is 50μM. *P < 0.05, **P < 0.01, ***P < 0.001. ns is non-significant. z0 is set to 0 for all measurements.
FIG. 4.
FIG. 4.. Capillary forces increase aggregate internal pressure.
(A) A schematic describing the decomposition of forces and pressures at A=A0 on deformable substrates. (B) Effective surface tension as a function of substrate stiffness when measured from monolayer stress (red), and active elasto-capillary deformations (blue) (N=10 samples per data point). Effective elasto-capillary length as a function of substrate stiffness calculated from experimental data (solid grey) and under assumption that surface tension stays constant (dashed grey). lc and Ec are the critical elasto-capillary length and critical substrate stiffness, respectively, where the transition between modes of migration occurs. (C) Aggregate spreading rate as a function of the aggregate surface tension on a 0.7 kPa substrate (N=27). Surface tension as a function of aggregate size (inset). (D) Pressure on top and bottom section of an aggregate at 0.7 kPa and 8.6 kPa (inset). The dashed black line represents the minimum pressure, Pmin=135.8±4.4Pa, required to overcome traction. The dashed blue line is basal pressure, P0=109.6±6.2Pa, for largest aggregates. Error bars are error propagated from measurements of lmax and zmax. (E) Mean pressure on top and bottom sections as a function of substrate stiffness (N=9 for 0.7 and 8.6 kPa each). Error bars are mean ± standard deviation.
FIG. 5.
FIG. 5.. Internal pressure drives size-dependent cellular flows on soft substrates.
(A) Image of a spreading nuclei-stained aggregate at z=0μm, the substrate surface. Red dashed box shows the area underneath the aggregate where ρs measurements were done. Central circle represents the normal vector of inlet flux J1 on the plane, arrows showing the outlet flux of cells J2. (B) ρs as a function of time for spreading on soft (E=0.7kPa, blue) and stiff (E=40kPa, red) substrates. (C) Significant difference in the rates of change of ρs on soft E=0.7kPa, blue) and stiff (E=40 kPa, red) substrates. (D) J2 as a function of ρ0 on soft substrate (E=0.7kPa). (E) A schematic of the components of the data-driven fluid model to calculate the internal pressure. (F) Normalized internal pressure (within 0<r<40μm of aggregate) calculated from the data-driven model Pm as a function of time for soft (E=0.7kPa, blue) and stiff (E=25kPa, red) substrates. (G) Significant difference in the mean rate of change of internal pressure for aggregates spreading on soft (E=0.7kPa, blue) and stiff (E=25kPa, red) substrates. (H) J2 as a function of P. (I) Schematic for pressure-driven and traction-driven flows, which depends upon the stiffness of the substrate, E. (J) Significant difference in the mean rate of change of traction stresses for aggregates spreading on soft (E=0.7kPa, blue) and stiff (E=25kPa, red) substrates. (K) Mean internal pressure calculated within 0<r<40μm of aggregates as a function of aggregates initial radius R0 in steady state spreading of aggregates on soft (E=0.7kPa, blue) and stiff (E=25kPa, red) substrates.
FIG. 6.
FIG. 6.. Friction differentiates pressure-driven from traction-driven motion.
Confocal images and alignment vector field showing ordering of F-actin cytoskeleton on glass (A) and 0.7 kPa substrate (B). (C) F-actin and Paxillin stains within an aggregate spreading on 0.7 kPa gel and glass. Scale bars are 25 μm. (D) Focal adhesion size, mean ordering parameter and effective friction coefficient on soft and stiff substrates (N=7 for 0.7 and 40 kPa each). Traction force results from Vertex Model for stiff, (E) E=30 and soft, (I) E=10 substrates. Area outlined by dashed white line indicates the region of cell addition. Scale bar is 20 μm. (E) On rigid substrates (E=30), friction is high, and self-propulsion accounts for most of the total traction force that drives motion. (I) On soft substrates (E=5) friction is low, and pressure accounts for most of the total traction force that drives motion. (F,G, and J) The balance of crawling and growth reproduces exponential and linear behaviors on soft and stiff substrates respectively. (K) The balance of pressure to self-propelled forces changes as a function of substrate rigidity E, with nominal changes to spreading rate (ϵ). (H, L) Schematic for pressure-driven and traction-driven flows, which depends upon the friction coefficient ζ (and stiffness, E) of the substrate. Error bars are mean ± standard deviation.

Similar articles

Cited by

References

    1. Trinkaus JP and Groves PW, Differentiation in culture of mixed aggregates of dissociated tissue cells, Proceedings of the National Academy of Sciences of the United States of America 41, 787 (1955). - PMC - PubMed
    1. Steinberg MS, Reconstruction of tissues by dissociated cells, Science 141, 401 (1963). - PubMed
    1. Steinberg MS, On the mechanism of tissue reconstruction by dissociated cells, iii. free energy relations and the reorganization of fused, heteronomic tissue fragments, Proceedings of the National Academy of Sciences of the United States of America 48, 1769 (1962). - PMC - PubMed
    1. Ajeti V, Tabatabai AP, Fleszar AJ, Staddon MF, Seara DS, Suarez C, Yousafzai MS, Bi D, Kovar DR, Banerjee S, and Murrell MP, Wound healing coordinates actin architectures to regulate mechanical work, Nature Physics 15, 695 (2019). - PMC - PubMed
    1. Friedl P and Gilmour D, Collective cell migration in morphogenesis, regeneration and cancer, Nature Reviews Molecular Cell Biology 10, 445 (2009). - PubMed

LinkOut - more resources