TitrationAnalysis: a tool for high throughput binding kinetics data analysis for multiple label-free platforms
- PMID: 38009106
- PMCID: PMC10667272
- DOI: 10.12688/gatesopenres.14743.2
TitrationAnalysis: a tool for high throughput binding kinetics data analysis for multiple label-free platforms
Abstract
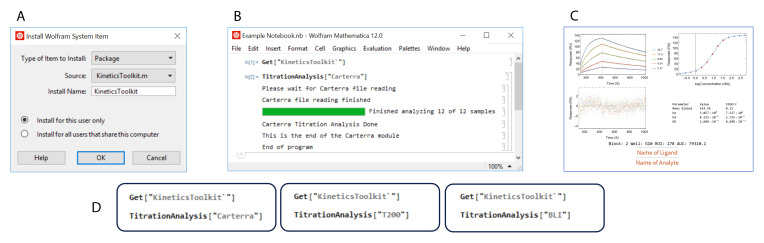
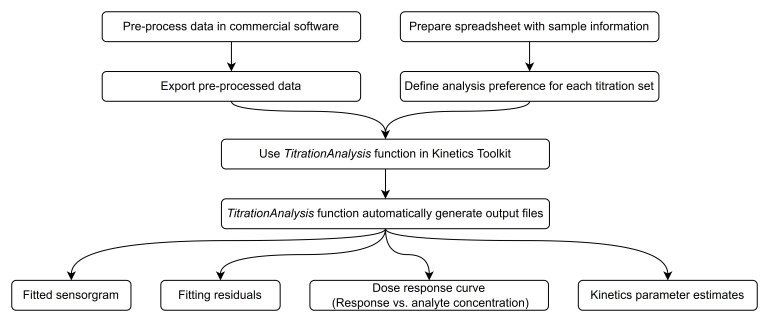
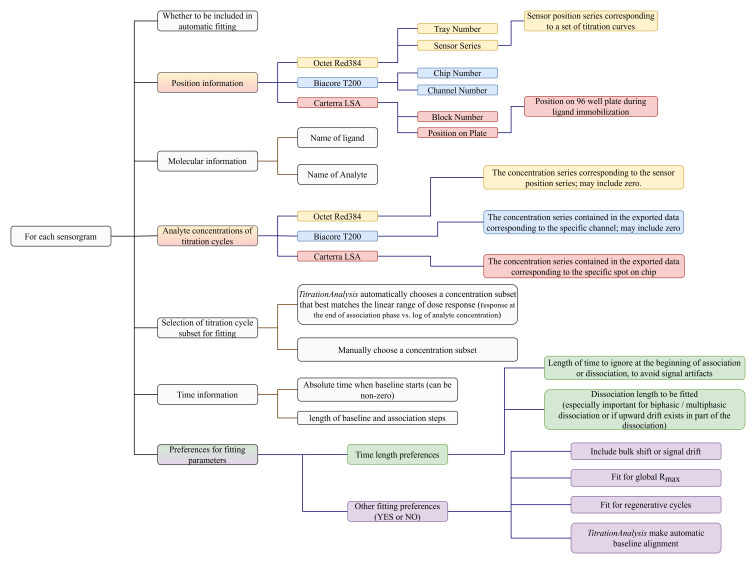
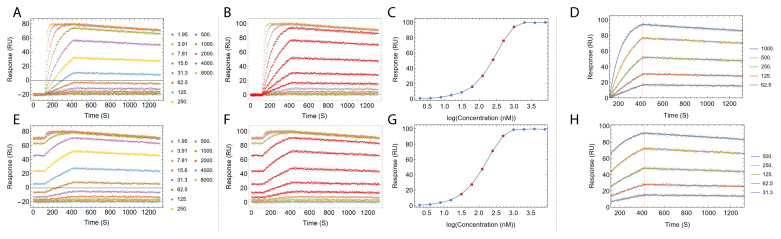
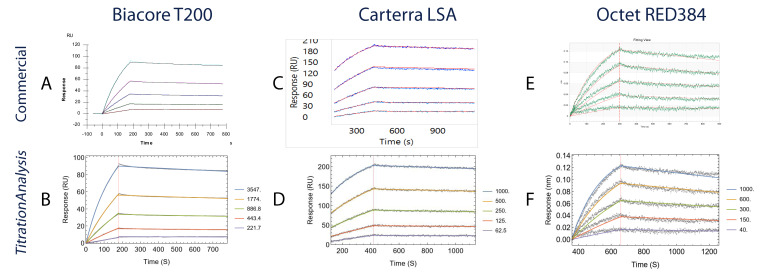
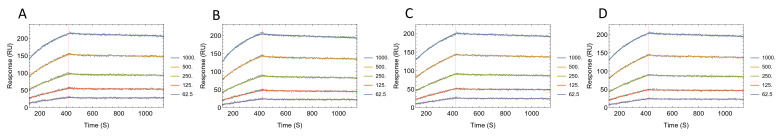
Label-free techniques including Surface Plasmon Resonance (SPR) and Biolayer Interferometry (BLI) are biophysical tools widely used to collect binding kinetics data of bimolecular interactions. To efficiently analyze SPR and BLI binding kinetics data, we have built a new high throughput analysis tool named the TitrationAnalysis. It can be used as a package in the Mathematica scripting environment and ultilize the non-linear curve-fitting module of Mathematica for its core function. This tool can fit the binding time course data and estimate association and dissociation rate constants ( k a and k d respectively) for determining apparent dissociation constant ( K D ) values. The high throughput fitting process is automatic, requires minimal knowledge on Mathematica scripting and can be applied to data from multiple label-free platforms. We demonstrate that the TitrationAnalysis is optimal to analyze antibody-antigen binding data acquired on Biacore T200 (SPR), Carterra LSA (SPR imaging) and ForteBio Octet Red384 (BLI) platforms. The k a , k d and K D values derived using TitrationAnalysis very closely matched the results from the commercial analysis software provided specifically for these instruments. Additionally, the TitrationAnalysis tool generates user-directed customizable results output that can be readily used in downstream Data Quality Control associated with Good Clinical Laboratory Practice operations. With the versatility in source of data input source and options of analysis result output, the TitrationAnalysis high throughput analysis tool offers investigators a powerful alternative in biomolecular interaction characterization.
Keywords: Biolayer Interferometry; Surface Plasmon Resonance; antibody binding; high-throughput kinetics analysis; non-linear curve fitting.
Copyright: © 2024 Li K et al.
Conflict of interest statement
No competing interests were disclosed.
Figures
Similar articles
-
High-Throughput Epitope Binning Analysis of Human Monoclonal Antibodies to Assess Epitope Diversity Using the Octet Bio-Layer Interferometry Platform.Methods Mol Biol. 2025;2937:297-323. doi: 10.1007/978-1-0716-4591-8_18. Methods Mol Biol. 2025. PMID: 40593428
-
Cost-effectiveness of using prognostic information to select women with breast cancer for adjuvant systemic therapy.Health Technol Assess. 2006 Sep;10(34):iii-iv, ix-xi, 1-204. doi: 10.3310/hta10340. Health Technol Assess. 2006. PMID: 16959170
-
Short-Term Memory Impairment.2024 Jun 8. In: StatPearls [Internet]. Treasure Island (FL): StatPearls Publishing; 2025 Jan–. 2024 Jun 8. In: StatPearls [Internet]. Treasure Island (FL): StatPearls Publishing; 2025 Jan–. PMID: 31424720 Free Books & Documents.
-
Magnetic resonance perfusion for differentiating low-grade from high-grade gliomas at first presentation.Cochrane Database Syst Rev. 2018 Jan 22;1(1):CD011551. doi: 10.1002/14651858.CD011551.pub2. Cochrane Database Syst Rev. 2018. PMID: 29357120 Free PMC article.
-
A New Measure of Quantified Social Health Is Associated With Levels of Discomfort, Capability, and Mental and General Health Among Patients Seeking Musculoskeletal Specialty Care.Clin Orthop Relat Res. 2025 Apr 1;483(4):647-663. doi: 10.1097/CORR.0000000000003394. Epub 2025 Feb 5. Clin Orthop Relat Res. 2025. PMID: 39915110
Cited by
-
Defining variant-resistant epitopes targeted by SARS-CoV-2 antibodies: A global consortium study.Science. 2021 Oct 22;374(6566):472-478. doi: 10.1126/science.abh2315. Epub 2021 Sep 23. Science. 2021. PMID: 34554826 Free PMC article.
-
High-density binding to Plasmodium falciparum circumsporozoite protein repeats by inhibitory antibody elicited in mouse with human immunoglobulin repertoire.PLoS Pathog. 2022 Nov 28;18(11):e1010999. doi: 10.1371/journal.ppat.1010999. eCollection 2022 Nov. PLoS Pathog. 2022. PMID: 36441829 Free PMC article.
-
Cryptic-site-specific antibodies to the SARS-CoV-2 receptor binding domain can retain functional binding affinity to spike variants.J Virol. 2023 Dec 21;97(12):e0107023. doi: 10.1128/jvi.01070-23. Epub 2023 Nov 29. J Virol. 2023. PMID: 38019013 Free PMC article.
-
Binding Kinetics and Epitope Binning Using Surface Plasmon Resonance.Methods Mol Biol. 2025;2937:277-295. doi: 10.1007/978-1-0716-4591-8_17. Methods Mol Biol. 2025. PMID: 40593427
-
FASTIA: A rapid and accessible platform for protein variant interaction analysis demonstrated with a single-domain antibody.Protein Sci. 2025 Mar;34(3):e70065. doi: 10.1002/pro.70065. Protein Sci. 2025. PMID: 39981938 Free PMC article.
References
-
- Bartollino S: Surface Plasmon Resonance technology to assess biological interactions. Insights Biol Med. 2017;1:039–044. 10.29328/journal.hjbm.1001005 - DOI
MeSH terms
LinkOut - more resources
Full Text Sources
Research Materials