. 2023 Jan-Dec:32:9636897231211202.
doi: 10.1177/09636897231211202.

LINC01140 Hinders the Development of Breast Cancer Through Targeting miR-200b-3p to Downregulate DMD

Affiliations

LINC01140 Hinders the Development of Breast Cancer Through Targeting miR-200b-3p to Downregulate DMD

Gongling Peng et al. Cell Transplant. 2023 Jan-Dec.

Abstract

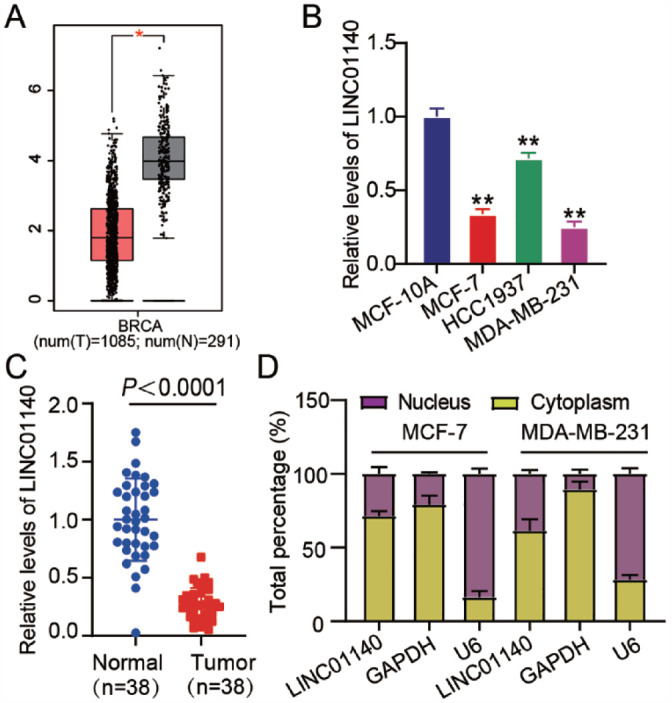
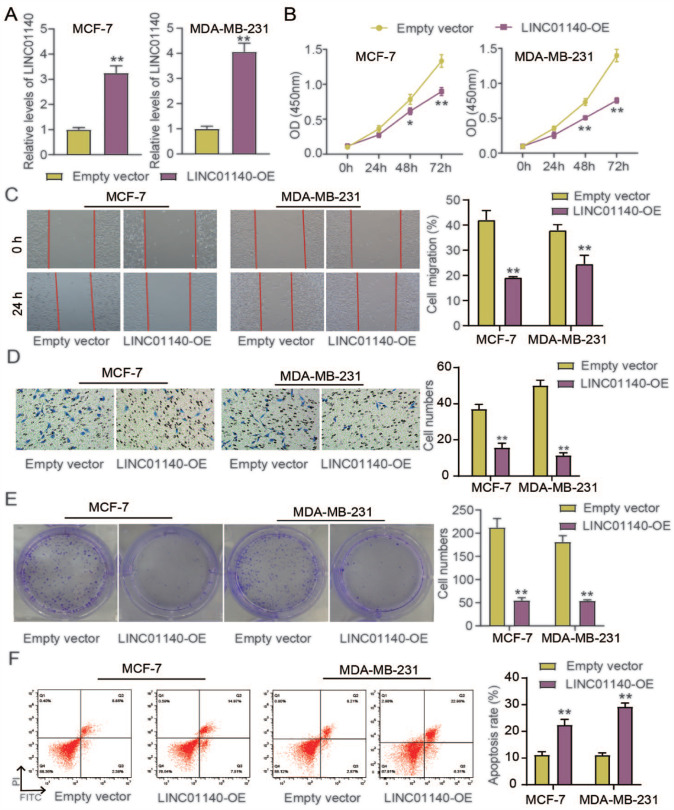
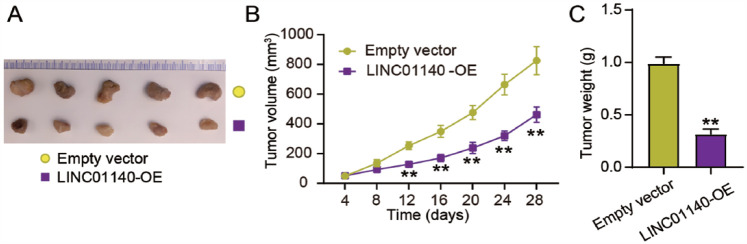
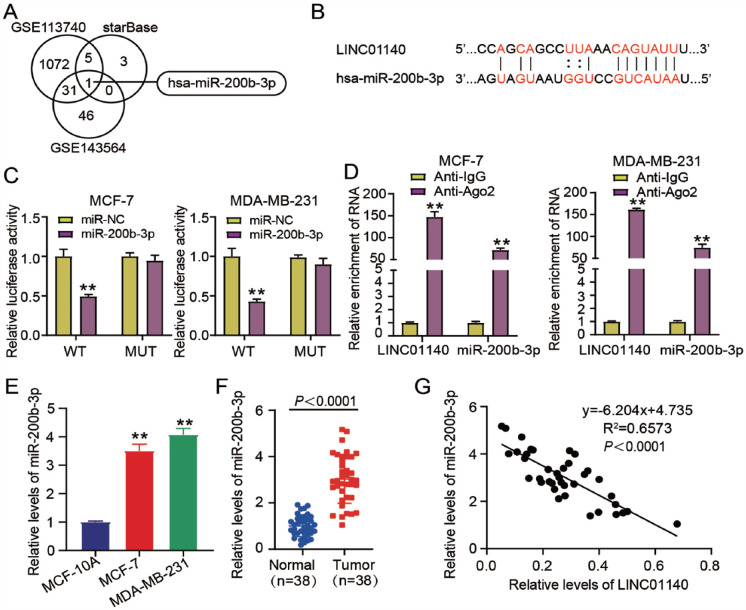
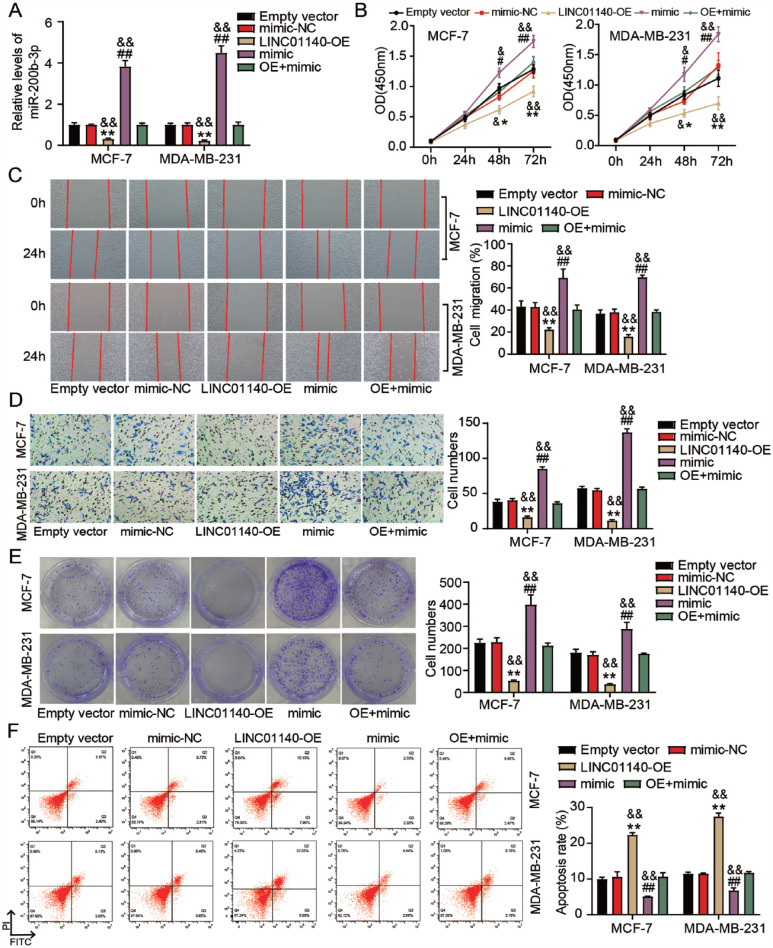
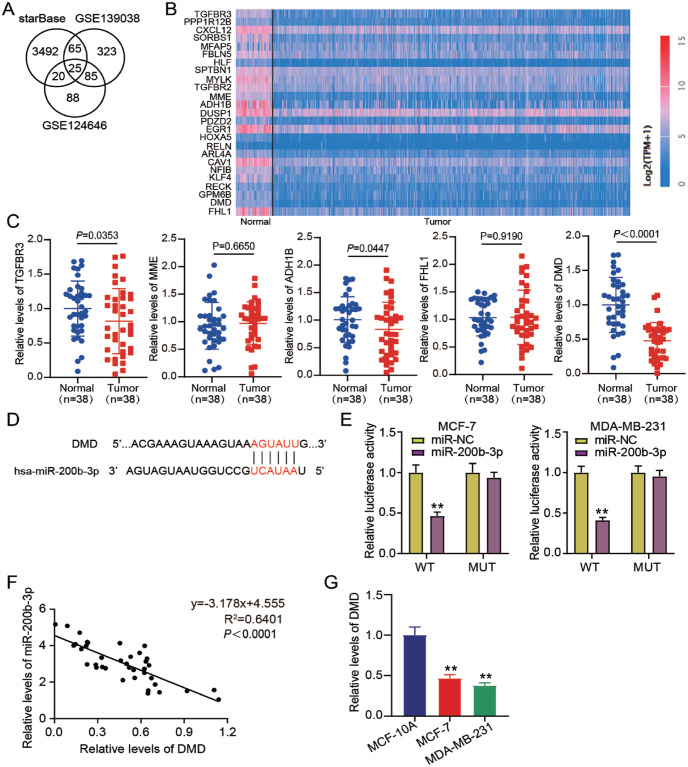
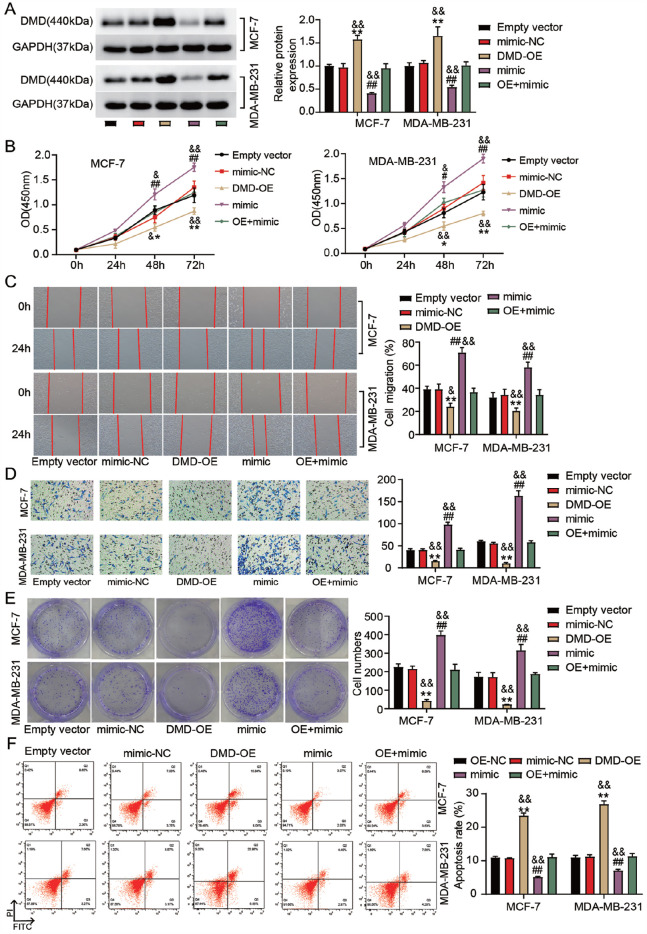
Long non-coding RNAs (lncRNAs) are frequently reported to be involved in breast cancer (BC) oncogenicity. The goal of this study was to probe lncRNA LINC01140's role and action mechanism in BC. Relative LINC01140, miR-200b-3p, and dystrophin (DMD) levels were determined using quantitative real-time polymerase chain reaction (qRT-PCR). DMD protein levels in BC cells were quantified using Western blotting, and the targeting relationships were validated by luciferase reporter assays and RNA immunoprecipitation experiments. The proliferative potential of the cells was evaluated using CCK-8 and colony formation tests, while the migratory and invasive abilities of the cells were assessed using scratch and transwell assays. Apoptosis was assessed by flow cytometry. Nude mouse models have been established to allow the examination of tumor growth in vivo. Pronounced downregulation of LINC01140 and DMD, as well as upregulation of miR-200b-3p, was observed in BC. LINC01140 binds directly to miR-200b-3p to downregulate DMD expression. Ectopic LINC01140 expression not only limited tumor growth in vivo but also diminished the proliferation, migration, and invasion abilities of BC cells in vitro, however, it induced apoptosis in BC cells. Elevated miR-200b-3p expression stimulated the tumorigenic potential of BC cells and attenuated the suppressive effect of LINC01140 or DMD overexpression on BC cell malignancy, whereas DMD overexpression restricted the tumorigenic potential of BC cells. Overall, LINC01140 prevents BC development via the miR-200b-3p-DMD axis. These findings support the latent potential and usefulness of the LINC01140-miR-200b-3p-DMD network as a target for BC therapy.

Keywords: DMD; LINC01140; breast cancer; lncRNA; miR-200b-3p.


Conflict of interest statement

Declaration of Conflicting InterestsThe author(s) declared no potential conflicts of interest with respect to the research, authorship, and/or publication of this article.

Figures

Figure 1.
Figure 1.
The LINC01140 expression is downregulated in BC. (A) An online tool GEPIA analyzed the LINC01140 expression in BC samples and normal samples. *adj. P < 0.01. T, tumor. N, normal. (B) The expression levels of LINC01140 in BC cell lines (HCC1937, MDA-MB-231, and MCF-7) and normal breast epithelial cells (MCF-10A) cells were estimated through qRT-PCR. **P < 0.01 vs MCF-10A using ANOVA. (C) LINC01140 levels among the BC tumors and paired adjacent normal tissues were quantified by means of qRT-PCR. P < 0.0001 vs normal using Student’s t test. (D) LINC01140 expression within the cytoplasm and nuclei of MDA-MB-231 and MCF-7 cells was assessed by subcellular fractionation experiment. The data are presented as the mean ± SD. BC: breast cancer; GEPIA: Gene Expression Profiling Interactive Analysis; ANOVA: analysis of variance; qRT-PCR: quantitative real-time polymerase chain reaction.
Figure 2.
Figure 2.
The tumorigenic capacities of BC cells are repressed by the ectopic expression of LINC01140 in vitro. (A) LINC01140 expression in MCF-7 and MDA-MB-231 cells after transfection of LINC01140-OE or empty vector was assessed through qRT-PCR. (B) The viability of MCF-7 and MDA-MB-231 cells harboring an empty vector or LINC01140-OE vector was measured through CCK-8 test. *P < 0.05, **P < 0.01 vs empty vector using ANOVA. (C) Cell migration rate was assessed by scratch experiment in MCF-7 and MDA-MB-231 cells after transfection of LINC01140-OE or empty vector. Scale bar: 100 μm. (D) The number of invasive BC cells with empty vector or LINC01140-OE transfections was assessed via transwell experiment. Scale bar: 50 μm. (E) The number of BC cell colonies, after their transfections with LINC01140-OE or empty vector, was measured by the colony formation assay. (F) The apoptosis rate of BC cells after transfection of LINC01140-OE or empty vector was measured by flow cytometry. **P < 0.01 vs empty vector using Student’s t test. The data are presented as the mean ± SD. LINC01140-OE, LINC01140 overexpression vector. BC: breast cancer; ANOVA: analysis of variance; qRT-PCR: quantitative real-time polymerase chain reaction.
Figure 3.
Figure 3.
LINC01140 overexpression limits tumor growth in vivo. The solid tumor image (A), tumor volume (B), and tumor weight (C) of the mouse xenograft model after injection of MCF-7 cells stably transfected with LINC01140-OE/empty vector. **P < 0.01 vs empty vector using Student’s t test. The data are presented as the mean ± SD. LINC01140-OE, LINC01140 overexpression vector.
Figure 4.
Figure 4.
LINC01140 binds to miR-200b-3p. (A) miR-200b-3p was overlapped from two miRNA microarrays (GSE113740 and GSE143564) and StarBase. Two miRNA microarrays from GEO Datasets were used to screen the upregulated miRNAs in BC with adj. P < 0.05 and logFC > 2. An online tool StarBase was used to predict the miRNAs binding to LINC01140. (B) StarBase predicted LINC01140–miR-200b-3p binding site. (C) Luciferase activities in BC cells with the transfection of pGL3-LINC01140-WT/pGL3-LINC01140-MUT and miR-200b-3p mimic/mimic-NC were estimated through the dual luciferase reporter experiment. WT: LINC01140 wild-type vectors. MUT: LINC01140 mutant vectors. **P < 0.01 vs LINC01140-WT + mimic-NC using ANOVA. (D) RIPA was done to validate the interaction of LINC01140 with miR-200b-3p in BC cells. **P < 0.01 vs Anti-IgG using Student’s t test. (E) The miR-200b-3p levels in normal breast epithelial cells (MCF-10A) cells and BC cells (MDA-MB-231 and MCF-7) were quantified through qRT-PCR. **P < 0.01 vs MCF-10A using ANOVA. (F) The miR-200b-3p levels in paired adjacent normal and BC tissues were gauged through qRT-PCR. P < 0.0001 vs normal using Student’s t test. (G) The correlation of LINC01140 expression in BC tissues with that of miR-200b-3p was ascertained by the Pearson correlation coefficient. The data are presented as the mean ± SD. GSE: gene set enrichment analysis; GEO: Gene Expression Omnibus data base; BC: breast cancer; ANOVA: analysis of variance; RIP: Radioimmunoprecipitation assay; NC: negative control; qRT-PCR: quantitative real-time polymerase chain reaction.
Figure 5.
Figure 5.
LINC01140 overexpression prohibits the development of BC in vitro by regulating miR-200b-3p. (A) MiR-200b-3p levels in MCF-7 and MDA-MB-231 cells with the transfection of mimic-NC, LINC01140-OE, miR-200b-3p mimic, OE + mimic, or empty vector were assessed via qRT-PCR. (B) The viability of the BC cells transfected with the above plasmids was evaluated by means of CCK-8 test. (C) Cell migration rate in the BC cells with the transfection of above plasmids was assessed by scratch experiment. Scale bar: 100 μm. (D) The number of invasive BC cells with the above plasmids transfection was detected by transwell experiment. Scale bar: 50 μm. (E) The colony number of BC cells transfected with the above plasmids were determined in the colony formation assays. (F) Cell apoptosis rate in BC cells transfected with the above plasmids was detected by flow cytometry. *P < 0.05, **P < 0.01 vs empty vector using ANOVA. #P < 0.05, ##P < 0.01 vs mimic-NC using ANOVA. &P < 0.05, &&P < 0.01 vs OE + mimic using ANOVA. The data are presented as the mean ± SD. LINC01140-OE, LINC01140 overexpression vector. mimic, miR-200b-3p mimic. OE + mimic, co-transfection of LINC01140 overexpression vector and miR-200b-3p mimic. BC: breast cancer; NC: negative control; CCK: Cell Counting Kit; ANOVA: analysis of variance; OE: overexpressing; qRT-PCR: quantitative real-time polymerase chain reaction.
Figure 6.
Figure 6.
MiR-200b-3p further targets DMD. (A) Twenty-five genes were overlapped from two mRNA microarrays (GSE139038 and GSE124646) and StarBase. Two mRNA microarrays from GEO Datasets were used to screen the downregulated mRNAs in BC with adj. P < 0.05 and logFC < –2. An online tool StarBase was used to predict the targeted genes of miR-200b-3p. (B) The expression of 25 genes in TCGA-BC samples. (C) qRT-PCR detected the levels of five genes (TGFBR3, MME, ADH1B, FHL1, and DMD) in BC tissues and paired adjacent normal tissues. P < 0.0001 vs normal using Student’s t test. (D) StarBase predicted miR-200b-3p–DMD binding site. (E) The target relationship between miR-200b-3p and DMD was verified by the dual luciferase reporter experiment in MDA-MB-231 and MCF-7 cells. WT: DMD wild-type vectors. MUT: DMD mutant vectors. **P < 0.01 vs DMD-WT + mimic-NC using ANOVA. (F) The correlation of miR-200b-3p expression in BC tissues with that of DMD was ascertained by the Pearson correlation coefficient. (G) DMD levels in normal breast epithelial cells (MCF-10A) cells and BC cell lines (MCF-7 and MDA-MB-231) were estimated via qRT-PCR. **P < 0.01 vs MCF-10A using ANOVA. The data are presented as the mean ± SD. DMD: dystrophin; GSE: gene set enrichment analysis; GEO: Gene Expression Omnibus data base; BC: breast cancer; TCGA: The Cancer Genome Atlas; TGFBR3: transforming growth factor beta receptor 3; MME: membrane metalloendopeptidase; ADH1B: alcohol dehydrogenase 1B (classI), beta polypeptide; FHL1: four and a half LIM domains 1; NC: negative control; ANOVA: analysis of variance; qRT-PCR: quantitative real-time polymerase chain reaction.
Figure 7.
Figure 7.
MiR-200b-3p upregulation accelerates the development of BC by controlling DMD expression. (A) The protein levels of DMD in MCF-7 and MDA-MB-231 cells were assessed via Western blotting after transfecting the cells with empty vector, mimic-NC, DMD-OE, miR-200B-3p mimic, or OE + mimic. (B) The viability of MCF-7 and MDA-MB-231 cells harboring empty vector, mimic-NC, DMD-OE, miR-200B-3p mimic, or OE + mimic was evaluated through CCK-8 test. (C) Cell migration rate in MCF-7 and MDA-MB-231 cells transfected with empty vector, mimic-NC, DMD-OE, miR-200B-3p mimic, or OE + mimic was assessed by scratch experiment. Scale bar: 100 μm. (D) The number of invasive MCF-7 and MDA-MB-231 cells transfected with empty vector, mimic-NC, DMD-OE, miR-200B-3p mimic, or OE + mimic was assessed by transwell assay. Scale bar: 50 μm. (E) The colony number of MCF-7 and MDA-MB-231 cells, after their empty vector, mimic-NC, DMD-OE, miR-200B-3p mimic, or OE + mimic transfections were measured by colony formation experiment. (F) Cell apoptosis rate in MCF-7 and MDA-MB-231 cells transfected with empty vector, mimic-NC, DMD-OE, miR-200B-3p mimic, or OE + mimic was detected by flow cytometry. *P < 0.05, **P < 0.01 vs empty vector using ANOVA. #P < 0.05, ##P < 0.01 vs mimic-NC using ANOVA. &P < 0.05, &&P < 0.01 vs OE + mimic using ANOVA. The data are presented as the mean ± SD. DMD-OE, DMD overexpression vector. mimic, miR-200b-3p mimic. OE + mimic, co-transfection of DMD overexpression vector and miR-200b-3p mimic. DMD: dystrophin; NC: negative control; BC: breast cancer; OE: overexrepssion; CCK: Cell Counting Kit; ANOVA: analysis of variance.

Similar articles

Cited by

References

    1. Rossi S, Schinzari G, Basso M, Strippoli A, Dadduzio V, D’Argento E, Cassano A, Barone C. Maintenance hormonal and chemotherapy treatment in metastatic breast cancer: a systematic review. Future Oncol. 2016;12(10):1299–307. - PubMed
    1. Fitzmaurice C, Allen C, Barber RM, Barregard L, Bhutta ZA, Brenner H, Dicker DJ, Chimed-Orchir O, Dandona R, Dandona L, Fleming T, et al.. Global, regional, and national cancer incidence, mortality, years of life lost, years lived with disability, and disability-adjusted life-years for 32 cancer groups,1990 to 2015: a systematic analysis for the Global Burden of Disease Study. JAMA Oncol. 2017;3(4):524–48. - PMC - PubMed
    1. Li Y, Moran MS, Huo Q, Yang Q, Haffty BG. Post-mastectomy radiotherapy for breast cancer patients with t1-t2 and 1-3 positive lymph nodes: a meta-analysis. PLoS ONE. 2013;8(12):e81765. - PMC - PubMed
    1. Siegel R, Ma J, Zou Z, Jemal A. Cancer statistics, 2014. CA Cancer J Clin. 2014;64(1):9–29. - PubMed
    1. Siegel RL, Miller KD, Jemal A. Cancer statistics, 2018. CA Cancer J Clin. 2018;68(1):7–30. - PubMed

Publication types