. 2023 Nov;13(11):e1480.
doi: 10.1002/ctm2.1480.

C9orf142 transcriptionally activates MTBP to drive progression and resistance to CDK4/6 inhibitor in triple-negative breast cancer

Affiliations

C9orf142 transcriptionally activates MTBP to drive progression and resistance to CDK4/6 inhibitor in triple-negative breast cancer

Li Liao et al. Clin Transl Med. 2023 Nov.

Abstract

Background: Triple-negative breast cancer (TNBC) presents the most challenging subtype of all breast cancers because of its aggressive clinical phenotypes and absence of viable therapy targets. In order to identify effective molecular targets for treating patients with TNBC, we conducted an integration analysis of our recently published TNBC dataset of quantitative proteomics and RNA-Sequencing, and found the abnormal upregulation of chromosome 9 open reading frame 142 (C9orf142) in TNBC. However, the functional roles of C9orf142 in TNBC are unclear.

Methods: In vitro and in vivo functional experiments were performed to assess potential roles of C9orf142 in TNBC. Immunoblotting, real-time quantitative polymerase chain reaction (RT-qPCR), and immunofluorescent staining were used to investigate the expression levels of C9orf142 and its downstream molecules. The molecular mechanisms underlying C9orf142-regulated mouse double minute 2 (MDM2)-binding protein (MTBP) were determined by chromatin immunoprecipitation (ChIP) and dual-luciferase reporter assays.

Results: In TNBC tissues and metastatic lymph nodes, we observed that C9orf142 exhibited abnormal up-regulation, and its elevated expression was indicative of unfavorable prognosis for TNBC patients. Both in vitro and in vivo functional experiments demonstrated that C9orf142 accelerated TNBC growth and metastasis. Further mechanism exploration revealed that C9orf142 transcriptionally activated MTBP, thereby regulating its downstream MDM2/p53/p21 signaling axis and the transition of cell cycle from G1 to S phase. Functional rescue experiment demonstrated that knockdown of MTBP attenuated C9orf142-mediated tumour growth and metastasis. Furthermore, depletion of C9orf142 remarkably increased the responsiveness of TNBC cells to CDK4/6 inhibitor abemaciclib.

Conclusions: Together, these findings unveil a previously unrecognized effect of C9orf142 in TNBC progression and responsiveness to CDK4/6 inhibitor, and emphasize C9orf142 as a promising intervention target for TNBC treatment.

Keywords: C9orf142; CDK4/6 inhibitor; MTBP; cancer progression; triple-negative breast cancer.


Conflict of interest statement

The authors declare no potential conflicts of interest.

Figures

FIGURE 1
FIGURE 1
C9orf142 is aberrantly up‐regulated in TNBC tissues and its high expression predicts poor prognosis of TNBC patients. (A) Schematic diagram depicting the screening of metastasis‐promoting oncogenes using the quantitative proteomic dataset and RNA‐Seq dataset from Fudan University Shanghai Cancer Center (FUSCC)‐TNBC project cohort. LM, lymph node metastasis. (B and C) Protein expression levels of C9orf142 in 90 TNBC tissues and 72 adjacent normal tissues in the FUSCC‐TNBC proteomic dataset. (D and E) C9orf142 mRNA expression levels in 360 TNBC tissues and 88 adjacent normal tissues in the FUSCC‐TNBC RNA‐Seq dataset. (F) Protein expression levels of C9orf142 in TNBC tissues with or without lymph node metastasis. (G) C9orf142 mRNA levels in TNBC tissues with or without lymph node metastasis. (H and I) Correlation between C9orf142 mRNA levels and tumour size (H) as well as clinical stage (I). (J) Quantitative results of C9orf142 protein expression levels in 18 pairs of TNBC tissues and matched normal breast tissues. Corresponding immunoblotting images are shown in Figure S1F. (K and L) Kaplan–Meier analysis of the overall survival (K) and relapse‐free survival (L) of TNBC patients with high or low expression levels of C9orf142 using Kaplan–Meier Plotter database (http://kmplot.com/analysis/index.php?p = service). *p < 0.05; **p < 0.01; ***p < 0.001; ns, no significance.
FIGURE 2
FIGURE 2
C9orf142 promotes TNBC cell growth both in vitro and in vivo. (A) Immunoblotting analysis of C9orf142 protein expression levels in two human mammary epithelial cell lines and seven human TNBC cell lines. (B and C) Immunoblotting analysis of C9orf142 expression status in SUM159 and MDA‐MB‐231 cells stably expressing empty vector pCDH or Flag‐C9orf142 (B) and in Hs578T and LM2‐4175 cells stably expressing empty vector shNC or shC9orf142 (#1 and #2) (C). (D–F) SUM159 and MDA‐MB‐231 cells stably expressing empty vector pCDH or Flag‐C9orf142 were subjected to CCK‐8 (D) and colony formation assays (E–F). Representative images of survival colonies (E) and corresponding quantitative results (F) are shown. (G–I) Hs578T and LM2‐4175 cells stably expressing empty vector shNC or shC9orf142 (#1 and #2) were subjected to CCK‐8 (G) and colony formation assays (H–I). Representative images of survival colonies (H) and corresponding quantitative results (I) are shown. (J) Flow cytometry analysis of cell‐cycle distribution of Hs578T or LM2‐4175 cells stably expressing empty vector shNC and shC9orf142 (#1 and #2). (K–N) A total of 1 × 10⁶ LM2‐4175 cells stably expressing shNC or shC9orf142 (#1 and #2) were inoculated into mammary fat pads of 6‐week‐old BALB/c female nude mice (n = 10). After 26 days of injection, mice were sacrificed and xenograft tumours were removed. Schematic diagram depicting experimental procedure (K), image of removed xenograft tumours (L), tumour volume (M) and tumour weight (N) are shown. Panel K was created with BioRender.com. *p < 0.05; **p < 0.01; ***p < 0.001; ns, no significance.
FIGURE 3
FIGURE 3
C9orf142 promotes migratory and invasive potential of TNBC cells in vitro and lung metastatic potential in vivo. (A–D) SUM159 and MDA‐MB‐231 cells stably expressing empty vector pCDH or Flag‐C9orf142 were subjected to Transwell migration assays (A and B) and Matrigel‐coated invasion assays (C and D). Representative images of migrated and invaded cells are shown in A and C, and corresponding quantitative results are shown in B and D, respectively. (E–H) Hs578T and LM2‐4175 cells stably expressing empty vector shNC or shC9orf142 (#1 and #2) were subjected to Transwell migration assays (E and F) and Matrigel‐coated invasion assays (G and H). Representative images of migrated and invaded cells are shown in E and G, and corresponding quantitative results are shown in F and H, respectively. (I–M) A total of 5 × 10⁵ LM2‐4175 cells stably expressing shNC or shC9orf142 (#1 and #2) were inoculated into mammary fat pads of 6‐week‐old BALB/c female nude mice (n = 10). After 8 weeks of injection, mice were sacrificed and lungs were removed. Schematic diagram depicting experimental procedure (I), representative images of lung metastasis (J), representative images of HE (hematoxylin‐eosin) staining of lung tissues (K), the number of metastasized nodes in the lungs (L) and the incidence of lung metastasis (M) are shown, respectively. Panel 3I was created with BioRender.com. *p < 0.05; **p < 0.01; ***p < 0.001; ns, no significance.
FIGURE 4
FIGURE 4
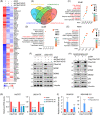
C9orf142 transcriptionally regulates MTBP expression. (A) LM2‐4175 cells stably expressing shNC and shC9orf142 (#1 and #2) were subjected to label‐free quantitative proteomic analysis. The numbers of differentially expressed proteins between cells expressing shNC and shC9orf142 based on the cut‐off value of 1.5‐fold change are shown. (B) Heatmap of the top 30 up‐regulated and down‐regulated proteins in LM2‐4175 cells stably expressing shNC and shC9orf142 (#1 and #2). (C and D) Gene ontology‐biological process (GO‐BP) (C) and GO‐molecular function (GO‐MF) (D) of differentially expressed proteins between cells expressing shNC and shC9orf142. (E) KEGG pathway analysis of differentially expressed proteins between cells expressing shNC and shC9orf142. (F and G) Hs578T and LM2‐4175 cells stably expressing shNC and shC9orf142 (#1 and #2) were subjected to immunoblotting assays with the indicated antibodies (F) and RT‐qPCR analysis (G). (H and I) SUM159 and MDA‐MB‐231 (MDA‐231) cells stably expressing pCDH and Flag‐C9orf142 were subjected to immunoblotting assays with the indicated antibodies (H) and RT‐qPCR analysis (I). *p < 0.05; **p < 0.01; ***p < 0.001; ns, no significance.
FIGURE 5
FIGURE 5
C9orf142 is recruited to the MTBP promoter and enhances its promoter activity. (A) Line diagram showing the regions of the MTBP promoter used for ChIP‐qPCR assays. (B and C) SUM159 and MDA‐MB‐231 cells stably expressing empty vector pCDH or Flag‐C9orf142 were subjected to ChIP assays and followed by RT‐qPCR assays (primer #3 and #4). The ChIP assays were carried out using an anti‐Flag antibody or IgG, where IgG was used as a negative control. Recruitment of Flag‐C9orf142 to the MTBP promoter was normalized to Input. Representative results of primer #1 and #2 are shown in Figure S3B and S3C. (D) Line diagram showing the regions of the MTBP promoter used for dual‐luciferase reporter assays. (E) HEK293T cells stably expressing pCDH or Flag‐C9orf142 were transfected with a luciferase reporter construct encoding pGL3 or pGL3‐MTBP (#1, #2, #3 and #4, respectively). Relative fluorescence activity was normalized to co‐transfected Renilla luciferase. (F) HEK293T cells stably expressing pCDH or Flag‐C9orf142 were transfected with a luciferase reporter construct encoding pGL3 or pGL3‐MTBP (#3 and #4 in combination). Relative fluorescence activity was normalized to co‐transfected Renilla luciferase. (G) HEK293T cells stably expressing shNC or shC9orf142 (#1 and #2) were transfected with a luciferase reporter construct encoding pGL3 or pGL3‐MTBP (#3 and #4 in combination). Relative fluorescence activity was normalized to co‐transfected Renilla luciferase. *p < 0.05; **p < 0.01; ***p < 0.001; ns, no significance.
FIGURE 6
FIGURE 6
C9orf142 accelerates TNBC progression via regulating MTBP expression. (A) SUM159 and MDA‐MB‐231 cells stably expressing pCDH or Flag‐C9orf142 were transfected with shNC or shMTBP #3. After 48 h of transfection, cells were subjected to immunoblotting analysis with the indicated antibodies. (B and C) SUM159 and MDA‐MB‐231 cells stably expressing pCDH or Flag‐C9orf142 alone or in combination with shNC or shMTBP #3 were subjected to CCK‐8 (B) and colony formation assays (C). Representative images of survival colonies are shown inFigure S4B. (D and E) SUM159 and MDA‐MB‐231 cells stably expressing pCDH or Flag‐C9orf142 alone or in combination with shNC or shMTBP #3 were subjected to Transwell migration assays (D) and Matrigel‐coated invasion assays (E). Representative images of migrated and invaded cells are shown in Figure S4C andS4D. (F–H) A total of 3 × 10⁶ MDA‐MB‐231 cells stably expressing expressing pCDH or Flag‐C9orf142 alone or in combination with shNC or shMTBP #3 were inoculated into mammary fat pads of 6‐week‐old BALB/c female nude mice (n = 10). After 30 days of injection, mice were sacrificed and xenograft tumours were removed. Image of removed xenograft tumours (F), tumour volume (G), and tumour weight (H) are shown. (I‐K) A total of 1×10⁶ LM2‐4175 cells stably expressing shNC or shC9orf142 (#1 and #2) were injected into the tail vein of mammary fat pads of 7‐week‐old BALB/c female nude mice (n = 10). After 6 weeks of injection, mice were sacrificed and lungs were removed. Representative images of lung metastasis (I), representative images of HE staining of lung tissues (J), and the incidence of lung metastasis (K) are shown. *p < 0.05; **p < 0.01; ***p < 0.001; ns, no significance.
FIGURE 7
FIGURE 7
Knockdown of C9orf142 enhances the sensitivity of TNBC cells to abemaciclib both in vitro and in vivo. (A) Hs578T and LM2‐4175 stably expressing empty vector shNC or shC9orf142 (#1 and #2) were treated with or without increasing doses of abemaciclib. Cell viability was determined using CCK‐8 assays. The IC50 values are shown. (B and C) Hs578T and LM2‐4175 cells stably expressing empty vector shNC or shC9orf142 (#1 and #2) were treated without or with the indicated concentrations of abemaciclib and subjected to colony formation assays. Representative images of survival colonies and corresponding quantitative results are shown in B and C, respectively. (D–F) A total of 1 × 10⁶ LM2‐4175 cells stably expressing shNC or shC9orf142 (#1 and #2) were inoculated into mammary fat pads of 6‐week‐old BALB/c female nude mice (n = 20). After 16 days of injection, each group is randomly divided into two groups (n = 10), and the mice were administered with or without abemaciclib (25 mg/kg) by oral gavage once daily for 14 consecutive days. After 30 days of injection, mice were sacrificed and xenograft tumours were removed. Image of removed xenograft tumours (D), tumour volume (E) and tumour weight (F) are shown. (G) The proposed working model. C9orf142 transcriptionally activates MTBP and regulates its downstream MDM2/p53/p21 signaling axis and cell cycle transition from G1‐to‐S phase to drive the progression and resistance to CDK4/6 inhibitor in TNBC. *p < 0.05; **p < 0.01; ***p < 0.001; ns, no significance.

References

    1. Foulkes WD, Smith IE, Reis‐Filho JS. Triple‐negative breast cancer. N Engl J Med. 2010;363:1938‐1948. - PubMed
    1. Dent R, Trudeau M, Pritchard KI, et al. Triple‐negative breast cancer: clinical features and patterns of recurrence. Clin Cancer Res. 2007;13:4429‐4434. - PubMed
    1. Bianchini G, Balko JM, Mayer IA, Sanders ME, Gianni L. Triple‐negative breast cancer: challenges and opportunities of a heterogeneous disease. Nat Rev Clin Oncol. 2016;13:674‐690. - PMC - PubMed
    1. Hu Y, Gao J, Wang M, Li M. Potential prospect of CDK4/6 inhibitors in triple‐negative breast cancer. Cancer Manage Res. 2021;13:5223‐5237. - PMC - PubMed
    1. Asghar US, Barr AR, Cutts R, et al. Single‐cell dynamics determines response to CDK4/6 inhibition in triple‐negative breast cancer. Clin Cancer Res. 2017;23:5561‐5572. - PMC - PubMed

Publication types

MeSH terms