. 2024 Jan;11(3):e2305081.
doi: 10.1002/advs.202305081. Epub 2023 Nov 27.

Engineered Probiotic-Based Personalized Cancer Vaccine Potentiates Antitumor Immunity through Initiating Trained Immunity

Affiliations

Engineered Probiotic-Based Personalized Cancer Vaccine Potentiates Antitumor Immunity through Initiating Trained Immunity

Zhaoxia Chen et al. Adv Sci (Weinh). 2024 Jan.

Abstract

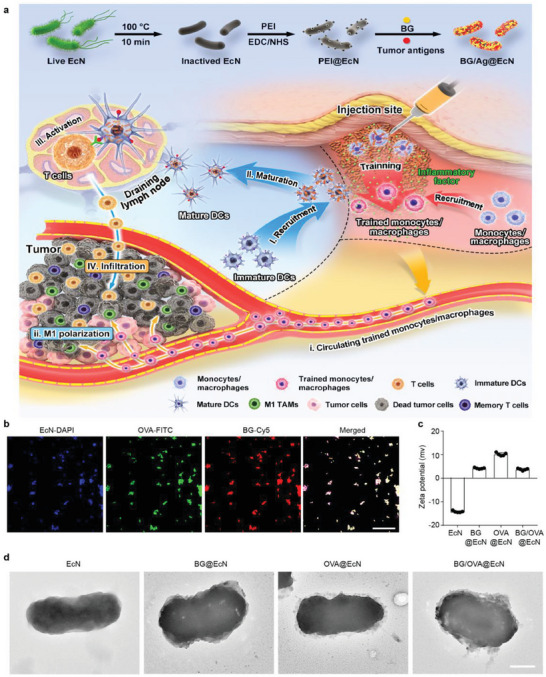
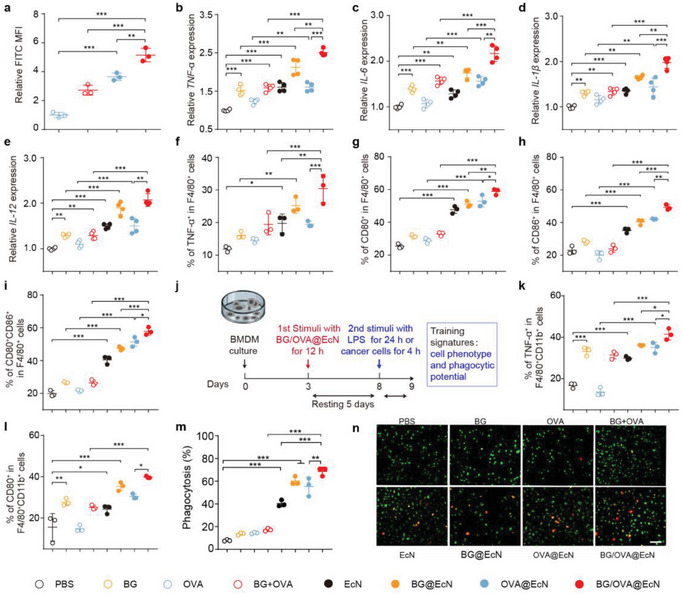
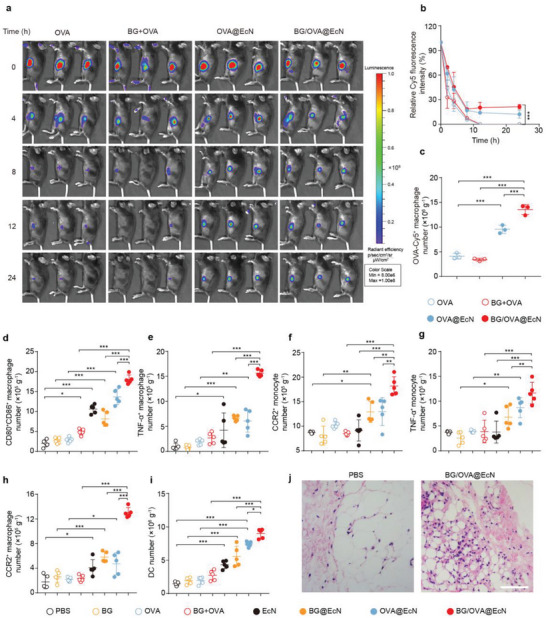
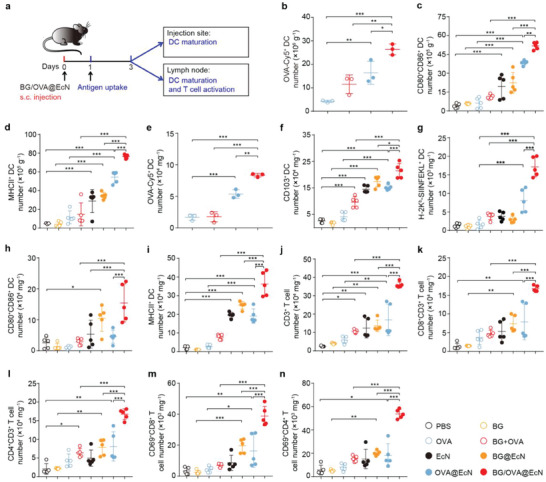
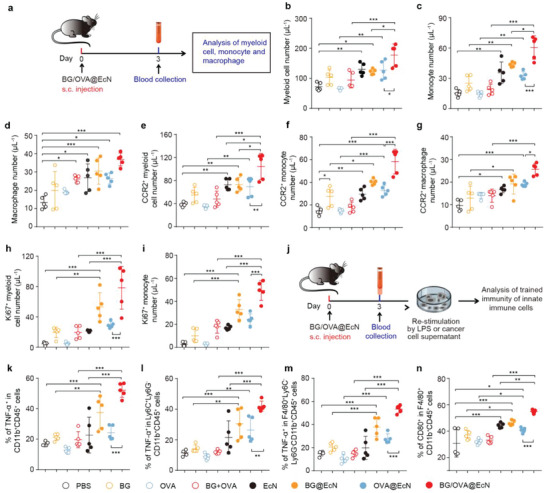
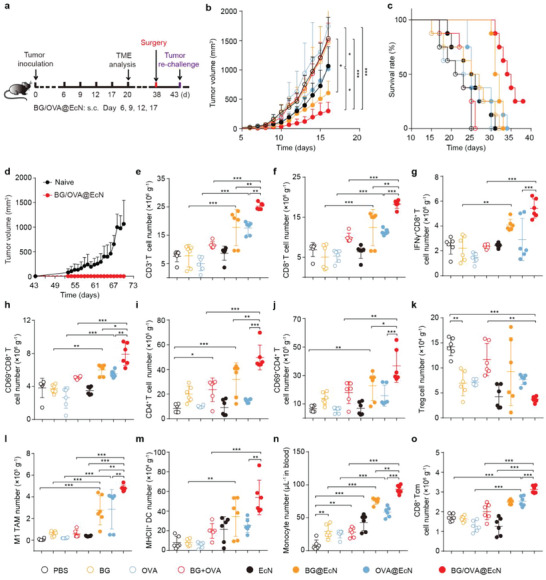
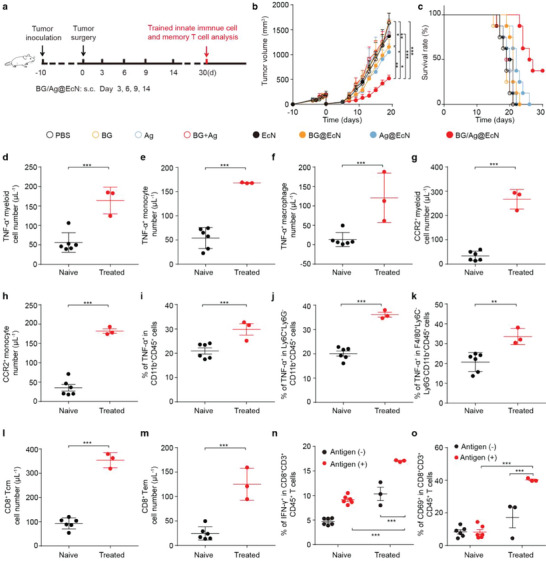
Cancer vaccines hold great potential for clinical cancer treatment by eliciting T cell-mediated immunity. However, the limited numbers of antigen-presenting cells (APCs) at the injection sites, the insufficient tumor antigen phagocytosis by APCs, and the presence of a strong tumor immunosuppressive microenvironment severely compromise the efficacy of cancer vaccines. Trained innate immunity may promote tumor antigen-specific adaptive immunity. Here, a personalized cancer vaccine is developed by engineering the inactivated probiotic Escherichia coli Nissle 1917 to load tumor antigens and β-glucan, a trained immunity inducer. After subcutaneous injection, the cancer vaccine delivering model antigen OVA (BG/OVA@EcN) is highly accumulated and phagocytosed by macrophages at the injection sites to induce trained immunity. The trained macrophages may recruit dendritic cells (DCs) to facilitate BG/OVA@EcN phagocytosis and the subsequent DC maturation and T cell activation. In addition, BG/OVA@EcN remarkably enhances the circulating trained monocytes/macrophages, promoting differentiation into M1-like macrophages in tumor tissues. BG/OVA@EcN generates strong prophylactic and therapeutic efficacy to inhibit tumor growth by inducing potent adaptive antitumor immunity and long-term immune memory. Importantly, the cancer vaccine delivering autologous tumor antigens efficiently prevents postoperative tumor recurrence. This platform offers a facile translatable strategy to efficiently integrate trained immunity and adaptive immunity for personalized cancer immunotherapy.

Keywords: antitumor immunity; cancer vaccines; probiotics; trained immunity; β-glucan.


Conflict of interest statement

The authors declare no conflict of interest.

Figures

Figure 1
Figure 1
Characterization of BG/OVA@EcN. a) Schematic illustration of BG/Ag@EcN as an efficient cancer vaccine to trigger antitumor immunity for enhanced cancer therapy. BG/Ag@EcN was obtained by modification of inactivated EcN with PEI and then loading BG and tumor antigens. After subcutaneous injection, the macrophages at the injection sites efficiently phagocytose BG/Ag@EcN to induce trained immunity. The trained macrophages secret proinflammatory cytokines to recruit monocytes/macrophages for further training by BG/Ag@EcN. Meanwhile, I) the proinflammatory cytokines secreted by the trained monocytes/macrophages efficiently recruit DCs, II) promoting DC phagocytosis of BG/Ag@EcN for DC maturation, III) T cell activation, and IV) T cell infiltration into tumor tissues. In addition, i) BG/OVA@EcN significantly increases the circulating trained monocytes/macrophages, resulting in ii) differentiating into M1‐like TAMs and improved tumor immunosuppressive microenvironment. b) Confocal microscopic images of BG/OVA@EcN in which BG was conjugated with Cy5, OVA was conjugated with FITC, and EcN was labeled with DAPI. Scale bar: 30 µm. c) Zeta potential of EcN, BG@EcN, OVA@EcN, and BG/OVA@EcN by DLS analysis, respectively. Data are presented as mean ± SD (n = 5). d) Representative TEM images of EcN, BG@EcN, OVA@EcN, and BG/OVA@EcN. Scale bar: 0.5 µm.
Figure 2
Figure 2
BG/OVA@EcN‐mediated training of monocytes/macrophages in vitro. a) Relative FITC mean fluorescence intensity (MFI) in RAW264.7 cells after treatment with free OVA, BG + OVA, OVA@EcN, or BG/OVA@EcN (OVA was conjugated with FITC) at the concentration of 3 × 10⁷ CFU mL‐1 EcN, 4 µg mL‐1 OVA, and 4 µg mL‐1 BG for 4 h by flow cytometry. Data are presented as mean ± SD (n = 3). b–e) mRNA expression levels of b) TNF‐α, c) IL‐6, d) IL‐1β, and e) IL‐12 in BMDMs after treatment with PBS, BG, OVA, BG + OVA, EcN, BG@EcN, OVA@EcN, and BG/OVA@EcN at the concentration of 3 × 10⁷ CFU mL‐1 EcN, 4 µg mL‐1 OVA, and 4 µg mL‐1 BG for 12 h by real‐time RT‐PCR. Data are presented as mean ± SD (n = 4). f–i) Percentages of f) TNF‐α+, g) CD80+, h) CD86+, and i) CD80+CD86+ cells in F4/80+ cells after BMDMs were treated as indicated in (b) by flow cytometry. Data are presented as mean ± SD (n = 3). j) Schematic schedule of in vitro BMDM training by BG/OVA@EcN. k) Percentages of TNF‐α+ and l) CD80+ cells in F4/80+CD11b+ cells after BMDMs were treated with PBS, BG, OVA, BG + OVA, EcN, BG@EcN, OVA@EcN, and BG/OVA@EcN at the concentration of 3 × 10⁷ CFU mL−1 EcN, 4 µg mL−1 OVA, and 4 µg mL‐1 BG for 12 h, followed by resting for 5 days and re‐stimulating with 100 ng mL−1 LPS for 24 h by flow cytometry. Data are presented as mean ± SD (n = 3). m) Phagocytosis ratios and n) representative images of DiR‐labeled B16‐OVA cells by CSFE‐labeled BMDMs after BMDMs were treated as indicated in (j) for 12 h, followed by resting for 5 days and then co‐culturing with DiR‐labeled B16‐OVA cells at the ratio of 1:1 for 4 h by flow cytometry and confocal microscopy, respectively. Scale bar: 100 µm. Data are presented as mean ± SD (n = 3). p values are calculated using one‐way ANOVA followed by Tukey's HSD post‐hoc test. * p < 0.05, ** p < 0.01, *** p < 0.001.
Figure 3
Figure 3
Monocyte/macrophage recruitment and activation induced by BG/OVA@EcN at the injection sites. a) Images and b) relative Cy5 fluorescence intensity at different time intervals after C57BL/6 mice were subcutaneously injected with OVA, BG + OVA, OVA@EcN, or BG/OVA@EcN (OVA was conjugated with Cy5) at the OVA dosage of 40 µg, BG dosage of 40 µg, and EcN dosage of 3 × 10⁸ CFU per mouse. Data are presented as mean ± SD (n = 3). c) Percentages of OVA‐Cy5+ cells in CD11b+F4/80+ cells at the injection sites of C57BL/6 mice at 24 h after treatment indicated in (a). Data are presented as mean ± SD (n = 3). d–i) Numbers of d) CD80+CD86+ macrophages, e) TNF‐α+ macrophages, f) CCR2+ monocytes, g) TNF‐α+ monocytes, h) CCR2+ macrophages, and i) total DCs (CD11c+CD11b+CD45+) at the injection sites of C57BL/6 mice at 3 days after subcutaneous injection of PBS, BG, OVA, BG + OVA, EcN, BG@EcN, OVA@EcN, or BG/OVA@EcN at the OVA dosage of 40 µg, BG dosage of 40 µg, and EcN dosage of 3 × 10⁸ CFU per mouse. Data are presented as mean ± SD (n = 5). j) H&E staining of injection sites of C57BL/6 mice at 3 days after subcutaneous injection of PBS or BG/OVA@EcN at the OVA dosage of 40 µg, BG dosage of 40 µg, and EcN dosage of 3 × 10⁸ CFU per mouse. Scale bar: 25 µm. p‐values are calculated using one‐way ANOVA followed by Tukey's HSD post hoc test. * p < 0.05, ** p < 0.01, *** p < 0.001.
Figure 4
Figure 4
BG/OVA@EcN‐induced enhanced adaptive antitumor immunity. a) Schematic schedule of evaluating the in vivo immune responses triggered by BG/OVA@EcN. b) Numbers of Cy5+CD11c+ cells at the injection sites of C57BL/6 mice at 24 h after subcutaneous injection of OVA, BG + OVA, OVA@EcN, or BG/OVA@EcN (OVA was conjugated with Cy5) at the OVA dosage of 40 µg, BG dosage of 40 µg, and EcN dosage of 3 × 10⁸ CFU per mouse. Data are presented as mean ± SD (n = 3). c) Numbers of CD80+CD86+ DCs and d) MHCII+ DCs at the injection sites of C57BL/6 mice at 3 days after subcutaneous injection of PBS, BG, OVA, BG + OVA, EcN, BG@EcN, OVA@EcN, or BG/OVA@EcN at the OVA dosage of 40 µg, BG dosage of 40 µg, and EcN dosage of 3 × 10⁸ CFU per mouse. Data are presented as mean ± SD (n = 5). e) Numbers of Cy5+CD11c+ cells at the draining lymph nodes of C57BL/6 mice at 24 h after subcutaneous injection of OVA, BG + OVA, OVA@EcN, or BG/OVA@EcN (OVA was conjugated with Cy5) at the OVA dosage of 40 µg, BG dosage of 40 µg, and EcN dosage of 3 × 10⁸ CFU per mouse. Data are presented as mean ± SD (n = 3). f–n) Numbers of f) CD103+ DCs, g) H‐2Kb‐SIINFEKL+ DCs, h) D80+CD86+ DCs, i) MHCII+ DCs, j) CD3+ T, k) CD8+ T, l) CD4+ T, m) the activated CD69+CD8+ T, and n) CD69+CD4+ T cells in draining lymph nodes of C57BL/6 mice at 3 days after treatment indicated in (a). Data are presented as mean ± SD (n = 5). p values are calculated using one‐way ANOVA followed by Tukey's HSD post‐hoc test. * p < 0.05, ** p < 0.01, *** p < 0.001.
Figure 5
Figure 5
BG/OVA@EcN‐mediated trained immunity of circulating monocytes/macrophages in blood. a) Schematic schedule of evaluating the circulating myeloid cells, monocytes, and macrophages after BG/OVA@EcN treatment. b–i) Numbers of b) myeloid cells, c) monocytes, d) macrophages, e) CCR2+ myeloid cells, f) CCR2+ monocytes, g) CCR2+ macrophages, h) Ki67+ myeloid cells, and i) Ki67+ monocytes in the blood of C57BL/6 mice at 3 days after subcutaneous injection of PBS, BG, OVA, BG + OVA, EcN, BG@EcN, OVA@EcN, or BG/OVA@EcN at the OVA dosage of 40 µg, BG dosage of 40 µg, and EcN dosage of 3 × 10⁸ CFU per mouse. Data are presented as mean ± SD (n = 5). j) Schematic schedule of evaluating the ex vivo trained immune responses triggered by BG/OVA@EcN. k) Percentages of TNF‐α+ myeloid cells, l) TNF‐α+ monocytes, and m) TNF‐α+ macrophages after the blood cells from the above‐treated C57BL/6 mice on day 3 were re‐stimulated with 100 ng mL−1 LPS for 24 h. Data are presented as mean ± SD (n = 5). n) Percentages of CD80+ macrophages after the blood cells from the above‐treated C57BL/6 mice on day 3 were re‐stimulated with the supernatants of B16‐OVA cells for 24 h. Data are presented as mean ± SD (n = 5). p values are calculated using one‐way ANOVA followed by Tukey's HSD post‐hoc test. * p < 0.05, ** p < 0.01, *** p < 0.001.
Figure 6
Figure 6
BG/OVA@EcN‐induced enhanced anticancer activity and antitumor immune response in subcutaneous B16‐OVA tumor‐bearing mice. a) Schematic schedule for anticancer experiments in subcutaneous B16‐OVA tumor‐bearing mice. b) Tumor growth curves of B16‐OVA tumor‐bearing mice after subcutaneous injection of PBS, BG, OVA, BG + OVA, EcN, BG@EcN, OVA@EcN, or BG/OVA@EcN at the OVA dosage of 40 µg, BG dosage of 40 µg, and EcN dosage of 3 × 108 CFU per mouse as indicated in (a). Data are presented as mean ± SD (n = 6). c) Survival plots of B16‐OVA tumor‐bearing mice after treatment indicated in (a). (n = 8). d) Tumor growth curves after re‐challenge with B16‐OVA cells (6 × 10⁵ cells per mouse) in naïve mice or surviving BG/OVA@EcN‐treated mice undergoing removal of residual tumors indicated in (a). Data are presented as mean ± SD (n = 2 for BG/OVA@EcN‐treated mice, n = 3 for naïve mice). e–m) Numbers of e) CD3+ T cells, f) CD8+ T cells, g) IFN‐γ+CD8+ T cells, h) CD69+CD8+ T cells, i) CD4+ T cells, j) CD69+CD4+ T cells, k) Tregs, l) CD80+ TAMs, and m) MHCII+ DCs in tumor tissues of B16‐OVA tumor‐bearing mice after treatment indicated in (a). Data are presented as mean ± SD (n = 6). n) Numbers of monocytes in the blood of B16‐OVA tumor‐bearing mice after treatment indicated in (a). Data are presented as mean ± SD (n = 6). o) Numbers of CD8+ Tcm cells in spleens of B16‐OVA tumor‐bearing mice after treatment indicated in (a). Data are presented as mean ± SD (n = 6). p values are calculated using one‐way ANOVA followed by Tukey's HSD post‐hoc test. * p < 0.05, ** p < 0.01, *** p < 0.001.
Figure 7
Figure 7
Personalized BG/Ag@EcN for inhibiting post‐surgical tumor recurrence in orthotopic 4T1 tumor‐bearing mice. a) Schematic schedule for antitumor recurrence experiments in orthotopic 4T1 tumor‐bearing mice. b) Tumor growth curves of 4T1 tumor‐bearing mice undergoing surgical tumor resection after subcutaneous injection of PBS, BG, Ag, BG + Ag, EcN, BG@EcN, Ag@EcN, or BG/Ag@EcN at the Ag dosage of 40 µg, BG dosage of 40 µg and EcN 3 × 108 CFU per mouse as indicated in (a). Data are presented as mean ± SD (n = 6). p‐values are calculated using one‐way ANOVA followed by Tukey's HSD post‐hoc test. c) Survival plots of 4T1 tumor‐bearing mice undergoing surgical tumor resection after treatment indicated in (a). (n = 8). d–h) Numbers of d) TNF‐α+ myeloid cells, e) TNF‐α+ monocytes, f) TNF‐α+ macrophages, g) CCR2+ myeloid cells, and h) CCR2+ monocytes in the blood of naïve mice and survival 4T1 tumor‐bearing mice undergoing surgical tumor resection after treatment indicated in (a). Data are presented as mean ± SD (n = 3 for BG/Ag@EcN‐treated mice, n = 6 for naïve mice). p‐values are calculated using an unpaired two‐tailed Student's t‐test. i–k) Percentages of i) TNF‐α+ myeloid cells, j) TNF‐α+ monocytes, and k) TNF‐α+ macrophages after the blood cells of the naïve mice and survival 4T1 tumor‐bearing mice undergoing surgical tumor resection after treatment indicated in (a) were re‐stimulated with 100 ng mL−1 LPS for 24 h. Data are presented as mean ± SD (n = 3 for BG/Ag@EcN‐treated mice, n = 6 for naïve mice). p‐values are calculated using an unpaired two‐tailed Student's t‐test. l) Percentages of CD8+ Tcm cells and m) CD8+ Tem cells in the blood of naïve mice and survival 4T1 tumor‐bearing mice undergoing surgical tumor resection after treatment indicated in (a). Data are presented as mean ± SD (n = 3 for BG/Ag@EcN‐treated mice, n = 6 for naïve mice). p‐values are calculated using an unpaired two‐tailed Student's t‐test. n) Percentages of IFN‐γ+CD8+ T cells and o) CD69+CD8+ T cells after the blood cells of the naïve mice and survival 4T1 tumor‐bearing mice undergoing surgical tumor resection after treatment indicated in a was treated with or without 4T1 cell lysates for 72 h. Data are presented as mean ± SD (n = 3 for BG/Ag@EcN‐treated mice, n = 6 for naïve mice). p‐values are calculated using two‐way ANOVA with Bonferroni correction. * p < 0.05, * * p < 0.01, *** p < 0.001.

Similar articles

Cited by

References

    1. a) Riley R. S., June C. H., Langer R., Mitchell M. J., Nat. Rev. Drug Discovery 2019, 18, 175; - PMC - PubMed
    2. b) Frankel J. C., Science 2013, 342, 1432. - PubMed
    1. a) Saxena M., Van Der Burg S. H., Melief C. J. M., Bhardwaj N., Nat. Rev. Cancer 2021, 21, 360; - PubMed
    2. b) Briquez P. S., Hauert S., De Titta A., Gray L. T., Alpar A. T., Swartz M. A., Hubbell J. A., Front Bioeng Biotechnol 2020, 8, 19; - PMC - PubMed
    3. c) Lin M. J., Svensson‐Arvelund J., Lubitz G. S., Marabelle A., Melero I., Brown B D., Brody J. D., Nat Cancer 2022, 3, 911; - PubMed
    4. d) Zhang R., Billingsley M. M., Mitchell M. J., J. Controlled Release 2018, 292, 256. - PMC - PubMed
    1. a) Hao H., Wu S., Lin J., Zheng Z., Zhou Y., Zhang Y., Guo Q., Tian F., Zhao M., Chen Y., Xu X., Hou L., Wang X., Tang R., Nat. Biomed. Eng. 2023, 7, 928; - PubMed
    2. b) Bencherif S. A., Warren Sands R., Ali O. A., Li W. A., Lewin S. A., Braschler T. M., Shih T.‐Y., Verbeke C. S., Bhatta D., Dranoff G., Mooney D J., Nat. Commun. 2015, 6, 7556; - PMC - PubMed
    3. c) Nguyen T. L., Yin Y., Choi Y., Jeong J. H., Kim J., ACS Nano 2020, 14, 11623. - PubMed
    1. a) Xie X., Song T., Feng Y, Zhang H., Yang G., Wu C., You F., Liu Y., Yang H., Chem. Eng. J. 2022, 437, 135505;
    2. b) Wang J., Mamuti M., Wang H., ACS Biomater. Sci. Eng. 2020, 6, 6036. - PubMed
    1. a) Jiang J., Mei J., Yi S., Feng C., Ma Y., Liu Y., Liu Y., Chen C., Adv. Drug Delivery Rev. 2022, 180, 114046; - PubMed
    2. b) Wei Z., Zhang X., Yong T., Bie N., Zhan G., Li X., Liang Q., Li J., Yu J., Huang G., Yan Y., Zhang Z., Zhang B., Gan Lu, Huang Bo, Yang X., Nat. Commun. 2021, 12, 440; - PMC - PubMed
    3. c) Xu J., Ma Q., Zhang Y., Fei Z., Sun Y., Fan Q., Liu B., Bai J., Yu Y., Chu J., Chen J., Wang C., Nat. Commun. 2022, 13, 110. - PMC - PubMed

Publication types