. 2023 Jan-Dec:32:9636897231210750.
doi: 10.1177/09636897231210750.

HIF-1α-Induced Mitophagy Regulates the Regenerative Outcomes of Stem Cells in Fat Transplantation

Affiliations

HIF-1α-Induced Mitophagy Regulates the Regenerative Outcomes of Stem Cells in Fat Transplantation

Kai Zhang et al. Cell Transplant. 2023 Jan-Dec.

Abstract

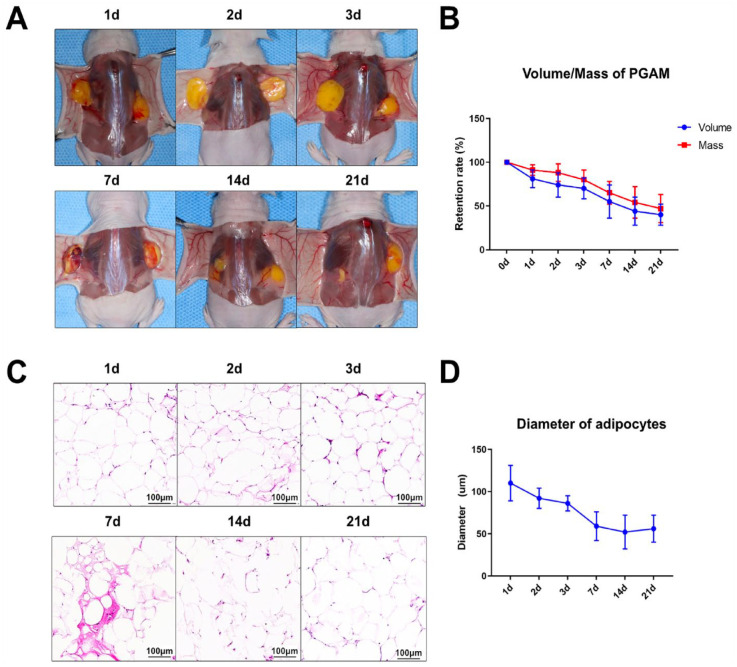
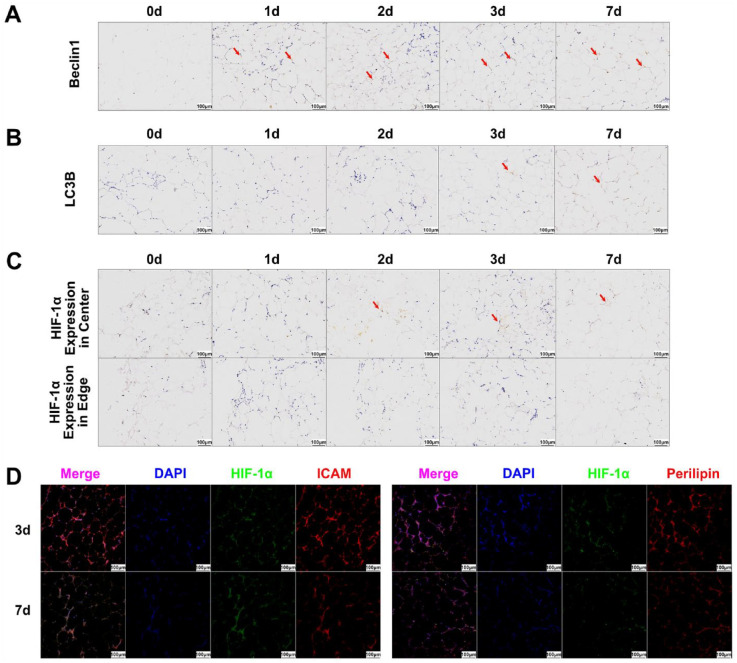
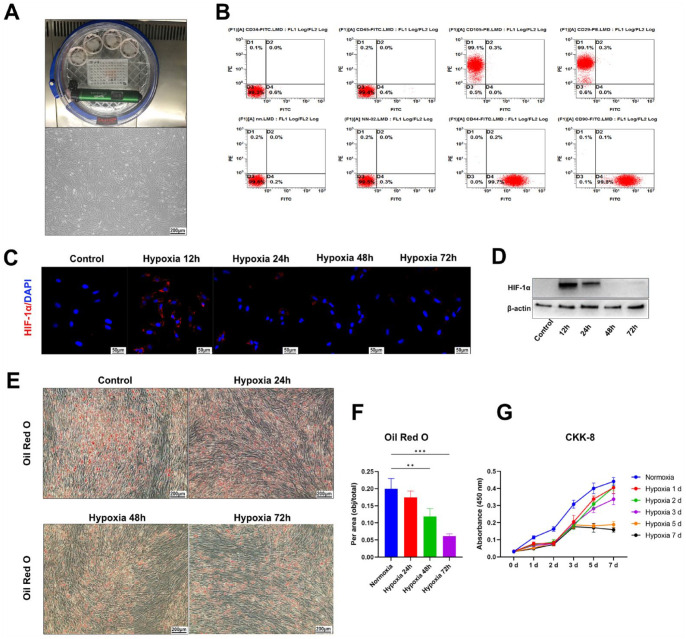
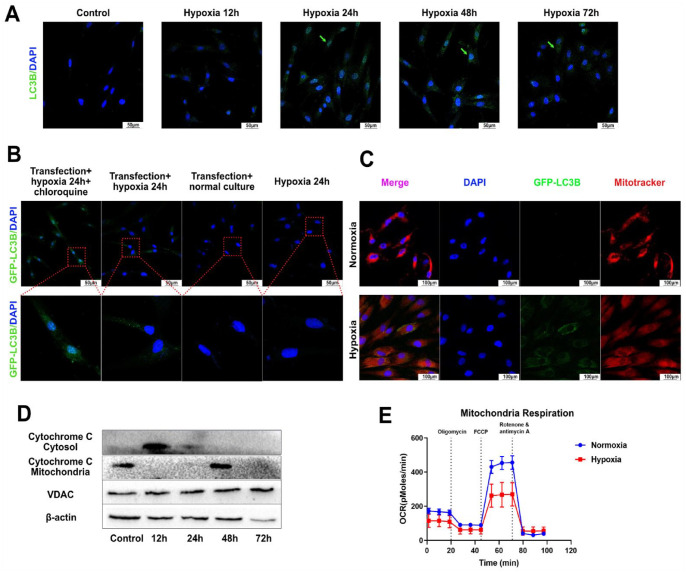
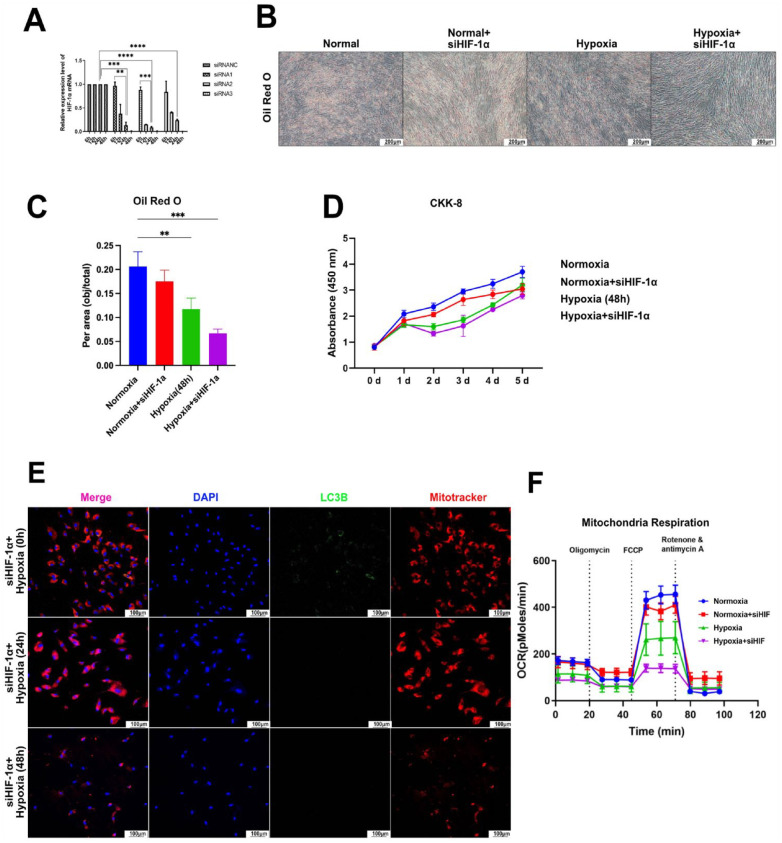
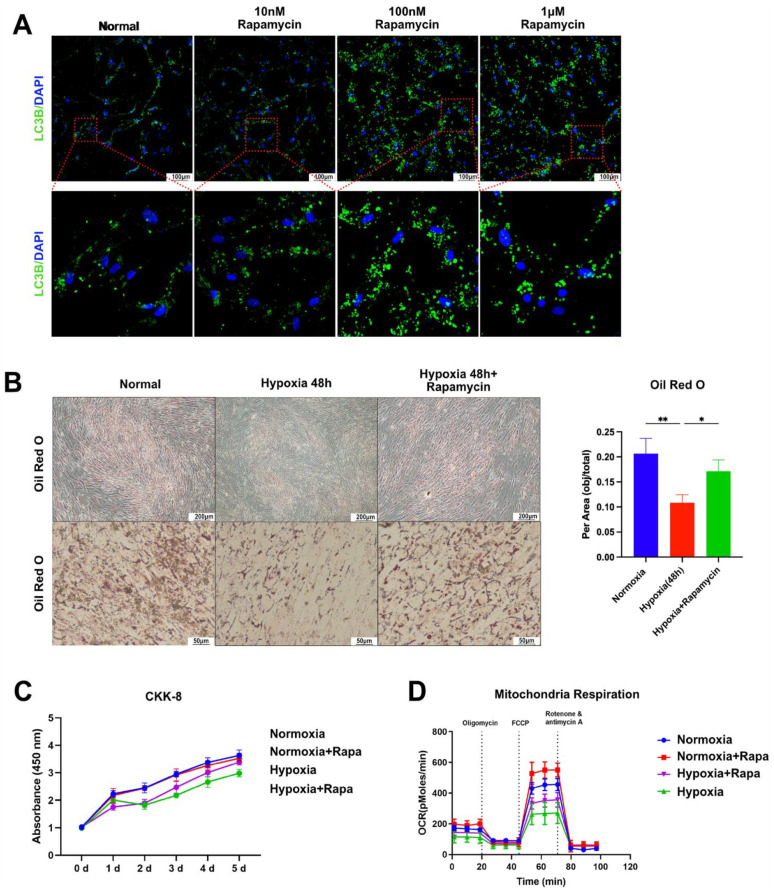
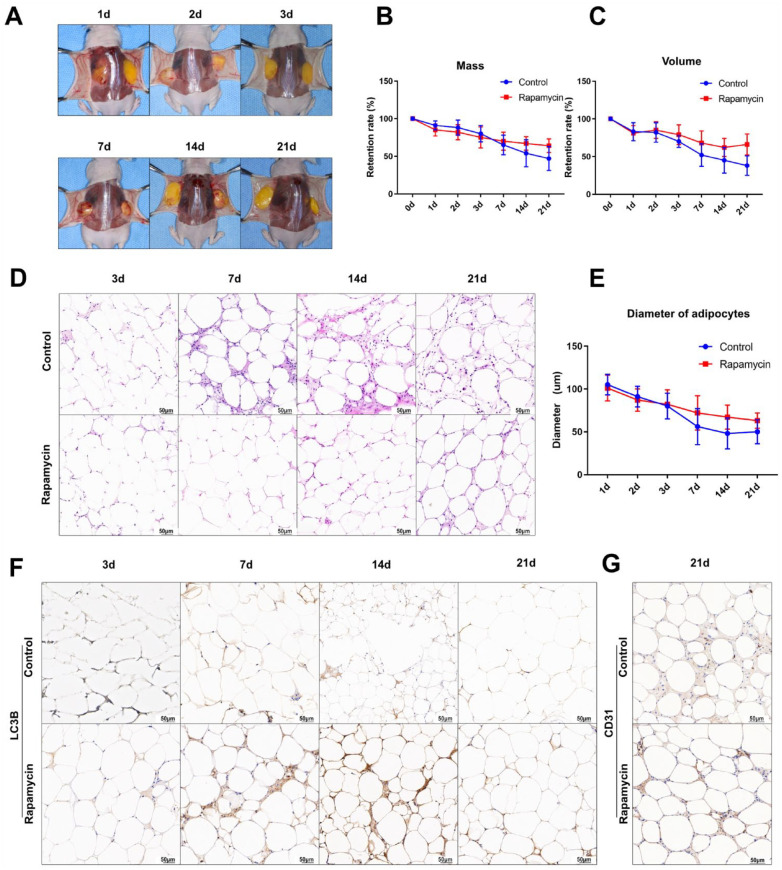
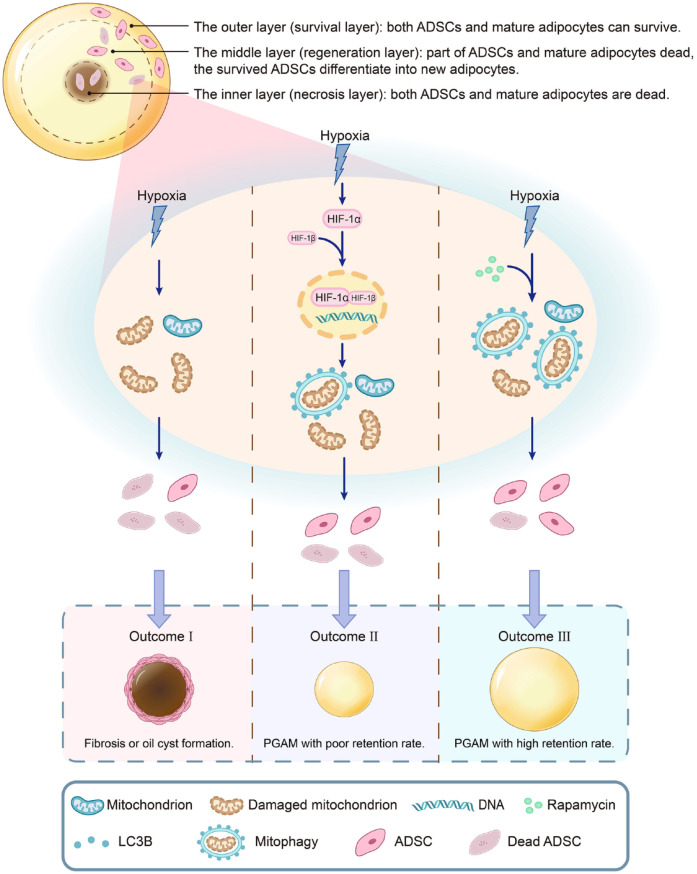
Hypoxia is a crucial factor with type diversity that plays an important role in stem cell transplantation. However, the effects of hypoxia on adipose-derived stem cells (ADSCs) are largely unclear in the autologous fat transplantation (AFT) model, which shows a special type of "acute-progressively resolving hypoxia." Here, an AFT model in nude mice and a hypoxic culture model for ADSCs were combined to explore the link between hypoxia-inducible factor-1 α subunit (HIF-1α) and mitophagy under hypoxic conditions. The results showed that the activity of ADSCs in the first 7 days after grafting was the key stage for volume retention, and the expression of HIF-1α, light chain 3 beta (LC3B), and Beclin1 in ADSCs increased during this period. We also found that hypoxia for longer than 48 h damaged the differentiation and mitochondrial respiration of ADSCs in vitro, but hypoxia signals also activate HIF-1α to initiate mitophagy and maintain the activities of ADSCs. Pre-enhancing mitophagy by rapamycin effectively improves mitochondrial respiration in ADSCs after grafting and ultimately improves AFT outcomes.

Keywords: HIF-1α; adipose-derived stem cells; autologous fat transplantation; cell transplantation; hypoxia; mitophagy.


Conflict of interest statement

Declaration of Conflicting InterestsThe author(s) declared no potential conflicts of interest with respect to the research, authorship, and/or publication of this article.

Figures

Figure 1.
Figure 1.
Establishment and observation of the AFT model with histological analysis at the 3-week follow-up. (A) Preprocessed human subcutaneous white adipose tissue was injected into the lower backs of nude mice (0.5 ml on each side, subcutaneous layer). During the 21 days of follow-up, general morphological and weight-volume changes were observed at each time point (1 day, 2 days, 3 days, 7 days, 14 days, and 21 days). (B) Volume and mass changes of PGAM during the 21 days. (C) Tissue sections with HE staining showing the histological features of PGAM at each time point. (D) Average diameters of adipocytes in PGAM sections based on HE staining to analyze the survival and regeneration conditions. AFT: autologous fat transplantation; PGAM: postgrafting adipose mass; HE: hematoxylin and eosin.
Figure 2.
Figure 2.
Autophagy and hypoxia-related molecules in PGAM at the early stage after grafting (0, 1, 2, 3, and 7 days). (A) Immunohistochemistry showing the expression of Beclin-1 in the cytoplasm of PGAM (the arrow indicates Beclin-1). (B) Immunohistochemical staining showing the expression of LC3B in the cytoplasm of PGAM (the arrow indicates LC3B). (C) Immunohistochemistry and analysis showing the different expression levels of HI-1α in the center (top) and edge (bottom) areas of the PGAM (the arrow indicates HIF-1α). (D) Immunofluorescence staining to show the expression of HIF-1α in ADSCs (left, red for ICAM) and mature adipocytes (right, red for Perilipin). ADSC: adipose-derived stem cells; ICAM: intercellular adhesion molecule; PGAM: postgrafting adipose mass.
Figure 3.
Figure 3.
Effects of hypoxic conditions on the proliferation and adipogenic differentiation capacity of ADSCs in vitro. (A) Establishment of the cultivation system with an adjustable oxygen concentration (top) and the isolation and general characterization of ADSCs under an optical microscope (bottom). (B) Flow cytometric assay to confirm that ADSCs were CD34–, CD45–, CD29+, CD44+, CD90+, and CD105+. (C) Immunofluorescence staining to show the expression of HIF-1α in ADSCs cultured under hypoxia for 0, 12, 24, 48, and 72 h (blue indicates DAPI; red indicates HIF-1α). (D) Western blot to confirm HIF-1α expression in ADSCs cultured under hypoxic conditions. Full-length blots/gels are presented in Supplemental Figure 1. (E and F) Oil red O staining to show the adipogenic differentiation capacity of ADSCs cultured under hypoxic conditions. (G) CCK-8 (cell counting kit-8) experiment showing the proliferation capacity of ADSCs cultured under hypoxic conditions. ADSC: adipose-derived stem cells; HIF-1α: hypoxia-inducible factor-1 α subunit; DAPI: 4’,6-diamidino-2-phenylindole.
Figure 4.
Figure 4.
Effects of hypoxic conditions on autophagy and mitochondria in vitro. (A) Immunofluorescence staining to show the expression of LC3B in ADSCs under hypoxic cultivation for 0, 12, 24, 48, and 72 h (blue for DAPI, green for LC3B). (B) Immunofluorescence staining to assess autophagy in ADSCs cultured in hypoxic conditions for 24 h (blue indicates DAPI, and green indicates GFP-LC3B). (C) Immunofluorescence staining to show the subcellular location of LC3B and mitochondria (blue indicates DAPI; red indicates MitoTracker; green indicates GFP-LC3B). (D) Western blot to verify the activity of mitochondria of ADSCs cultured in hypoxic conditions for 0, 12, 24, 48, and 72 h by testing cytochrome C in the cytosol and mitochondria. Full-length blots/gels are presented in Supplemental Figure 2. (E) Seahorse analysis to test the effects of hypoxic conditions on the mitochondrial respiration activity of ADSCs. ADSC: adipose-derived stem cells; DAPI: 4’,6-diamidino-2-phenylindole.
Figure 5.
Figure 5.
siRNA-mediated HIF-1α silencing to analyze the effects of HIF-1α on ADSCs and mitochondria. (A) Construction and efficiency validation of the siRNA. (B and C) Oil red O experiments to test the effect of HIF-1α on the differentiation capacity of ADSCs under hypoxic conditions. (D) CCK-8 experiments to analyze the effect of HIF-1α on the proliferation capacity of ADSCs under hypoxic conditions. (E) Immunofluorescence staining showing autophagy-related LC3B expression in ADSCs under hypoxic conditions. (F) Seahorse analysis to test the effects of HIF-1α on mitochondrial respiration in ADSCs under hypoxic conditions; CCK-8: cell counting kit-8.
Figure 6.
Figure 6.
Effects of enhanced autophagy on ADSCs under hypoxic conditions. (A) Autophagy-related LC3B expression induced by different concentrations of rapamycin (0 nM, 10 nM, 100 nM, and 1 μM). (B) Oil red O experiments showing the differentiation capacity of autophagy-enhanced ADSCs under hypoxic conditions. (C) CCK-8 experiments to analyze the proliferation capacity of autophagy-enhanced ADSCs under hypoxic conditions. (D) Seahorse analysis to test the effects of enhanced autophagy on mitochondrial respiration in ADSCs under hypoxic conditions. ADSC: adipose-derived stem cells; CCK-8: cell counting kit-8.
Figure 7.
Figure 7.
Establishment and observation of the AFT model with autophagy-enhanced PGAM. (A) Preprocessed human subcutaneous white adipose tissue was injected into the lower backs of nude mice (0.5 ml on each side, subcutaneous layer; rapamycin-treated PGAM on the left side, PBS-treated PGAM on the right side). During the 21 days of follow-up, general morphological and weight-volume changes were observed at each time point (1 day, 2 days, 3 days, 7 days, 14 days, and 21 days). (B and C) Changes in the mass and volume of autophagy-enhanced PGAM over 21 days. (D) Tissue sections with HE staining showing the histological features of autophagy-enhanced PGAM at each time point. (E) Average diameters of adipocytes in autophagy-enhanced PGAM sections based on HE staining to analyze the survival and regeneration conditions. (F) Immunohistochemistry showing the LC3B expression level in the autophagy-enhanced PGAM at 3, 7, 14, and 21 days. (G) Immunohistochemistry showed a higher CD31 expression level in the autophagy-enhanced PGAM group than in the control group at 21 days. PGAM: postgrafting adipose mass; HE: hematoxylin and eosin; AFT: autologous fat transplantation.
Figure 8.
Figure 8.
The influence of HIF-1α-induced mitophagy on the final outcomes of PGAM under hypoxic conditions. The ADSCs located in the middle layer of the PGAM are surrounded by a hypoxic microenvironment, which causes mitochondrial damage and results in massive ADSCs death, fibrogenesis, and oil cysts (outcome I). On the other hand, HIF-1α responds to hypoxic signaling and counteracts the damage of hypoxia by initiating mitophagy, which preserves mitochondrial function in ADSCs to a certain extent, thus allowing more ADSCs to survive and leading to PGAM with a poor retention rate (outcome II). In addition, pretreatment with rapamycin effectively activates mitophagy and protects mitochondrial function, thus greatly improving the survival of ADSCs and the retention rate of PGAM (outcome III). ADSC: adipose-derived stem cells; PGAM: postgrafting adipose mass.

Similar articles

Cited by

References

    1. Trotzier C, Sequeira I, Auxenfans C, Mojallal AA. Fat graft retention: adipose tissue, adipose-derived stem cells, and aging. Plast Reconstr Surg. 2023;151(3):420e–31e. - PubMed
    1. Philips BJ, Grahovac TL, Valentin JE, Chung CW, Bliley JM, Pfeifer ME, Roy SB, Dreifuss S, Kelmendi-Doko A, Kling RE, et al.. Prevalence of endogenous CD34+ adipose stem cells predicts human fat graft retention in a xenograft model. Plast Reconstr Surg. 2013;132(4):845–58. - PMC - PubMed
    1. Gerth DJ, King B, Rabach L, Glasgold RA, Glasgold MJ. Long-term volumetric retention of autologous fat grafting processed with closed-membrane filtration. Aesthet Surg J. 2014;34(7):985–94. - PubMed
    1. Zhu S, Ying Y, He Y, Zhong X, Ye J, Huang Z, Chen M, Wu Q, Zhang Y, Xiang Z, et al.. Hypoxia response element-directed expression of bFGF in dental pulp stem cells improve the hypoxic environment by targeting pericytes in SCI rats. Bioact Mater. 2021;6(8):2452–66. - PMC - PubMed
    1. Mashiko T, Yoshimura K. How does fat survive and remodel after grafting? Clin Plast Surg. 2015;42(2):181–90. - PubMed

Publication types

Substances