. 2023 Nov 27:12:e80936.
doi: 10.7554/eLife.80936.

Microstructural differences in the osteochondral unit of terrestrial and aquatic mammals

Affiliations

Microstructural differences in the osteochondral unit of terrestrial and aquatic mammals

Irina A D Mancini et al. Elife. .

Abstract

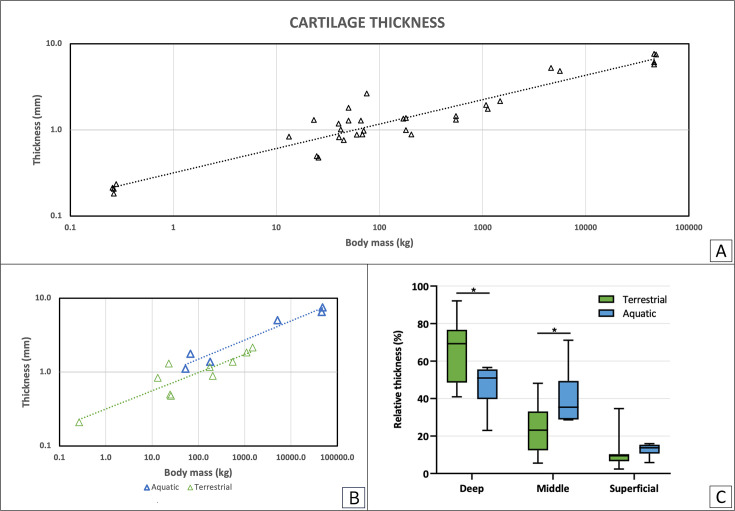
During evolution, animals have returned from land to water, adapting with morphological modifications to life in an aquatic environment. We compared the osteochondral units of the humeral head of marine and terrestrial mammals across species spanning a wide range of body weights, focusing on microstructural organization and biomechanical performance. Aquatic mammals feature cartilage with essentially random collagen fiber configuration, lacking the depth-dependent, arcade-like organization characteristic of terrestrial mammalian species. They have a less stiff articular cartilage at equilibrium with a significantly lower peak modulus, and at the osteochondral interface do not have a calcified cartilage layer, displaying only a thin, highly porous subchondral bone plate. This totally different constitution of the osteochondral unit in aquatic mammals reflects that accommodation of loading is the primordial function of the osteochondral unit. Recognizing the crucial importance of the microarchitecture-function relationship is pivotal for understanding articular biology and, hence, for the development of durable functional regenerative approaches for treatment of joint damage, which are thus far lacking.

Keywords: bone; cartilage; developmental biology; dolphin; mammals; regenerative medicine; stem cells; whale.


Conflict of interest statement

IM, RL, MK, MC, MC, Mv, LI, MK, Pv, JM No competing interests declared

Figures

Figure 1.
Figure 1.. Cartilage thickness as analyzed from histological sections.
(A) Total articular cartilage thickness correlates with body mass with a negative allometric relationship (R2=0.91, a=0.28). (B) Total cartilage thickness in correlation with body mass for terrestrial and aquatic mammals separately. In green are terrestrial mammals (R2=0.80, a=0.26), in blue are aquatic mammals (R2=0.96, a=0.26). (C) Average of relative layer thickness (%) was calculated for each cartilage layer in terrestrial (green) and aquatic (blue) mammals. Comparison shows a significant difference between the two groups in both the deep and middle layers (p<0.01).
Figure 2.
Figure 2.. Analysis of the collagen fibre orientation based on picrosirius red staining and imaging with PLM.
The collagen fibers orientation of aquatic mammals (sperm whale, A; harbor porpoise; B) appeared less organized than fiber orientation in terrestrial mammals (giraffe; C). (C) Cartilage structure in terrestrial mammals featured a clear distinction between deep, middle and superficial layer (respectively in yellow, black and red/yellow from bone to surface). (D) Polar graphical representation of collagen fiber distribution for deep, middle and superficial layer in terrestrial (violet) and aquatic (cerulean) mammals. O° are fibers parallel to the surface, 90° are fibers perpendicular to the surface. (E) Average peak area was calculated for each cartilage layer in both terrestrial (violet) and aquatic (cerulean) mammals, showing significant differences between the two groups in all layers (p<0.05).
Figure 3.
Figure 3.. Mechanical analysis of the tissue samples.
(A) Representative stress relaxation curve of some of the tested cartilage samples (Rothschilds giraffe, porpoise and sperm whale). (B) Schematics of loading methodology: unconfined compression geometry (congruent loading) used on cartilage samples immersed in a PBS bath. Comparison of time dependent mechanical properties: (C) peak and (D) equilibrium modulus for terrestrial (green) and aquatic mammals (blue). * Indicates a significant difference. Relationship of (E) peak and (F) equilibrium moduli average for each species with body mass for terrestrial (green) and aquatic mammals (blue).
Figure 3—figure supplement 1.
Figure 3—figure supplement 1.. Stress relaxation.
(A) Initial stress relaxation appeared slower for aquatic mammals and steeper for terrestrial mammals. (B) No significant differences were observed in the phase of slow relaxation.
Figure 4.
Figure 4.. Histological staining and micro-CT analysis of the osteochondral tissues.
Safranin-O staining of histological sections of the tissue of a sperm whale (A), harbor porpoise (B) and Rothschild’s giraffe (C). Aquatic mammals (A,B) showed an abrupt transition from hyaline cartilage to subchondral trabecular bone. Terrestrial mammals (C) displayed the characteristic calcified cartilage layer with tidemark (in magnification bubble) in between and a dense subchondral plate before the subchondral trabecular bone. (D) 3D rendered micro-CT scan of giraffe bone core, showing on top a dense surface area that interfaces with the (calcified) cartilage (not shown in scan) and a gradually more porous structure as the subchondral tissue transitions to trabecular bone. (E) 3D rendered micro-CT scan of a whale bone core, showing a porous surface on top where it interfaces with cartilage, and a porous structure underneath with seemingly no transition from more dense subchondral bone to trabecular bone. (F) Bone volume/total volume (BV/TV) in the subchondral area (immediately underneath the cartilage) for aquatic mammals (blue) was significantly lower than in terrestrial mammals (green) (p<0.01).
Figure 4—figure supplement 1.
Figure 4—figure supplement 1.. Examples of the analysis of tissue from additional species.
3D rendered micro-CT scans (A, C, E, G) and histological sections stained with safranin-O (B, D, F, H) of the osteochondral tissues derived of terrestrial (rat: A, B; white rhinoceros: E, F) and aquatic (harbor porpoise: C, D; harbor seal: G, H) mammals.
Figure 4—figure supplement 2.
Figure 4—figure supplement 2.. Lack of calcified cartilage in the sperm whale.
Safranin-O staining of histological sections of tissue of the three sperm whales (A, B, C) included in this study, highlighting the lack of the calcified cartilage layer at the cartilage-bone interface.
Figure 5.
Figure 5.. Comparison of the subchondral bone structures in the different species.
Examples of macroscopic (left) and micro-CT scans (right) of a Rothschild’s giraffe, porpoise and sperm whale. Left images show the macroscopic aspect of the humeral head of two aquatics and a terrestrial animal, on the right the correspondent micro-CT scan of the trabecular bone. (A, B) Terrestrial mammals featured a denser bone, while bone density was lower in harbor porpoises (C, D) and still lower in deep-diving animals (E,F). (G) Trabecular BV/TV increased with body mass in terrestrial mammals (green), and decreased with body mass in aquatic mammals (blue). (H) Trabecular bone thickness (Tb.Th) increased with size in terrestrial mammals (green), and was independent of size in aquatic mammals (blue).
Figure 6.
Figure 6.. Schematic drawings of the front extremities.
Drawings highlighting the location of the humerus (in red) of which the head (top) was sampled in this study for the sperm whale (A), harbor porpoise (B) and Rothschild’s giraffe (C).
Figure 7.
Figure 7.. Polarized light microscopy (PLM) analysis of collagen fiber orientation.
(A) The histological sections stained with picrosirius red were imaged, then a region of interest was selected (ROI, white frame), and the cartilage tissue was divided into deep, middle and superficial layer. (B–D) The selected region was analyzed with Image J to determine the frequency of fibers for angle increments of 2°, obtaining a detailed histogram for each region.

Update of

  • doi: 10.1101/2022.06.09.495440

Similar articles

Cited by

References

    1. Arkill KP, Winlove CP. Solute transport in the deep and calcified zones of articular cartilage. Osteoarthritis and Cartilage. 2008;16:708–714. doi: 10.1016/j.joca.2007.10.001. - DOI - PubMed
    1. Arokoski JP, Hyttinen MM, Lapveteläinen T, Takács P, Kosztáczky B, Módis L, Kovanen V, Helminen H. Decreased birefringence of the superficial zone collagen network in the canine knee (stifle) articular cartilage after long distance running training, detected by quantitative polarised light microscopy. Annals of the Rheumatic Diseases. 1996;55:253–264. doi: 10.1136/ard.55.4.253. - DOI - PMC - PubMed
    1. Barak MM, Lieberman DE, Hublin JJ. Of mice, rats and men: trabecular bone architecture in mammals scales to body mass with negative allometry. Journal of Structural Biology. 2013;183:123–131. doi: 10.1016/j.jsb.2013.04.009. - DOI - PubMed
    1. Benninghoff A. Form und bau der gelenkknorpel in ihren beziehungen zur funktion. Zeitschrift Für Anatomie Und Entwicklungsgeschichte. 1925;76:43–63. doi: 10.1007/BF02134417. - DOI
    1. Bevill SL, Thambyah A, Broom ND. New insights into the role of the superficial tangential zone in influencing the microstructural response of articular cartilage to compression. Osteoarthritis and Cartilage. 2010;18:1310–1318. doi: 10.1016/j.joca.2010.06.008. - DOI - PubMed