Comparative Study
. 2023 Dec 21;97(12):e0133823.
doi: 10.1128/jvi.01338-23. Epub 2023 Nov 27.

The role of lysosomes as intermediates in betacoronavirus PHEV egress from nerve cells

Affiliations
Comparative Study

The role of lysosomes as intermediates in betacoronavirus PHEV egress from nerve cells

Zhenzhen Wang et al. J Virol. .

Abstract

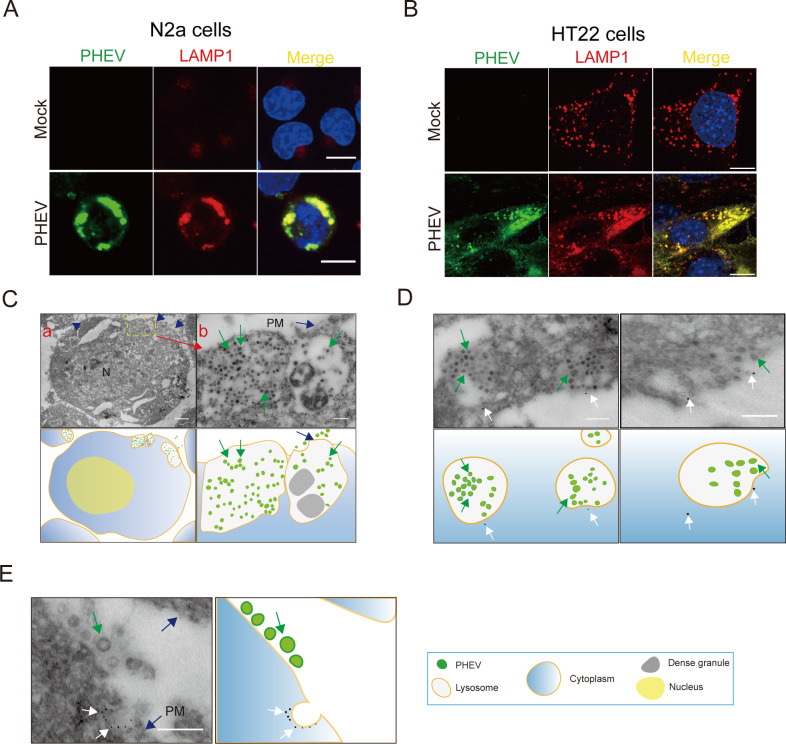
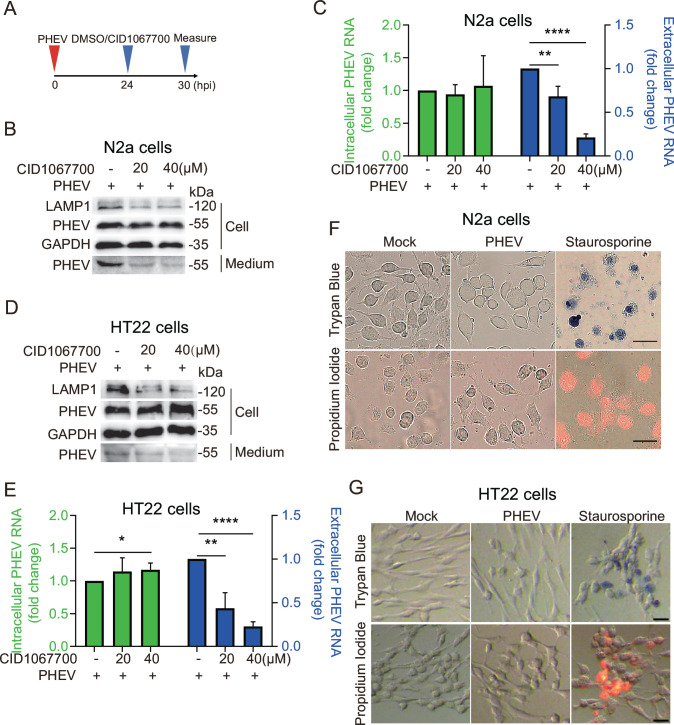
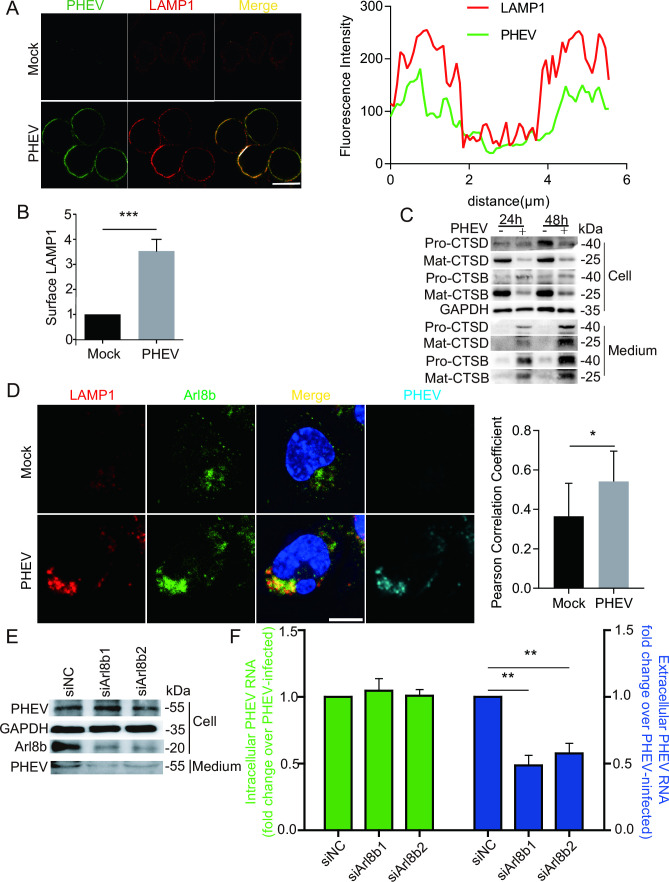
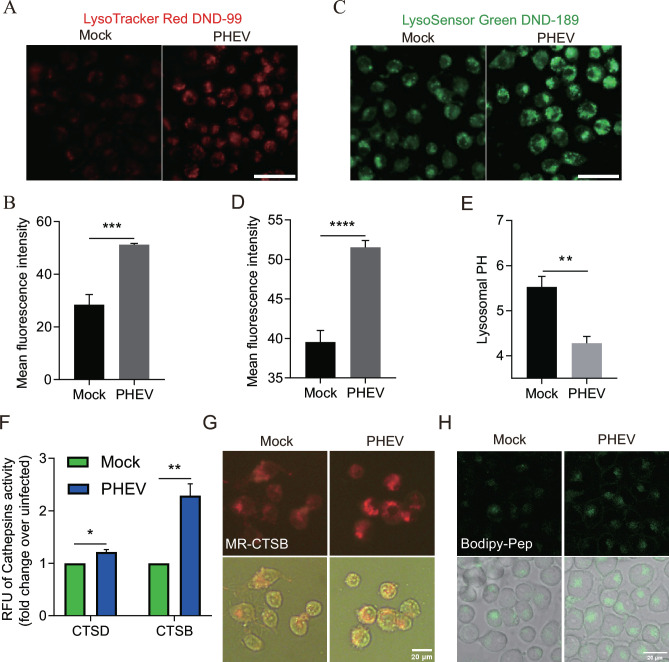
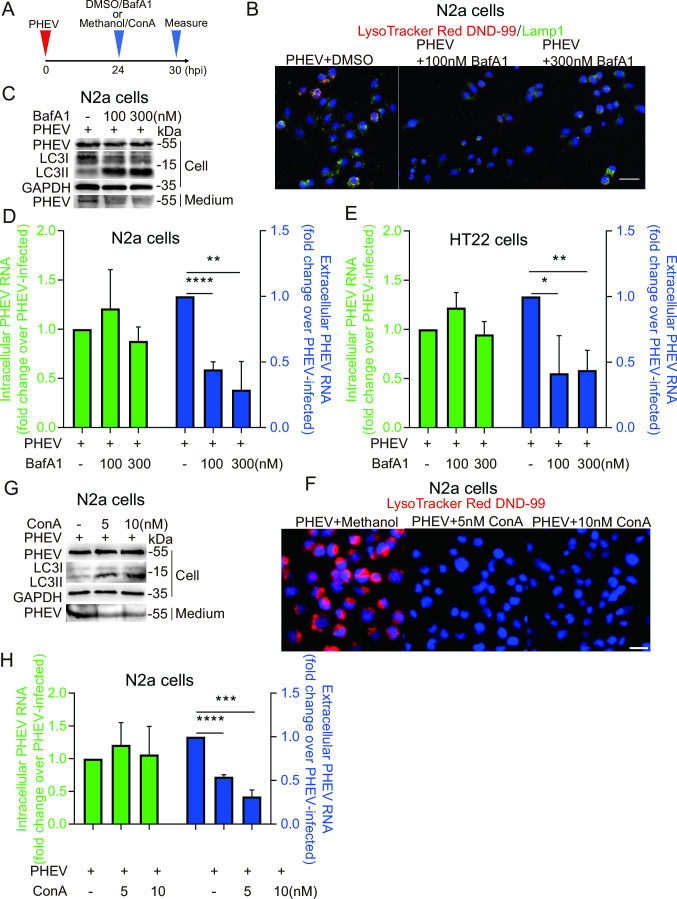
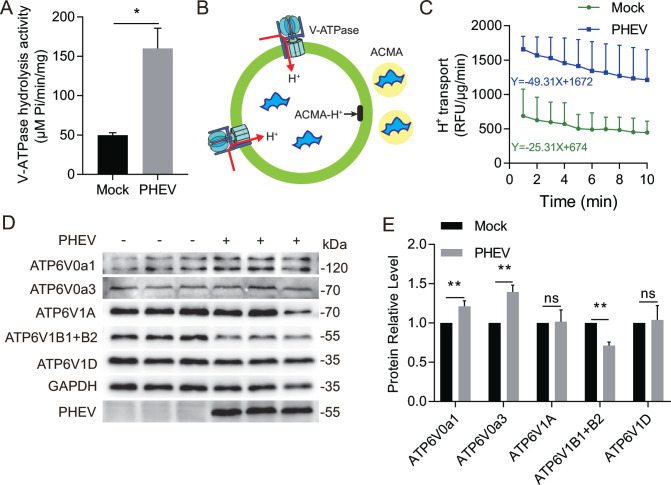
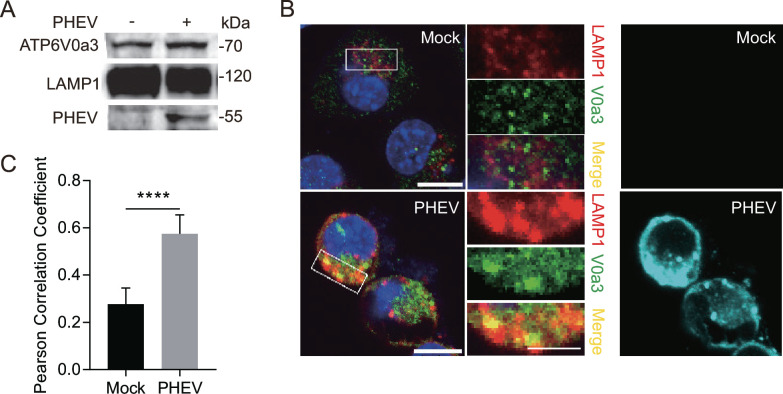
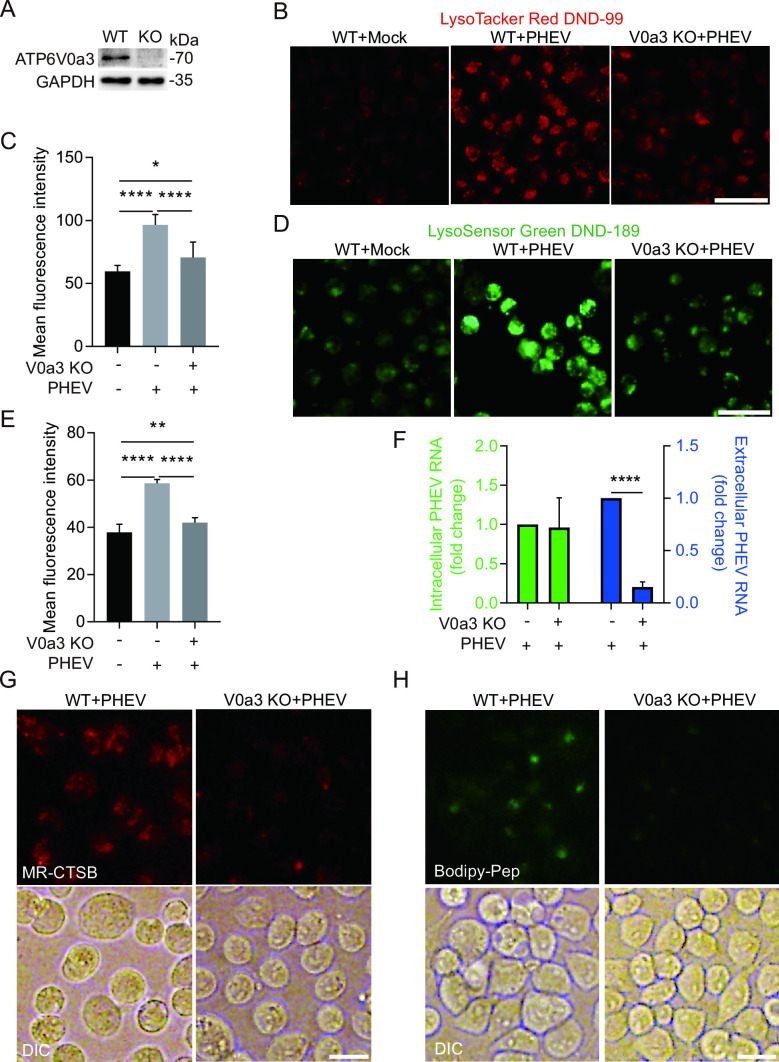
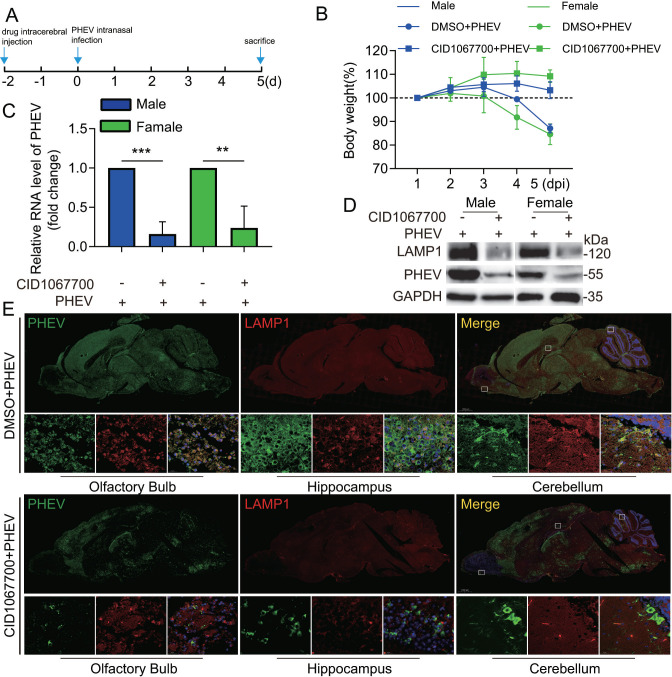
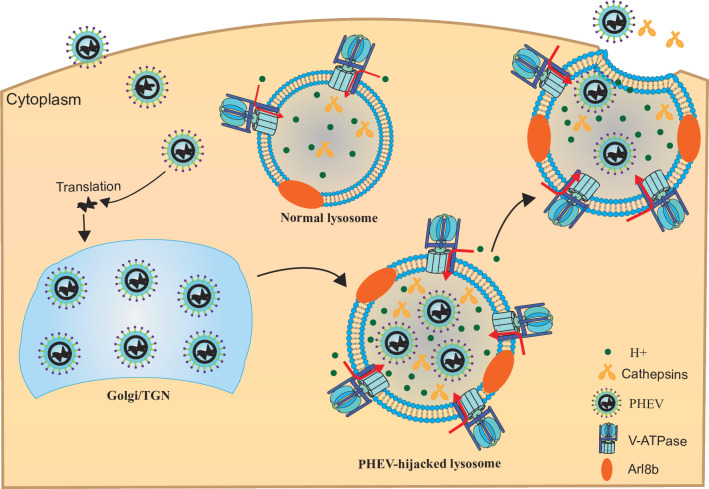
Betacoronaviruses, including severe acute respiratory syndrome coronavirus-2 (SARS-CoV-2) and mouse hepatitis virus (MHV), exploit the lysosomal exocytosis pathway for egress. However, whether all betacoronaviruses members use the same pathway to exit cells remains unknown. Here, we demonstrated that porcine hemagglutinating encephalomyelitis virus (PHEV) egress occurs by Arl8b-dependent lysosomal exocytosis, a cellular egress mechanism shared by SARS-CoV-2 and MHV. Notably, PHEV acidifies lysosomes and activates lysosomal degradative enzymes, while SARS-CoV-2 and MHV deacidify lysosomes and limit the activation of lysosomal degradative enzymes. In addition, PHEV release depends on V-ATPase-mediated lysosomal pH. Furthermore, this is the first study to evaluate βCoV using lysosome for spreading through the body, and we have found that lysosome played a critical role in PHEV neural transmission and brain damage caused by virus infection in the central nervous system. Taken together, different betacoronaviruses could disrupt lysosomal function differently to exit cells.

Keywords: CNS; PHEV; V-ATPase; betacoronaviruses; lysosome; virus egress.


Conflict of interest statement

The authors declare no conflict of interest.

Figures

Fig 1
Fig 1
PHEV is enriched in late endosomes/lysosomes during replication. (A and B) Colocalization of PHEV and LAMP1 in N2a and HT22 cells, respectively. Mock- and PHEV-infected cells were immunostained with anti-LAMP1 (red) and anti-PHEV (green) antibodies at 48 hpi. Scale bar, 10 µm. (C) TEM images of PHEV-infected N2a cells at 48 hpi. Blue arrows: The plasma membrane; Green arrows: PHEV. Scale bar, 1 µm (A) and 200 nm (B). (D and E) PHEV-infected N2a cells at 48 hpi were processed for immuno-EM and labeled with anti-LAMP1 and 12 nm colloidal gold. Blue arrows: the plasma membrane; White arrows: the colloidal gold-labeled LAMP1; Green arrows: PHEV. Scale bar, 200 nm. Representative images are shown.
Fig 2
Fig 2
PHEV utilizes late endosomes/lysosomes for egress. (A) Schematic diagrams illustrating the experimental design for time-of-addition experiments. (B) The protein levels of LAMP1, PHEV, and glyceraldehyde-3-phosphate dehydrogenase (GAPDH) were analyzed by western blot in PHEV-infected N2a cells treated with CID1067700 or DMSO. (C) The PHEV N genomic RNA was determined using quantitative PCR (qPCR) in DMSO- or CID1067700-treated PHEV-infected N2a cells. The data were normalized to the DMSO-treated PHEV-infected cells. (D) The protein levels of LAMP1, PHEV, and GAPDH were analyzed by western blot in PHEV-infected HT22 cells treated with CID1067700 or DMSO, respectively. (E) The PHEV N genomic RNA was determined using qPCR in DMSO- or CID1067700-treated PHEV-infected HT22 cells. The data were normalized to the DMSO-treated PHEV-infected cells. (F and G) Trypan blue and propidium iodine exclusion were used to detect changes in plasma membrane permeability in PHEV-infected N2a or HT22 cells at 30 hpi. Staurosporine-treated cells were seen as a positive control of cell membrane rupture. Scale bar, 30 µm. Representative blots and images are shown. Data are shown as mean ± SD. P values were considered significant when P < 0.05 and denoted as, *, P < 0.05, **, P < 0.01, and ****, P < 0.0001.
Fig 3
Fig 3
PHEV uses an Arl8b-dependent lysosomal exocytic pathway to egress. (A) Colocalization of PHEV and surface LAMP1. Mock- or PHEV-infected cells at 48 hpi were immunostained with anti-LAMP1 (red) and anti-PHEV (green) antibodies. Scale bar, 10 µm. (B) The surface LAMP1 levels on mock- and PHEV-infected cells from the experiment whose results are shown in panel A were quantified by using Image J. (C) The protein levels of Pro-CTSD, Pro-CTSB, Mat-CTSD, Mat-CTSB, and GAPDH at 24 and 48 hpi were analyzed by western blot, respectively. (D) Mock- or PHEV-infected cells at 48 hpi were immunostained with anti-LAMP1 (red), anti-Arl8b (green), and anti-PHEV (teal) antibodies. Scale bar, 10 µm. (E) The protein levels of Arl8b, PHEV, and GAPDH were analyzed by western blot in PHEV-infected Arl8b small interfering RNA (siRNA)-treated cells or PHEV-infected-non-target siRNA-treated cells. (F) The PHEV N genomic RNA was determined using qPCR in Arl8b siRNA-treated cells and non-target siRNA-treated cells. The data were normalized to the non-target siRNA-treated cells. Representative blots and images are shown. Data are shown as mean ± SD. P values were considered significant when P < 0.05 and denoted as, *, P < 0.05, **, P < 0.01, and ***, P < 0.001.
Fig 4
Fig 4
PHEV hijacked actively or passively acidified lysosomes and increased lysosomal degradation enzyme activation. (A) Mock or PHEV-infected N2a cells at 48 hpi were stained by LysoTracker Red DND-99. Scale bar, 10 µm. (B) Quantification of LysoTracker Red DND-99 fluorescence intensity. (C) Mock- or PHEV-infected N2a cells at 48 h were stained by LysoSensor green DND-189. Scale bar, 10 µm. (D) Quantification of LysoSensor Green DND-189 intensity. (E) Mean LysoSensor Green fluorescence intensity in mock- and PHEV-infected cell groups converted to a pH value from calibration of the dye. (F) Lysosome enzyme (CTSD and CTSB) activity of mock- and PHEV-infected N2a cells at 48 hpi. (G and H) Live imaging of Magic Red and Bodipy-FL-pepstatin A dye in N2a cells, which were used as indirect indicators of CTSB and CTSD enzyme activities, respectively. Representative images are shown. Data are shown as mean ± SD. P values were considered significant when P < 0.05 and denoted as, *, P < 0.05, **, P < 0.01, ***, P < 0.001, and ****, P < 0.0001.
Fig 5
Fig 5
PHEV egress in a lysosomal pH-dependent manner. (A) Schematic diagrams illustrating the experimental design for time-of-addition experiments. (B) The PHEV-infected N2a cells treated with BafA1 or DMSO were immunostained with LysoTracker Red DND-99 (red) and LAMP1 (green). Scale bar, 20 µm. (C) The protein levels of LC3, PHEV, and GAPDH were analyzed by western blot in DMSO- or BafA1-treated PHEV-infected N2a cells. (D and E) The PHEV N genomic RNA was determined using qPCR in DMSO- or BafA1-treated PHEV-infected N2a and HT22 cells, respectively. The data were normalized to the DMSO-treated PHEV-infected cells. (F) The protein levels of LC3, PHEV, and GAPDH were analyzed by western blot in Methanol- or ConA -treated PHEV-infected N2a cells. (G) The PHEV-infected N2a cells treated with ConA or Methanol were stained with LysoTracker Red DND-99. Scale bar, 20 µm. (H) The PHEV N genomic RNA was determined using qPCR in Methanol- or ConA-treated PHEV-infected N2a cells. The data were normalized to the methanol-treated PHEV-infected cells. Representative blots and images are shown. Data are shown as mean ± SD. P values were considered significant when P < 0.05 and denoted as, *, P < 0.05, **, P < 0.01, ***, P < 0.001, and ****, P < 0.0001.
Fig 6
Fig 6
PHEV infection leads to the enhancement of lysosomal V-ATPase activity. (A) The V-ATPase hydrolytic activity in mock- or PHEV-hijacked purified lysosomes at 48 hpi. (B) Schematic of the ACMA assay. A lipid-soluble proton-sensitive dye (ACMA) is permeated to lysosomes (green circle). Protons moving into the lysosomes via V-ATPase bind ACMA to form ACMA-H+, which does not fluoresce, resulting in a decrease in total fluorescence emission. Protonated ACMA cannot pass out through the lysosomal membrane. (C) The proton translocation ability of V-ATPase in mock- and PHEV-hijacked purified lysosomes at 48 hpi. (D) The protein levels of various V-ATPase subunits in mock- and PHEV-infected cells at 48 hpi. (E) The ratios of the intensity values of the V-ATPase/GAPDH immunoblotting results from the experiment whose results are shown in panel D were quantified by using Image J. Data are shown as mean ± SD. P values were considered significant when P < 0.05 and denoted as, *, P < 0.05, **, P < 0.01.
Fig 7
Fig 7
The expression and distribution of V0a3 in PHEV-hijacked lysosomes at 48 hpi. (A) The protein levels of V0a3 in mock- and PHEV-hijacked purified lysosomes. (B) Colocalization of V0a3 and LAMP1. Mock- or PHEV-infected cells were immunostained with anti-LAMP1 (red), anti-V0a3 (green), and anti-PHEV (teal) antibodies. Scale bar, 10 µm. (C) The Pearson’s correlation coefficients of the images between LAMP1 and V0a3 were analyzed by using Image J. Representative blots and images are shown. Data are shown as mean ± SD. P values were considered significant when P < 0.05 and denoted as, ****, P < 0.0001, ns, not significant.
Fig 8
Fig 8
PHEV egress dependents on V0a3-mediated lysosomal acidification (A) Determination of V0a3 knockout efficiency using western blotting. (B) LysoTracker Red DND-99 staining of mock- or PHEV-infected WT or V0a3 KO cells at 48 hpi. Scale bar, 50 µm. (C) Quantification of LysoTracker Red DND-99 fluorescence intensity in mock- or PHEV-infected WT or V0a3 KO cells. (D) LysoSensor Green DND-189 staining of mock- or PHEV-infected WT or V0a3 KO cells at 48 hpi. Scale bar, 50 µm. (E) Quantification of LysoSensor Green DND-189 intensity in mock- or PHEV-infected WT or V0a3 KO cells. (F) The PHEV N genomic RNA was determined using qPCR in PHEV-infected WT or V0a3 KO cells at 48 hpi. The data were normalized to the PHEV-infected WT cells. (G and H) Live imaging of Magic Red and Bodipy-FL-pepstatin A dye in PHEV-infected WT or V0a3 KO cells at 48 hpi, which were used as indirect indicators of CTSB and CTSD enzyme activities, respectively. Representative blots and images are shown. Data are shown as mean ± SD. P values were considered significant when P < 0.05 and denoted as, *, P < 0.05, **, P < 0.01, and ****, P < 0.0001.
Fig 9
Fig 9
CID1067700 inhibits PHEV neural transmission in CNS. (A) Schematic diagrams illustrating the experimental design for time-of-drug treatment and sacrifice experiments. (B) Mice were monitored daily for body weight change in different groups. (C) PHEV N genomic RNA levels in DMSO- or CID1067700-treated PHEV-infected mice. (D) PHEV N protein and LAMP1 levels in DMSO- or CID1067700-treated PHEV-infected mice. (E)Colocalization of PHEV and LAMP1 in mice brain sections. DMSO- or CID1067700-treated PHEV-infected brain sections were immunostained with anti-LAMP1 (red) and anti-PHEV (green) antibodies. Representative blots and images are shown. Data are shown as mean ± SD. P values were considered significant when P < 0.05 and denoted as, **, P < 0.01 and ***, P < 0.001.
Fig 10
Fig 10
Model of PHEV egress via lysosomal exocytic pathway. PHEV promotes Arl8b-dependent on lysosomal exocytosis-mediated viral egress. In addition, PHEV enhances V-ATPase assembly at lysosomes, resulting in increased lysosomal acidity by facilitating H+ transport to lysosomes and PHEV egress depends on V-ATPase-dependent lysosomal acidification.

Similar articles

References

    1. V’kovski P, Kratzel A, Steiner S, Stalder H, Thiel V. 2021. Coronavirus biology and replication: implications for SARS-CoV-2. Nat Rev Microbiol 19:155–170. doi:10.1038/s41579-020-00468-6 - DOI - PMC - PubMed
    1. Mora-Díaz JC, Piñeyro PE, Houston E, Zimmerman J, Giménez-Lirola LG. 2019. Porcine hemagglutinating encephalomyelitis virus: a review. Front Vet Sci 6:53. doi:10.3389/fvets.2019.00053 - DOI - PMC - PubMed
    1. Vijgen L, Keyaerts E, Lemey P, Maes P, Van Reeth K, Nauwynck H, Pensaert M, Van Ranst M. 2006. Evolutionary history of the closely related group 2 Coronaviruses: porcine hemagglutinating encephalomyelitis virus, bovine Coronavirus, and human Coronavirus OC43. J Virol 80:7270–7274. doi:10.1128/JVI.02675-05 - DOI - PMC - PubMed
    1. Lan Y, Li Z, Wang Z, Wang X, Wang G, Zhang J, Hu S, Zhao K, Xu B, Gao F, He W. 2020. An experimental model of neurodegenerative disease based on porcine hemagglutinating encephalomyelitis virus-related lysosomal abnormalities. Mol Neurobiol 57:5299–5306. doi:10.1007/s12035-020-02105-y - DOI - PMC - PubMed
    1. Shi J, Li Z, Zhang J, Xu R, Lan Y, Guan J, Gao R, Wang Z, Lu H, Xu B, Zhao K, Gao F, He W, van Riel D. 2020. PHEV infection: a promising model of betacoronavirus-associated neurological and olfactory dysfunction. PLoS Pathog 18:e1010667. doi:10.1371/journal.ppat.1010667 - DOI - PMC - PubMed

Publication types

MeSH terms

Substances

LinkOut - more resources