

Baited reconstruction with 2D template matching for high-resolution structure determination in vitro and in vivo without template bias
- PMID: 38010355
- PMCID: PMC10681363
- DOI: 10.7554/eLife.90486
Baited reconstruction with 2D template matching for high-resolution structure determination in vitro and in vivo without template bias
Abstract
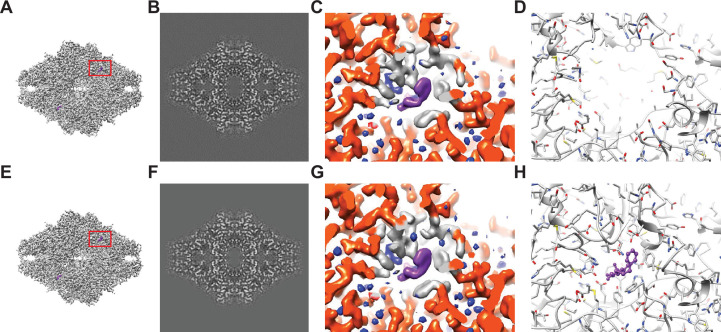
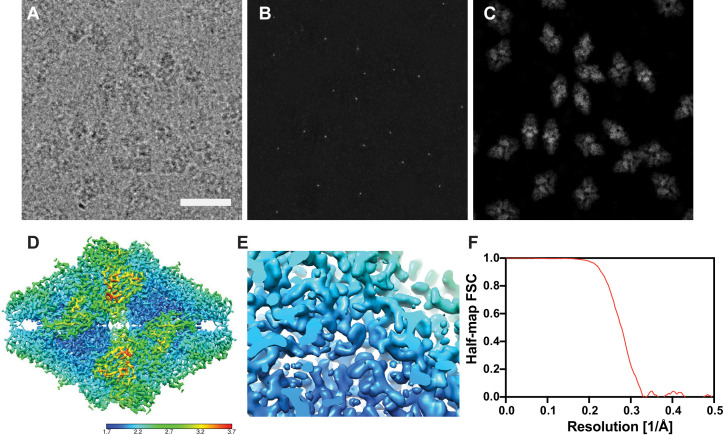
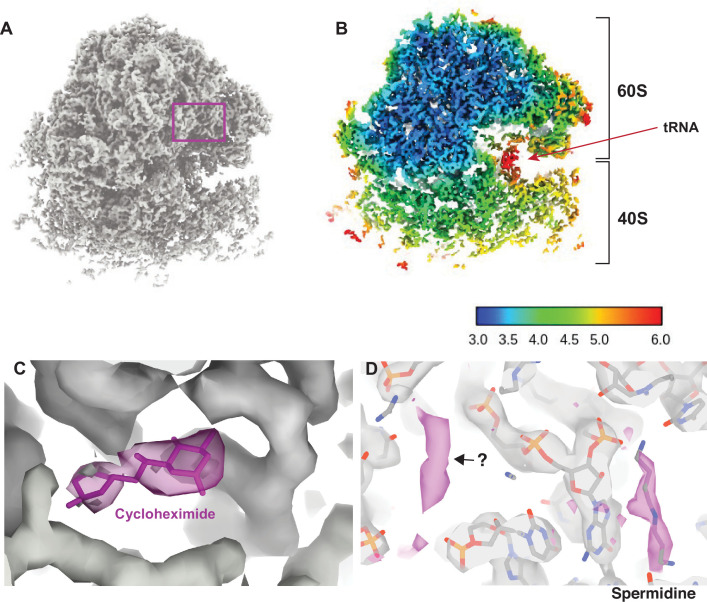
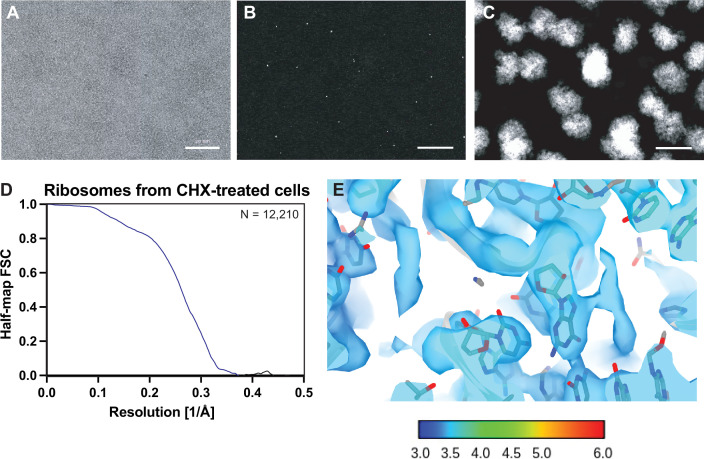
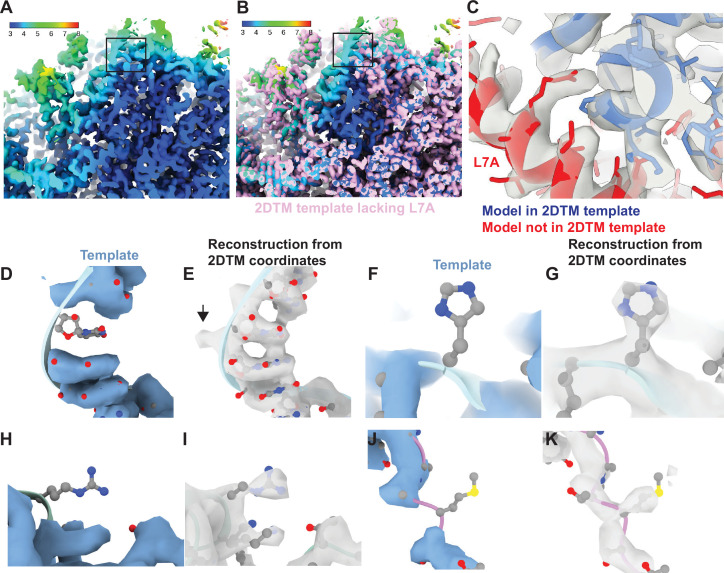
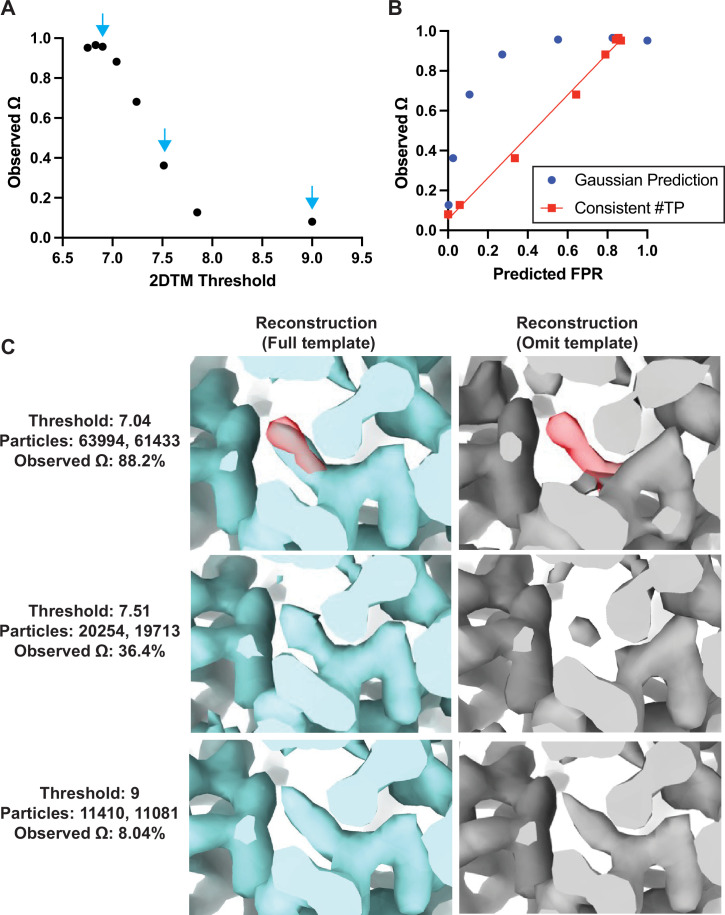
Previously we showed that 2D template matching (2DTM) can be used to localize macromolecular complexes in images recorded by cryogenic electron microscopy (cryo-EM) with high precision, even in the presence of noise and cellular background (Lucas et al., 2021; Lucas et al., 2022). Here, we show that once localized, these particles may be averaged together to generate high-resolution 3D reconstructions. However, regions included in the template may suffer from template bias, leading to inflated resolution estimates and making the interpretation of high-resolution features unreliable. We evaluate conditions that minimize template bias while retaining the benefits of high-precision localization, and we show that molecular features not present in the template can be reconstructed at high resolution from targets found by 2DTM, extending prior work at low-resolution. Moreover, we present a quantitative metric for template bias to aid the interpretation of 3D reconstructions calculated with particles localized using high-resolution templates and fine angular sampling.
Keywords: 3D structure; E. coli; S. cerevisiae; cell biology; cryo-EM; electron microscopy; image analysis; in situ; molecular biophysics; ribosome; structural biology.
© 2023, Lucas et al.
Conflict of interest statement
BL, BH These authors are listed as inventors on a closely related patent application named "Methods and Systems for Imaging Interactions Between Particles and Fragments", filed on behalf of the University of Massachusetts. The patent relates to the use of the 2DTM method described in this manuscript, to image ligands and drugs bound to larger complexes that can be detected by 2DTM, NG This author is also listed as an inventor on a closely related patent application named "Methods and Systems for Imaging Interactions Between Particles and Fragments", filed on behalf of the University of Massachusetts. The patent relates to the use of the 2DTM method described in this manuscript, to image ligands and drugs bound to larger complexes that can be detected by 2DTM. Reviewing editor, eLife
Figures


Update of
- doi: 10.1101/2023.07.03.547552
- doi: 10.7554/eLife.90486.1
- doi: 10.7554/eLife.90486.2
Similar articles
-
A new statistical metric for robust target detection in cryo-EM using 2D template matching.IUCrJ. 2025 Mar 1;12(Pt 2):155-176. doi: 10.1107/S2052252524011771. IUCrJ. 2025. PMID: 39819740 Free PMC article.
-
Locating macromolecular assemblies in cells by 2D template matching with cisTEM.Elife. 2021 Jun 11;10:e68946. doi: 10.7554/eLife.68946. Elife. 2021. PMID: 34114559 Free PMC article.
-
In situ single particle classification reveals distinct 60S maturation intermediates in cells.Elife. 2022 Aug 25;11:e79272. doi: 10.7554/eLife.79272. Elife. 2022. PMID: 36005291 Free PMC article.
-
[A review of automatic particle recognition in Cryo-EM images].Sheng Wu Yi Xue Gong Cheng Xue Za Zhi. 2010 Oct;27(5):1178-82. Sheng Wu Yi Xue Gong Cheng Xue Za Zhi. 2010. PMID: 21089695 Review. Chinese.
-
Cryo electron microscopy to determine the structure of macromolecular complexes.Methods. 2016 Feb 15;95:78-85. doi: 10.1016/j.ymeth.2015.11.023. Epub 2015 Nov 27. Methods. 2016. PMID: 26638773 Free PMC article. Review.
Cited by
-
A new statistical metric for robust target detection in cryo-EM using 2D template matching.IUCrJ. 2025 Mar 1;12(Pt 2):155-176. doi: 10.1107/S2052252524011771. IUCrJ. 2025. PMID: 39819740 Free PMC article.
-
Mechanisms of COPII coat assembly and cargo recognition in the secretory pathway.Nat Rev Mol Cell Biol. 2025 Mar 25:10.1038/s41580-025-00839-y. doi: 10.1038/s41580-025-00839-y. Online ahead of print. Nat Rev Mol Cell Biol. 2025. PMID: 40133632 Free PMC article. Review.
-
Structural biology inside multicellular specimens using electron cryotomography.Q Rev Biophys. 2025 Jan 13;58:e6. doi: 10.1017/S0033583525000010. Q Rev Biophys. 2025. PMID: 39801355 Free PMC article. Review.
-
Bridging structural and cell biology with cryo-electron microscopy.Nature. 2024 Apr;628(8006):47-56. doi: 10.1038/s41586-024-07198-2. Epub 2024 Apr 3. Nature. 2024. PMID: 38570716 Free PMC article. Review.
-
Microtubules in Martini: Parameterizing a heterogeneous elastic-network towards a mechanically accurate microtubule.PNAS Nexus. 2025 Jun 21;4(7):pgaf202. doi: 10.1093/pnasnexus/pgaf202. eCollection 2025 Jul. PNAS Nexus. 2025. PMID: 40599826 Free PMC article.
References
-
- Baek M, DiMaio F, Anishchenko I, Dauparas J, Ovchinnikov S, Lee GR, Wang J, Cong Q, Kinch LN, Schaeffer RD, Millán C, Park H, Adams C, Glassman CR, DeGiovanni A, Pereira JH, Rodrigues AV, van Dijk AA, Ebrecht AC, Opperman DJ, Sagmeister T, Buhlheller C, Pavkov-Keller T, Rathinaswamy MK, Dalwadi U, Yip CK, Burke JE, Garcia KC, Grishin NV, Adams PD, Read RJ, Baker D. Accurate prediction of protein structures and interactions using a three-track neural network. Science. 2021;373:871–876. doi: 10.1126/science.abj8754. - DOI - PMC - PubMed
-
- Bhat TN, Cohen GH. OMITMAP: An electron density map suitable for the examination of errors in a macromolecular model. Journal of Applied Crystallography. 1984;17:244–248. doi: 10.1107/S0021889884011456. - DOI
MeSH terms
Substances
Grants and funding
LinkOut - more resources
Full Text Sources
