. 2023 Nov 27;18(11):e0294508.
doi: 10.1371/journal.pone.0294508. eCollection 2023.

Nrf1 is not a direct target gene of SREBP1, albeit both are integrated into the rapamycin-responsive regulatory network in human hepatoma cells

Affiliations

Nrf1 is not a direct target gene of SREBP1, albeit both are integrated into the rapamycin-responsive regulatory network in human hepatoma cells

Keli Liu et al. PLoS One. .

Abstract

The essential role of protein degradation by ubiquitin-proteasome system is exerted primarily for maintaining cellular protein homeostasis. The transcriptional activation of proteasomal genes by mTORC1 signaling depends on Nrf1, but whether this process is directly via SREBP1 remains elusive. In this study, our experiment evidence revealed that Nrf1 is not a direct target of SREBP1, although both are involved in the rapamycin-responsive regulatory networks. Closely scrutinizing two distinct transcriptomic datasets unraveled no significant changes in transcriptional expression of Nrf1 and almost all proteasomal subunits in either siSREBP2-silencing cells or SREBP1-∕-MEFs, when compared to equivalent controls. However, distinct upstream signaling to Nrf1 dislocation by p97 and its processing by DDI1/2, along with downstream proteasomal expression, may be monitored by mTOR signaling, to various certain extents, depending on distinct experimental settings in different types of cells. Our further evidence has been obtained from DDI1-∕-(DDI2insC) cells, demonstrating that putative effects of mTOR on the rapamycin-responsive signaling to Nrf1 and proteasomes may also be executed partially through a DDI1/2-independent mechanism, albeit the detailed regulatory events remain to be determined.


Conflict of interest statement

The authors have declared that no competing interests exist.

Figures

Fig 1
Fig 1. Transcriptional expression of Nrf1 and its reporter is unaffected by SREBP1 or rapamycin.
(A to D) Two cell lines of HepG2 (A, B) and L7702 (C, D), that had been transfected with: (A, C) siNC (a negative control) or siSREBP1; (B, D) a pSREBP1 expression construct or empty plasmid, were subjected to real-time qPCR analysis of mRNA expression levels of SREBP1 and Nrf1 (n = 3×3; with significant decreases (*, p<0.01), significant increases ($, p<0.01), or no significances (NS)). (E to H) HepG2 cells, that had been transfected with pNrf1-luc (E, F) or pNrf2-luc (G, H) reporters, along with pRL-TK (an internal control) and then treated for 24 h with rapamycin (RAPA, at 0, 100 or 200 nM) (E, G), NAC (10 mM) or tBHQ (50 μM) (F, H), were subjected to an assay of dual-luciferase activity (n = 3×3) with significant increases ($, p<0.01) or no significances (NS). All the results representing at least three independent experiments, each of which was performed in triplicates, were determined as fold changes (mean ± S.D.) relative to equivalent controls.
Fig 2
Fig 2. The upstream signaling to Nrf1 and proteasome are to no or fewer degrees, affected in SREBP1-deficient cells.
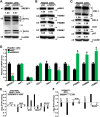
(A to C) HepG2 cells were transfected with siNC or siSREBP1 for 24 h and then subjected to Western blotting with those indicated antibodies. The intensity of immunoblots representing each protein was quantified by the Quantity-One software and shown on the bottom. (D) The mRNA levels of those examined genes were determined by real-time qPCR and shown as fold changes (mean ± S.D. n = 3×3) with significant decreases (*, p<0.01) or significant increases ($, p<0.01) relative to equivalent controls. These results are representative of at least three independent experiments, each of which was performed in triplicates. (E, F) No significant changes in transcriptional expression of Nrf1 and other homologous factors were determined by transcriptomic sequencing of siSREBP2 vs siNC (https://www.ncbi.nlm.nih.gov/geo/query/acc.cgi?acc=GSE93980) in PANC-1 cells (E), as well as SREBP1–∕–vs Wild-type MEFs (https://www.ncbi.nlm.nih.gov/geo/query/acc.cgi?acc=GSE90571) (F).
Fig 3
Fig 3. Distinct effects of rapamycin on FBS-altered expression of SREBP1, Nrf1 and relevant signaling molecules.
(A) HepG2 cells that had been starved in a serum-free medium for 10 h and then stimulated for 12 or 24 h by feeding 10% FBS, were subjected to real-time qPCR analysis of Nrf1 and SREBP1 at mRNA expression levels. The results were shown as fold changes (mean ± S.D. n = 3×3) with significant decreases (*, p<0.01; **, p<0.001) relative to the negative controls (NC, with no FBS treatment). (B to F) The free-serum starved HepG2 cells were treated with 10% FBS alone or plus 20 nM RAPA for 0, 12, 24 h, before being subjected to Western blotting with indicated antibodies (B, C, E), in which the intensity of immunoblots was calculated and shown on the bottom, or real-time qPCR analysis of indicated genes at mRNA levels (D, F). The results were shown as fold changes (mean ± S.D. n = 3×3) with significant decreases (*, p<0.01; **, p<0.001), significant increases ($, p<0.01; $$, p<0.001), or no significant differences (NS), relative to their equivalent controls. These results are representative of at least three independent experiments, each of which was performed in triplicates.
Fig 4
Fig 4. Changed processing of Nrf1 in DDI1/2-deficient cells, but with no different xenograft models.
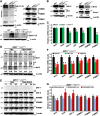
(A) HepG2-derived DDI1–∕–cells were initially identified by their genomic DNA-sequencing. The results were shown graphically, along with the alignment of two mutant alleles and wild-type (WT). (B, C) In contrast with WT cells, DDI1–∕–cells were further determined by real-time qPCR (B, shown by mean ± S.D. n = 3×3; *, p<0.01) and Western blotting (C), respectively. (D) No different phenotypes of xenograft tumors in nude mice were observed after murine subcutaneous inoculation of WT and DDI1–∕–(DDI2insC) hepatoma cells. (D) No differences in both tumorigenesis and in vivo growth between WT and DDI1/2-deficient and xenograft tumors were measured in size every two days, before being sacrificed. The results are shown as mean ± S.D. (n = 5). (F) The pathohistological images were obtained by routine HE staining of the aforementioned xenograft tumor tissues. (G, H) Both lines of WT and KO (i.e. DDI1–∕–DDI2insC) cells were treated with MG132 at 0, 1 or 10 μM for 24 h (G, H) or 4 h (H), and then subjected to Western blotting with distinct antibodies against Nrf1, DDI1 or DDI2. In addition, a long-term exposed image was cropped from part of the corresponding gel (G). These results are representative of at least three independent experiments, each of which was performed in triplicates.
Fig 5
Fig 5. DDI1/2-deficient effects on the rapamycin-responsive signaling to Nrf1 and proteasome.
(A) WT and DDI1–∕–(DDI2insC) cell lines were transfected with an expression construct for Nrf1-V5 (+) or empty pcDNA3 vector (–) and then examined by Western blotting with V5 antibody (a1, a3); ß-actin acts as a loading control. Their untransfected cells were also measured by immunoblotting of the core proteasomal subunits PSMB5, PSMB6, and PSMB7 (a5 to a7). (B) Further immunoblotting of DDI2, p97, Nrf2 and Keap1 was conducted in untreated WT and DDI1–∕–(DDI2insC) cell lines. (C) Both cell lines were further assessed by real-time qPCR analysis of mRNA expression levels. The results were shown as fold changes (mean ± S.D. n = 3×3) with a significant decrease (*, p<0.01) relative to control values. (D to G) The starved DDI1–∕–(DDI2insC) cells were treated by feeding 10% FBS alone or plus RAPA (20 nM) for 0, 12 or 24 h, and then subjected to Western blotting with distinct antibodies (D, E) and real-time qPCR analysis of mRNA expression (F, G). The resulting data were shown as fold changes (mean ± S.D. n = 3×3), with a significant decrease (*, p<0.01) or significant increases ($, p<0.01) relative to control values. The results are representative of at least three independent experiments, each of which was performed in triplicates.
Fig 6
Fig 6. A model is proposed for a better understanding of the rapamycin-responsive signaling to Nrf1 and proteasomes.
The ER-localized Nrf1 manifests its unique topobiological behavior with specific dislocation by p97 and proteolytic processing by DDI1/2 and proteasomes, to give rise to a mature N-terminally-truncated isoform of this CNC-bZIP factor that mediates proteasomal transcriptional expression. Herein, we found that Nrf1 is not a direct target of SREBP1 (required for lipid and cholesterol metabolism) and Nrf1-target proteasomal transcription is almost not induced, but rather inhibited by SREBP1, although both factors are also integrated into the rapamycin-responsive signaling networks. Besides, differential expression levels of p97, DDI1/2 and Nrf2 may be monitored by mTOR signaling, to various certain extents, depending on the distinct experimental settings in distinct cell types. These detailed regulatory mechanisms should warrant in-depth studies.

References

    1. Lopez-Otin C. and Kroemer G., Hallmarks of health. Cell, 2021. 184(7): p. 1929–1939. doi: 10.1016/j.cell.2021.03.033 - DOI - PubMed
    1. Hanahan D. and Weinberg R.A., Hallmarks of cancer: the next generation. Cell, 2011. 144(5): p. 646–74. doi: 10.1016/j.cell.2011.02.013 - DOI - PubMed
    1. Lopez-Otin C., et al.., The hallmarks of aging. Cell, 2013. 153(6): p. 1194–217. doi: 10.1016/j.cell.2013.05.039 - DOI - PMC - PubMed
    1. Kotas M.E. and Medzhitov R., Homeostasis, inflammation, and disease susceptibility. Cell, 2015. 160(5): p. 816–827. doi: 10.1016/j.cell.2015.02.010 - DOI - PMC - PubMed
    1. Osinalde N., et al.., Impaired proteostasis in rare neurological diseases. Semin Cell Dev Biol, 2019. 93: p. 164–177. doi: 10.1016/j.semcdb.2018.10.007 - DOI - PubMed

MeSH terms

Substances