. 2023 Dec 5;120(49):e2305776120.
doi: 10.1073/pnas.2305776120. Epub 2023 Nov 27.

Transcriptional signatures of early-life stress and antidepressant treatment efficacy

Affiliations

Transcriptional signatures of early-life stress and antidepressant treatment efficacy

Sero Toriano Parel et al. Proc Natl Acad Sci U S A. .

Abstract

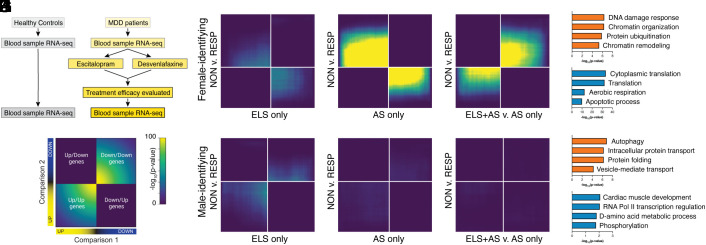
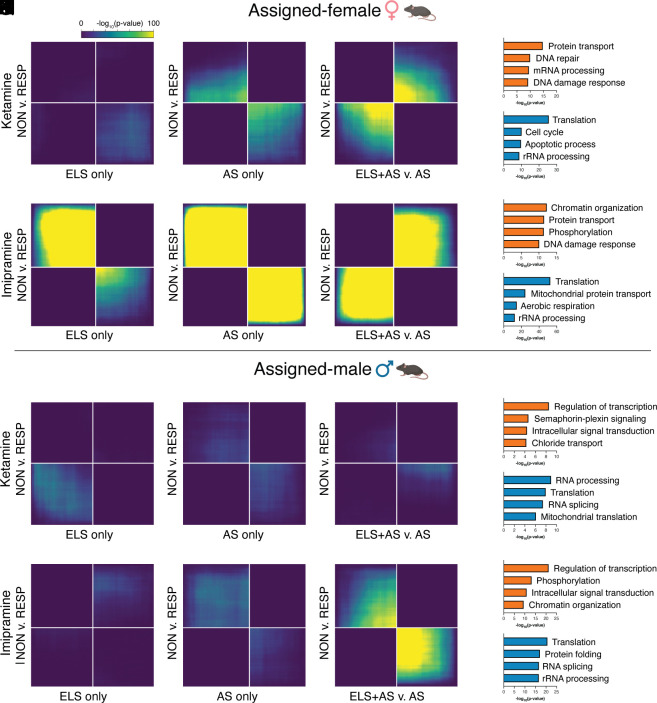
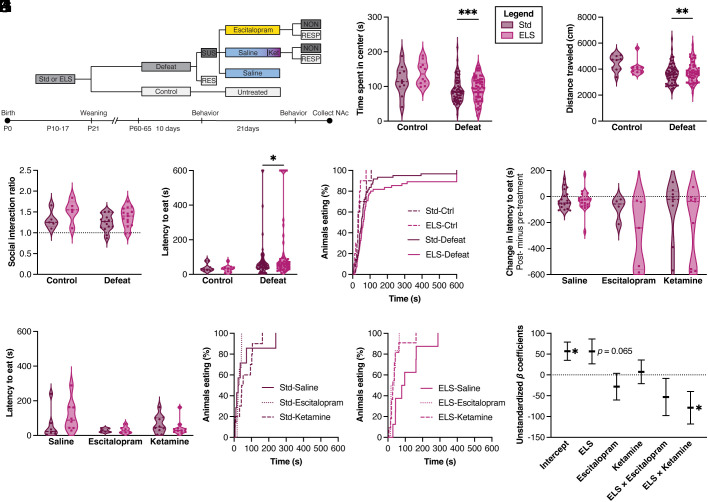
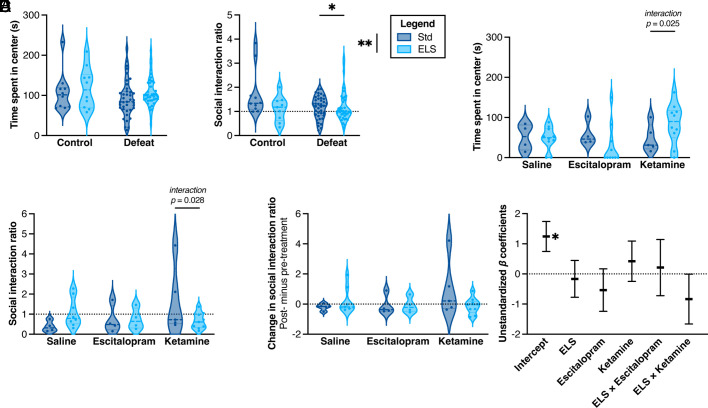
Individuals with a history of early-life stress (ELS) tend to have an altered course of depression and lower treatment response rates. Research suggests that ELS alters brain development, but the molecular changes in the brain following ELS that may mediate altered antidepressant response have not been systematically studied. Sex and gender also impact the risk of depression and treatment response. Here, we leveraged existing RNA sequencing datasets from 1) blood samples from depressed female- and male-identifying patients treated with escitalopram or desvenlafaxine and assessed for treatment response or failure; 2) the nucleus accumbens (NAc) of female and male mice exposed to ELS and/or adult stress; and 3) the NAc of mice after adult stress, antidepressant treatment with imipramine or ketamine, and assessed for treatment response or failure. We find that transcriptomic signatures of adult stress after a history of ELS correspond with transcriptomic signatures of treatment nonresponse, across species and multiple classes of antidepressants. Transcriptomic correspondence with treatment outcome was stronger among females and weaker among males. We next pharmacologically tested these predictions in our mouse model of early-life and adult social defeat stress and treatment with either chronic escitalopram or acute ketamine. Among female mice, the strongest predictor of behavior was an interaction between ELS and ketamine treatment. Among males, however, early experience and treatment were poor predictors of behavior, mirroring our bioinformatic predictions. These studies provide neurobiological evidence for molecular adaptations in the brain related to sex and ELS that contribute to antidepressant treatment response.

Keywords: RNA sequencing; antidepressants; depression; early-life stress/adversity; nucleus accumbens.


Conflict of interest statement

Competing interests statement:The authors declare no competing interest.

Figures

Fig. 1.
Fig. 1.
Comparing transcriptomic patterns of early-life and/or adult stress in mice with antidepressant treatment efficacy in humans. (A) Study design for white blood cell (WBC)-derived RNA-seq from healthy control subjects or patients with major depressive disorder (MDD), taken before and after antidepressant treatment with either escitalopram or desvenlafaxine and assessed for treatment response or nonresponse. (B) Key for threshold-free comparisons of differentially expressed genes (DEGs) by two-sided rank–rank hypergeometric overlap (RRHO) analysis: Genes may be coregulated or oppositely regulated between two comparisons. Pixels represent the overlap between DEGs in each comparison. The significance of overlap [−log10(P-value)] of a hypergeometric test is color-coded, with a fixed maximum of 100 across all comparisons shown. Genes along each axis are sorted from most to least significantly regulated from the middle to outer corners. (C–E) RRHO’s comparing DEGs related to treatment efficacy from female WBC with DEGs related to ELS and/or AS from female mouse NAc. Gene ontology analysis of genes co-up-regulated (orange, F) or co-down-regulated (teal, G) from (E). (H–J) RRHO’s comparing DEGs related to treatment efficacy from male WBC with DEGs related to ELS and/or AS from male mouse NAc. Gene ontology analysis of genes co-up-regulated (orange, K) or co-down-regulated (teal, L) from (J). ELS-only and AS-only DEGs are vs. standard-reared control; ELS+AS DEGs are v. AS alone to assess the difference in gene expression after AS with vs. without prior ELS.
Fig. 2.
Fig. 2.
Comparing transcriptomic patterns of early-life and/or adult stress with antidepressant treatment efficacy within mouse NAc. Threshold-free RRHO analysis compares gene expression changes after ELS and/or AS with expression changes between antidepressant nonresponse vs. response, all within mouse NAc. Genes may be coregulated or oppositely regulated between two comparisons. Pixels represent the overlap between DEGs in each comparison, with the significance of overlap [−log10(P-value)] of a hypergeometric test color-coded, with a fixed maximum of 100 across all comparisons. RRHO comparisons were made separately for assigned-female (AJ) and assigned-male (KT) mice against datasets for both ketamine and imipramine treatment efficacy from male mouse NAc, as indicated. Gene ontology analysis was performed for genes co-up-regulated (orange) or co-down-regulated (teal) from ELS+AS vs. AS comparisons: (D and E) correspond to C; (I and J) correspond to H; (N and O) correspond to M; and (S and T) correspond to R.
Fig. 3.
Fig. 3.
Behavioral testing of assigned-female mice. (A) Schematic of behavior and pharmacology timeline. Mice were first tested after social defeat stress and prior to pharmacological treatment (BF; n = 10, 10, 60, 55), and again after treatment with either saline, 21 d of escitalopram, or 1 d of ketamine (G-K; n=7, 8, 6, 6, 10, 11). Open-field test: (B) Time spent in the center of an arena [main effect of social defeat stress: two-way ANOVA, F(1,132) = 17.32, P < 0.001]. (C) The total distance traveled in an arena was decreased by social defeat stress [F(1,132) = 10.40, P = 0.0016]. Social interaction: (D) Ratio of time spent in interaction zone with v. without aggressor (main effect of ELS: F(1,36) = 4.406, P = 0.0429). Novelty-suppressed feeding: (E) Pretreatment latency to eat [main effect of social defeat: F(1,131) = 3.966, P = 0.0485; main effect of ELS: F(1,30) = 7.611, P = 0.010. (F) Survival curve analysis of pretreatment latency to eat (log-rank Mantel–Cox across all groups: X2 = 17.98, P = 0.0004; between Std-Defeat and ELS-Defeat: X2 = 11.32, P = 0.0008; trend between Std-Ctrl and ELS-Ctrl: X2 = 2.846, P = 0.0916]. (G) Difference in latency to eat before and after treatment [escitalopram: two-way ANOVA, F(1,30) = 24.407, P < 0.001; ELS: F(1,30) = 7.611, P = 0.010; ELS × escitalopram interaction: F(1,30) = 9.375, P = 0.005]. (H) Posttreatment latency to eat [escitalopram v. saline: two-way ANOVA, F(1,30) = 24.407, P < 0.001]. (I and J) Survival curve of posttreatment latency (significant difference across all groups: log-rank Mantel–Cox, X2 = 16.83, P = 0.0185). (J) Among ELS mice, NSF latency differed between ELS-Def-Sal and ELS-Def-Esc groups (X2 = 7.932, P = 0.0049) and between ELS-Def-Sal and ELS-Def-Ket (X2 = 6.117, P = 0.0134). (K) Fixed effects model of posttreatment latency to eat as a function of stress and treatment [trend in overall difference across all groups: F(5,42) = 2.229, r2 = 0.2097, P = 0.0691; significant main effect of ELS: B = 56.48, t = 1.892, P = 0.0654; ELS × ketamine interaction (B = −78.94, t = 2.021, P = 0.0498), no main effect of escitalopram (B = −28.249, t = 0.880, P = 0.3837), and no ELS × escitalopram interaction (B = −53.19, P = 0.24)].
Fig. 4.
Fig. 4.
Behavioral testing of assigned-male mice. Mice were first tested after social defeat stress and prior to pharmacological treatment (A and B; n = 10, 10, 40, 38), and again after treatment with either saline, 21 d of escitalopram, or 1 d of ketamine (CF; n = 4, 8, 4, 4, 5, 9). Open-field test: (A) Time spent in the center of an arena did not significantly differ by group. SI: (B) Ratio of time spent in interaction zone with vs. without aggressor [main effect of ELS: two-way ANOVA: F(1,94) = 7.662, P = 0.0068; main effect of social defeat: F(1,94) = 5.620, P = 0.0198; interaction of ELS × social defeat: F(1,94) = 4.401, P = 0.0386]. (C) Posttreatment time spent in the center of an arena in the open-field test [interaction of ELS × ketamine: F(1,21) = 5.841, P = 0.025]. (D) Posttreatment SI ratio [interaction of ELS × ketamine: F(1,22) = 5.546, P = 0.028]. (E) Difference in SI ratio before and after treatment [trend in the interaction of ELS × ketamine: F(1,22) = 3.479, P = 0.076]. (F) Fixed effects model of posttreatment latency to eat as a function of stress and treatment was not significant overall.

References

    1. Akil H., et al. , Treatment resistant depression: A multi-scale, systems biology approach. Neurosci. Biobehav. Rev. 84, 272–288 (2018). - PMC - PubMed
    1. Hoffman B., An overview of depression among transgender women. Depress. Res. Treat. 2014, 394283 (2014). - PMC - PubMed
    1. Witcomb G. L., et al. , Levels of depression in transgender people and its predictors: Results of a large matched control study with transgender people accessing clinical services. J. Affect. Disord. 235, 308–315 (2018). - PubMed
    1. Pellicane M. J., Ciesla J. A., Associations between minority stress, depression, and suicidal ideation and attempts in transgender and gender diverse (TGD) individuals: Systematic review and meta-analysis. Clin. Psychol. Rev. 91, 102113 (2022). - PubMed
    1. Geschwind D. H., Flint J., Genetics and genomics of psychiatric disease. Science 349, 1489–1494 (2015). - PMC - PubMed

LinkOut - more resources