. 2023 Dec 5;120(49):e2305778120.
doi: 10.1073/pnas.2305778120. Epub 2023 Nov 27.

Social stress induces autoimmune responses against the brain

Affiliations

Social stress induces autoimmune responses against the brain

Yusuke Shimo et al. Proc Natl Acad Sci U S A. .

Abstract

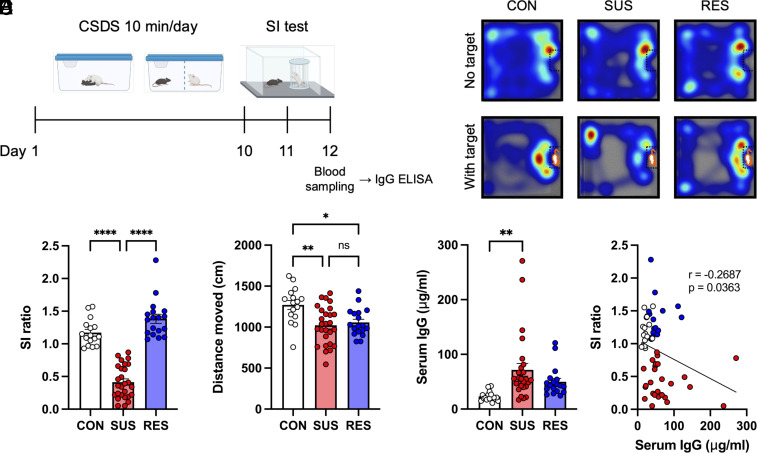
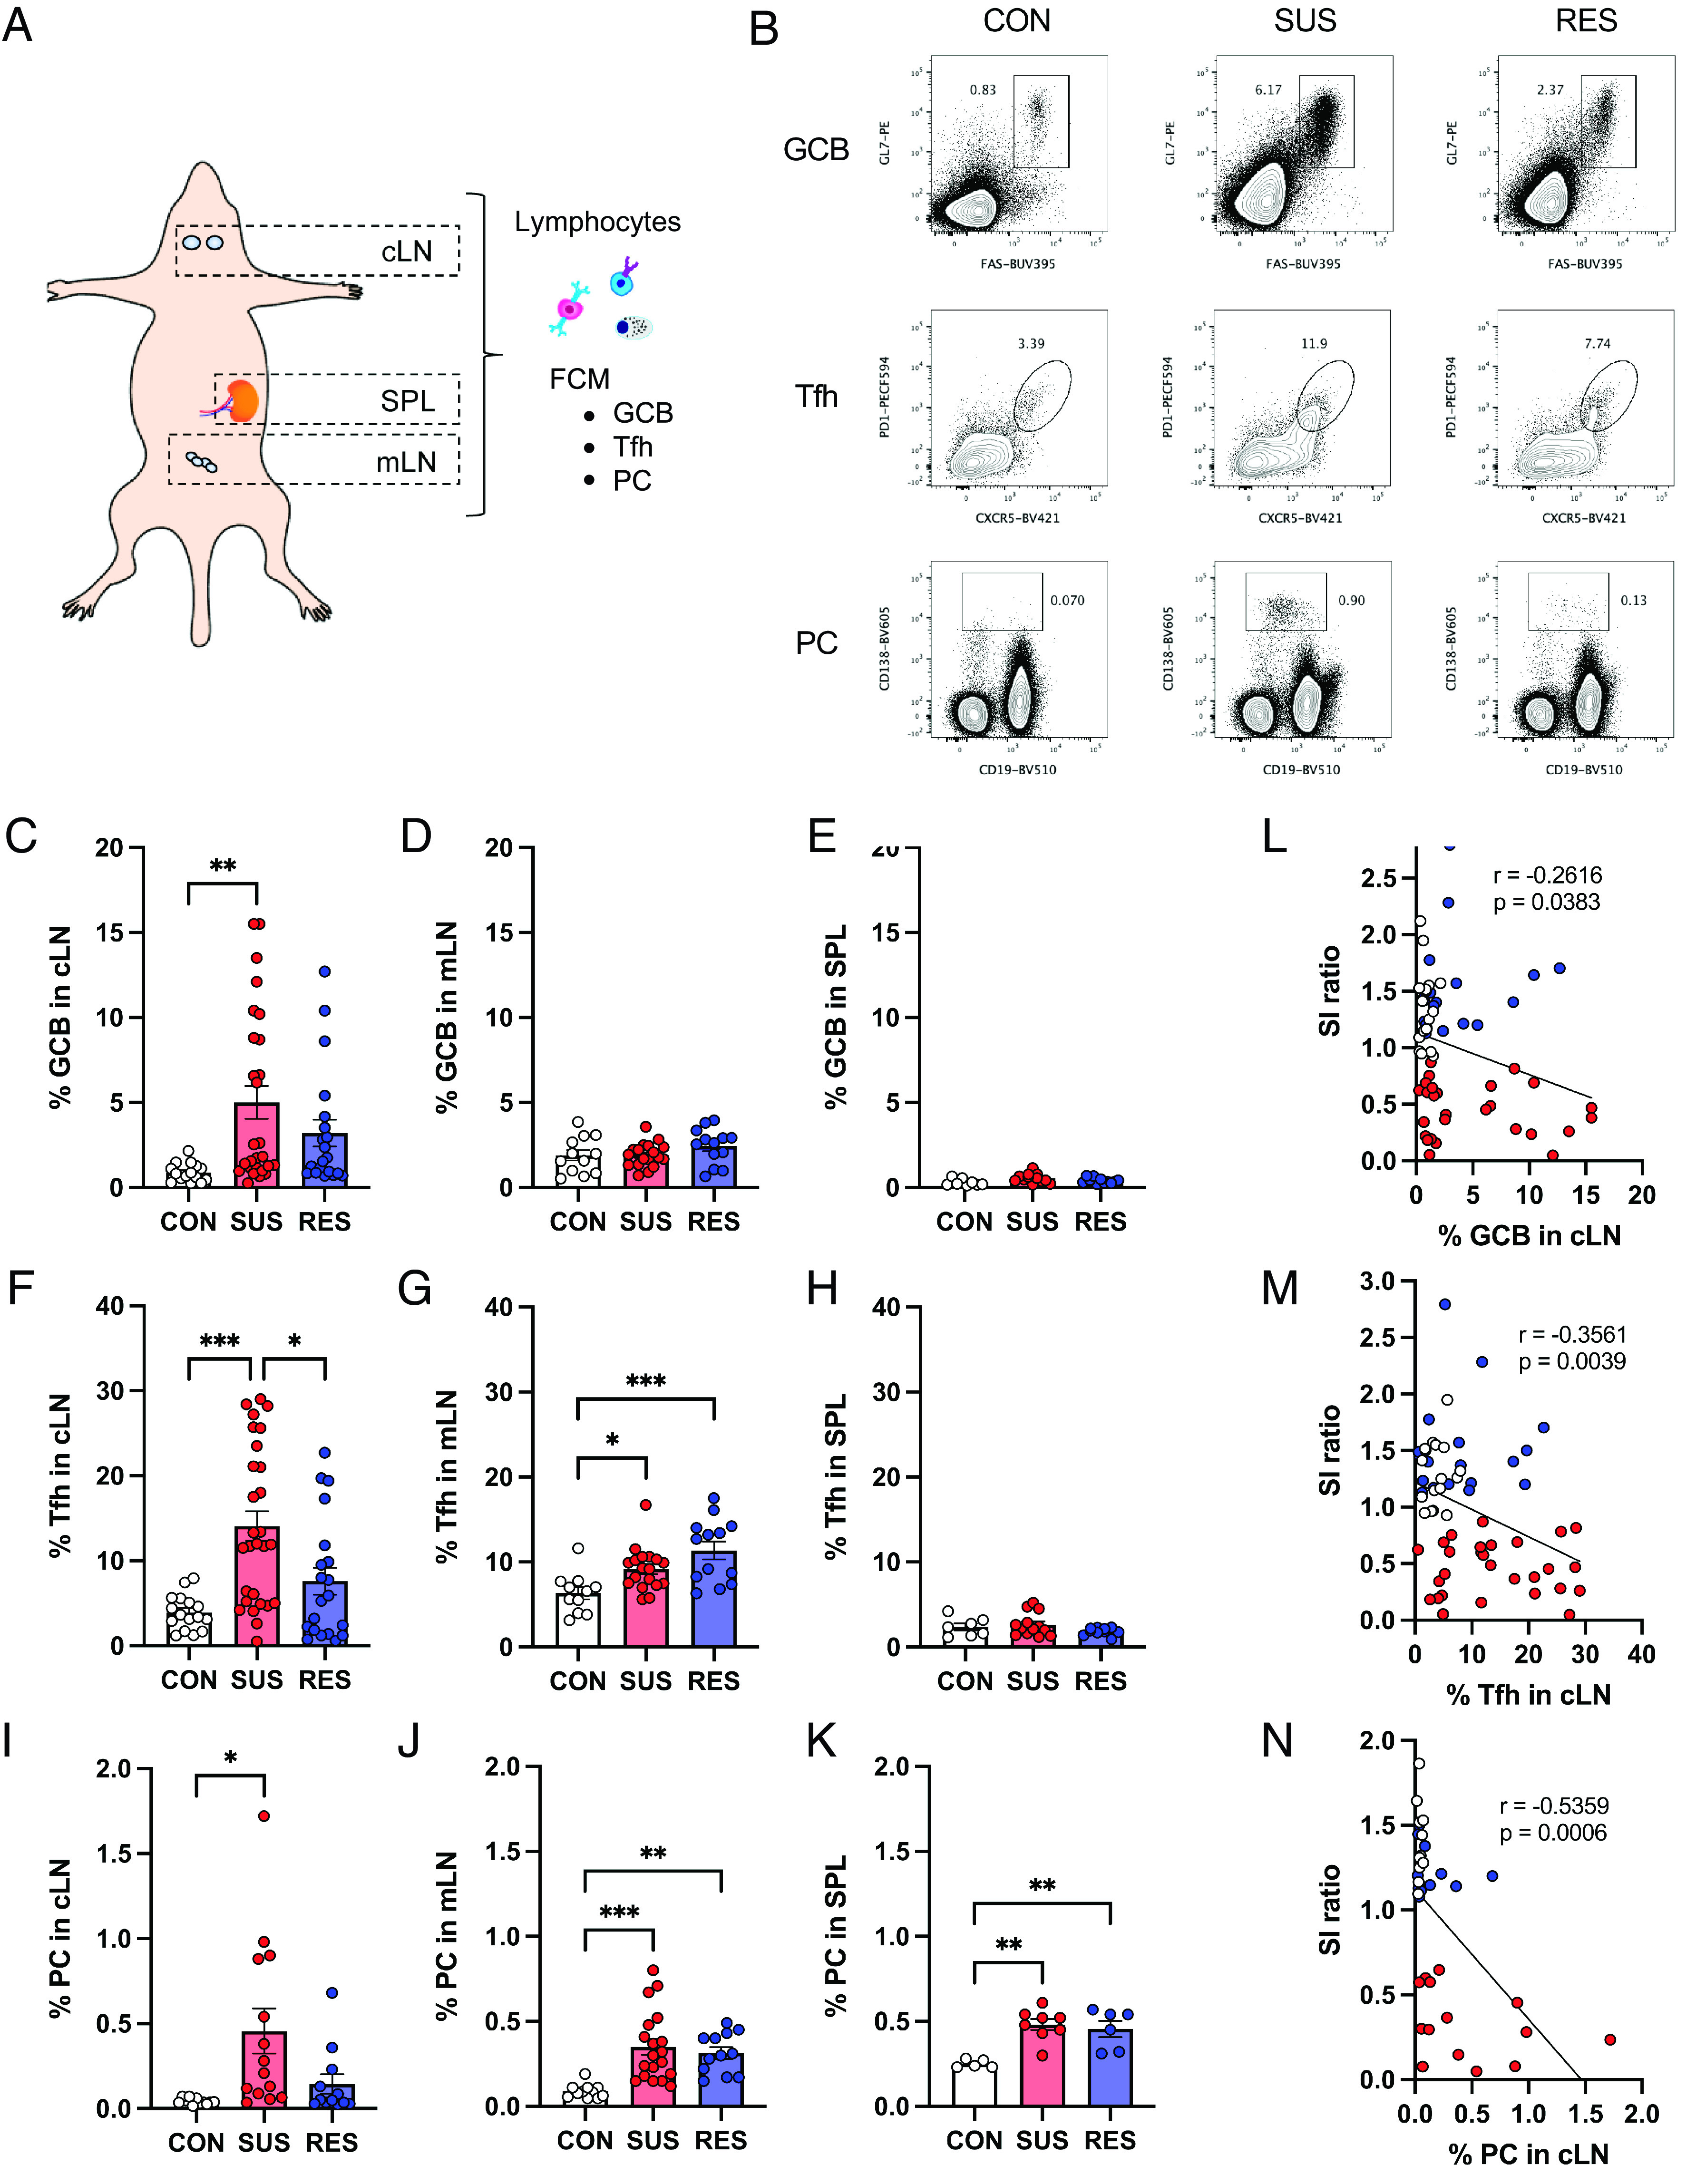
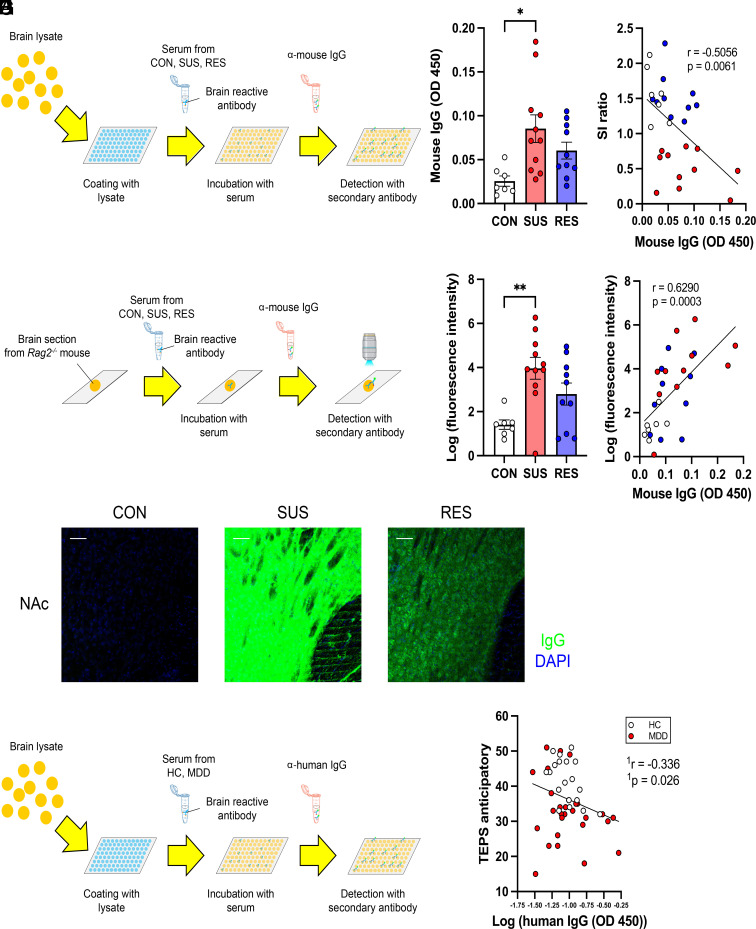
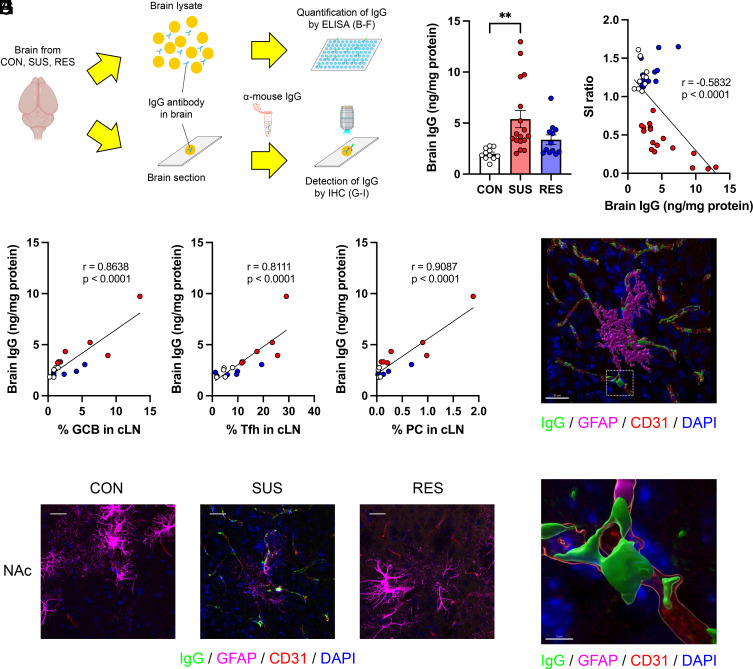
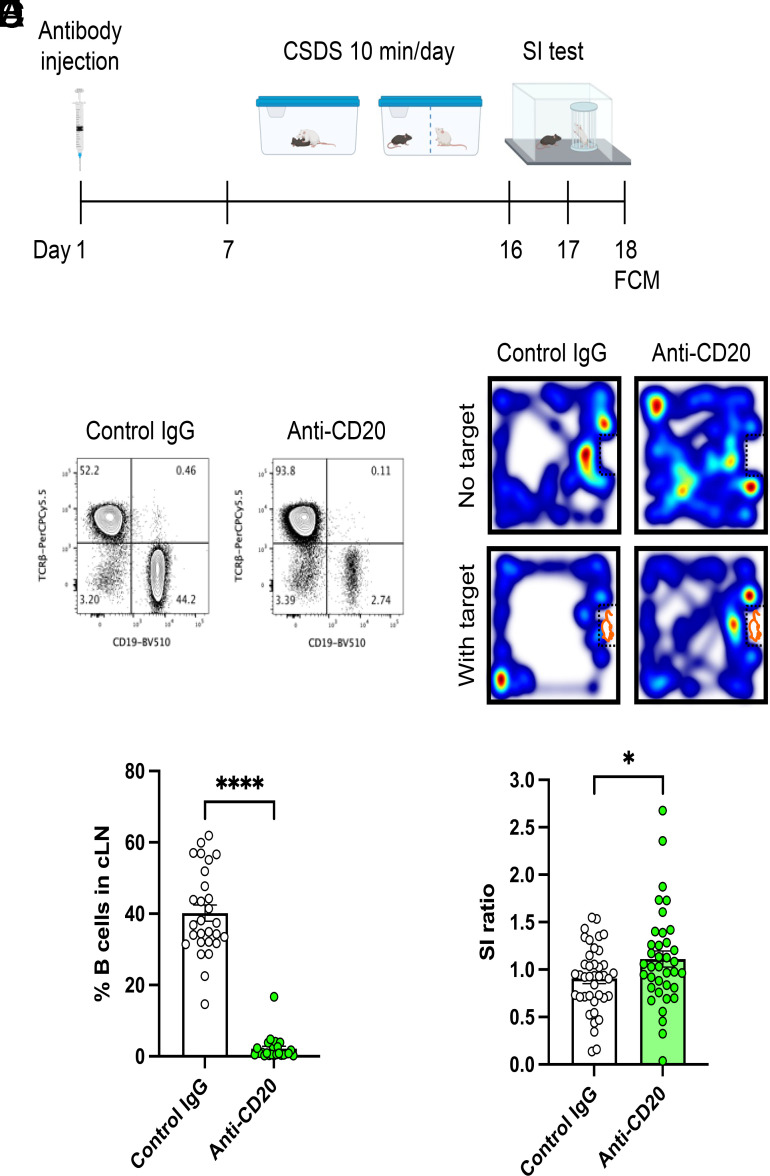
Clinical studies have revealed a high comorbidity between autoimmune diseases and psychiatric disorders, including major depressive disorder (MDD). However, the mechanisms connecting autoimmunity and depression remain unclear. Here, we aim to identify the processes by which stress impacts the adaptive immune system and the implications of such responses to depression. To examine this relationship, we analyzed antibody responses and autoimmunity in the chronic social defeat stress (CSDS) model in mice, and in clinical samples from patients with MDD. We show that socially stressed mice have elevated serum antibody concentrations. We also confirm that social stress leads to the expansion of specific T and B cell populations within the cervical lymph nodes, where brain-derived antigens are preferentially delivered. Sera from stress-susceptible (SUS) mice exhibited high reactivity against brain tissue, and brain-reactive immunoglobulin G (IgG) antibody levels positively correlated with social avoidance behavior. IgG antibody concentrations in the brain were significantly higher in SUS mice than in unstressed mice, and positively correlated with social avoidance. Similarly, in humans, increased peripheral levels of brain-reactive IgG antibodies were associated with increased anhedonia. In vivo assessment of IgG antibodies showed they largely accumulate around blood vessels in the brain only in SUS mice. B cell-depleted mice exhibited stress resilience following CSDS, confirming the contribution of antibody-producing cells to social avoidance behavior. This study provides mechanistic insights connecting stress-induced autoimmune reactions against the brain and stress susceptibility. Therapeutic strategies targeting autoimmune responses might aid in the treatment of patients with MDD featuring immune abnormalities.

Keywords: adaptive immunity; blood-brain barrier; depression; lymphocytes; stress.


Conflict of interest statement

Competing interests statement:Y.S. is currently a full time employee of Shionogi & Co., Ltd. This work is independent of Y.S.’s affiliation with Shionogi & Co., Ltd and was performed solely while serving as a visiting scholar at Mount Sinai.

Figures

Fig. 1.
Fig. 1.
Increased antibody production in SUS mice. (A) Experimental outline: Ten days of CSDS followed by a SI test, blood sampling, and ELISA. (B) Representative heatmaps of the CON, SUS, and RES mouse behavior during the SI test. (C) Social behavior in the CSDS model assessed by the SI test (CON: n = 16, SUS: n = 27, RES: n = 18, F (2, 58) = 91.70, P < 0.0001). (D) Distance moved during the SI test (no target) (CON: n = 16, SUS: n = 27, RES: n = 18, F (2, 58) = 7.518, P = 0.0012). (E) Total IgG antibody concentrations in sera (CON: n = 16, SUS: n = 27, RES: n = 18, F (2, 58) = 6.454, P = 0.0029). (F) Correlation between SI ratio and serum IgG antibody concentrations (CON: n = 16, SUS: n = 27, RES: n = 18, r = −0.2687, P = 0.0363). Data represented as mean ± SEM were analyzed by one-way ANOVA with Bonferroni post hoc test (*P < 0.05, **P < 0.01, ****P < 0.0001, ns: not significant). Correlation was evaluated by Pearson correlation analysis.
Fig. 2.
Fig. 2.
Preferential induction of immune cell populations controlling the germinal center reaction in brain-draining lymph nodes from SUS mice. (A) Anatomical diagram showing the locations of lymphoid organs assessed by FCM. (B) Representative FCM plots of GCB, Tfh, and PC in cLN from CON, SUS, and RES mice. (C–K) Percentages of GCB in (C) cLN (CON: n = 15, SUS: n = 27, RES: n = 20, F (2, 59) = 5.44, P = 0.0068), (D) mLN (CON: n = 12, SUS: n = 18, RES: n = 13, F (2, 40) = 1.478, P = 0.2402), and (E) SPL (CON: n = 8, SUS: n = 12, RES: n = 11, F (2, 28) = 3.254, P = 0.0536). Percentages of Tfh in (F) cLN (CON: n = 16, SUS: n = 28, RES: n = 20, F (2, 61) = 10.69, P = 0.0001), (G) mLN (CON: n = 11, SUS: n = 18, RES: n = 13, F (2, 39) = 8.767, P = 0.0007), and (H) SPL (CON: n = 7, SUS: n = 13, RES: n = 10, F (2, 27) = 1.524, P = 0.2360). Percentages of PC in (I) cLN (CON: n = 11, SUS: n = 14, RES: n = 12, F (2, 34) = 5.562, P = 0.0081), (J) mLN (CON: n = 11, SUS: n = 19, RES: n = 12, F (2, 39) = 10.60, P = 0.0002), and (K) SPL (CON: n = 5, SUS: n = 8, RES: n = 6, F (2, 16) = 11.24, P = 0.0009). (L–N) Correlation between SI ratio and percentages of (L) GCB (CON: n = 16, SUS: n = 27, RES: n = 20, r = −0.2616, P = 0.0383), (M) Tfh (CON: n = 16, SUS: n = 28, RES: n = 20, r = −0.3561, P = 0.0039), and (N) PC (CON: n = 11, SUS: n = 14, RES: n = 12, r = −0.5359, P = 0.0006) in cLN. Data represented as mean ± SEM were analyzed by one-way ANOVA with Bonferroni post hoc test (*P < 0.05, **P < 0.01, ***P < 0.001). Correlations were evaluated by Pearson correlation analysis. The P value threshold adjusted to P < 0.016 (L, M, and N).
Fig. 3.
Fig. 3.
Increase in brain-reactive antibodies in sera from SUS mice and humans with high anhedonia. (A) Experimental outline: Schematic of detection of brain lysate-reactive IgG antibodies in sera from CON, SUS, and RES mice by ELISA. (B) Quantification of brain lysate-reactive IgG antibodies in sera (CON: n = 7, SUS: n = 11, RES: n = 10, F (2, 25) = 5.123, P = 0.0137). (C) Correlation between brain lysate-reactive IgG antibodies in sera and SI ratio (CON: n = 7, SUS: n = 11, RES: n = 10, r = −0.5056, P = 0.0061). (D) Experimental outline: Schematic of detection of brain section-reactive IgG antibodies in sera by indirect immunofluorescence. (E) Staining of brain sections around the NAc from immune-deficient Rag2−/− mice with sera from CON, SUS, and RES mice (green: IgG, blue: DAPI, Scale bar: 50 μm). (F) Quantification of fluorescence intensity (CON: n = 7, SUS: n = 11, RES: n = 10, F (2, 25) = 6.849, P = 0.0042). (G) Correlation between fluorescence intensity of brain sections stained with sera and levels of brain lysate-reactive serum IgG antibodies (CON: n = 7, SUS: n = 11, RES: n = 10, r = 0.6290, P = 0.0003). Data represented as mean ± SEM were analyzed by one-way ANOVA with Bonferroni post hoc test (*P < 0.05, **P < 0.01). Correlations were evaluated by Pearson correlation analysis. The P value threshold adjusted to P < 0.025 (C and G). (H) Experimental outline: Schematic of detection of brain lysate-reactive IgG antibodies in sera from HC and patients with MDD by ELISA. (I) Correlation between levels of brain lysate-reactive IgG antibodies in sera and the TEPS anticipatory (HC: n = 19, MDD: n = 28, 1r = −0.336, 1P = 0.026). The P value threshold adjusted to P < 0.0125 (I). 1The partial correlation was calculated to control for the potential confounding variables of age, gender, and body mass index (BMI).
Fig. 4.
Fig. 4.
Accumulation of IgG antibodies in the brain of SUS mice. (A) Experimental outline: Schematic of the analysis of IgG antibodies in the brain by ELISA and IHC. (B) Quantification of IgG antibody concentrations in brain lysates from CON, SUS, and RES mice (CON: n = 11, SUS: n = 17, RES: n = 12, F (2, 37) = 6.686, P = 0.0033). (C) Correlation between SI ratio and brain IgG antibody concentrations (CON: n = 11, SUS: n = 17, RES: n = 12, r = −0.5832, P < 0.0001). (D–F) Correlations between brain IgG antibody concentrations and percentages of (D) GCB (CON: n = 5, SUS: n = 7, RES: n = 6, r = 0.8638, P < 0.0001), (E) Tfh (CON: n = 5, SUS: n = 7, RES: n = 6, r = 0.8111, P < 0.0001), and (F) PC (CON: n = 5, SUS: n = 7, RES: n = 6, r = 0.9087, P < 0.0001) in cLN. (G) Detection of IgG antibodies in brain sections around NAc from CON, SUS, and RES mice (green: IgG, magenta: GFAP, red: CD31, blue: DAPI, Scale bar: 25 μm). (H and I) 3D reconstructed images of a brain section from a SUS mouse showing IgG staining colocalized with brain vascular cell markers [green: IgG, magenta: GFAP, red: CD31, blue: DAPI, Scale bar: (H) 30 μm, (I) 5 μm]. The area inside the white frame in H is shown in I. Data represented as mean ± SEM were analyzed by one-way ANOVA with Bonferroni post hoc test (**P < 0.01). Correlations were evaluated by Pearson correlation analysis. The P value threshold adjusted to P < 0.016 (D, E, and F).
Fig. 5.
Fig. 5.
Contribution of B cells to depression-like behavior in the CSDS model. (A) Experimental outline: B cell depletion followed by CSDS, SI test and FCM. (B) Representative FCM plots of lymphocytes from cLN at day 18. (C) Analysis of B cell depletion efficiency (Control IgG: n = 28, Anti-CD20: n = 24, t (50) = 15.04, P < 0.0001). (D) Representative heatmaps of mouse behavior during the SI test. (E) Effects of B cell depletion on SI ratio in the CSDS model (Control IgG: n = 40, Anti-CD20: n = 37, t (75) = 2.066, P = 0.0423). Data represented as mean ± SEM were analyzed by unpaired t test (*P < 0.05, ****P < 0.0001).

References

    1. Malhi G. S., Mann J. J., Depression. Lancet 392, 2299–2312 (2018). - PubMed
    1. Otte C., et al. , Major depressive disorder. Nat. Rev. Dis. Primers 2, 16065 (2016). - PubMed
    1. Rush A. J., et al. , Acute and longer-term outcomes in depressed outpatients requiring one or several treatment steps: A STAR*D report. Am. J. Psychiatry. 163, 1905–1917 (2006). - PubMed
    1. Gaynes B. N., et al. , What did STAR*D teach us? Results from a large-scale, practical, clinical trial for patients with depression. Psychiatr. Serv. 60, 1439–1445 (2009). - PubMed
    1. Hodes G. E., Kana V., Menard C., Merad M., Russo S. J., Neuroimmune mechanisms of depression. Nat. Neurosci. 18, 1386–1393 (2015). - PMC - PubMed

Substances

LinkOut - more resources