. 2023 Nov 27;7(2):e202302369.
doi: 10.26508/lsa.202302369. Print 2024 Feb.

PARP-1 is a transcriptional rheostat of metabolic and bivalent genes during development

Affiliations

PARP-1 is a transcriptional rheostat of metabolic and bivalent genes during development

Gbolahan Bamgbose et al. Life Sci Alliance. .

Abstract

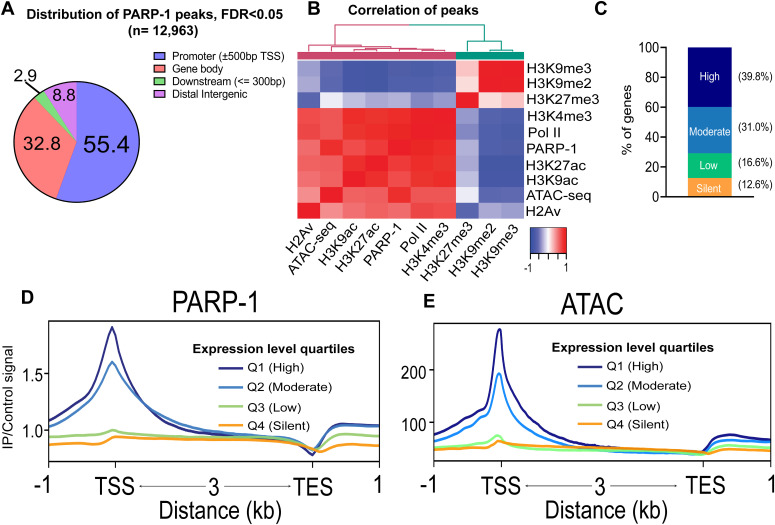
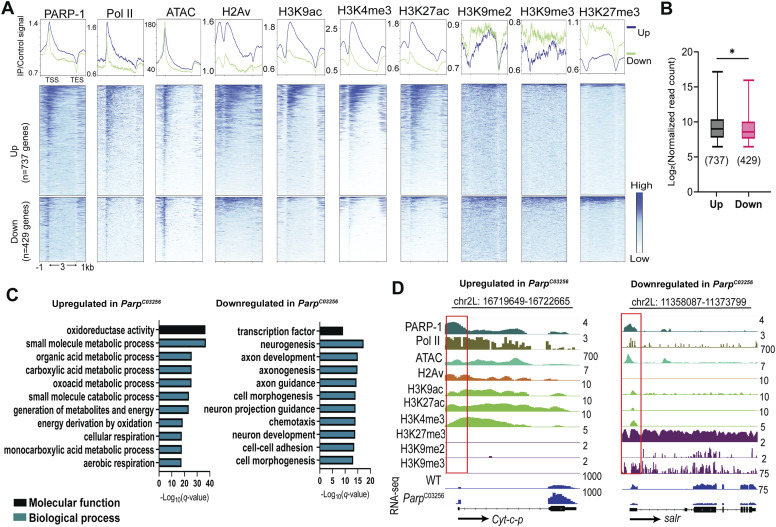
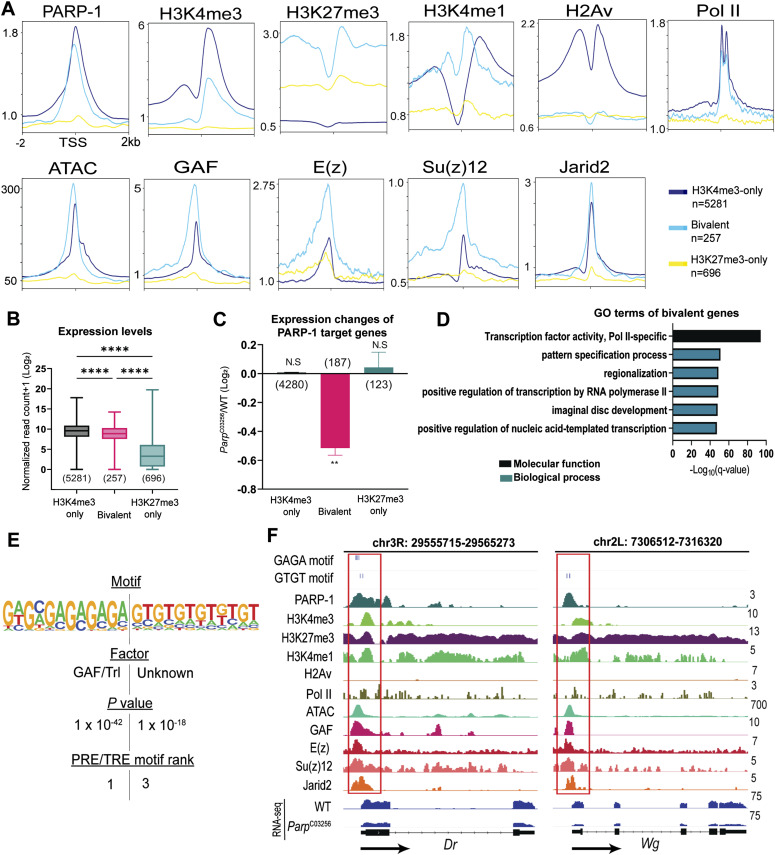
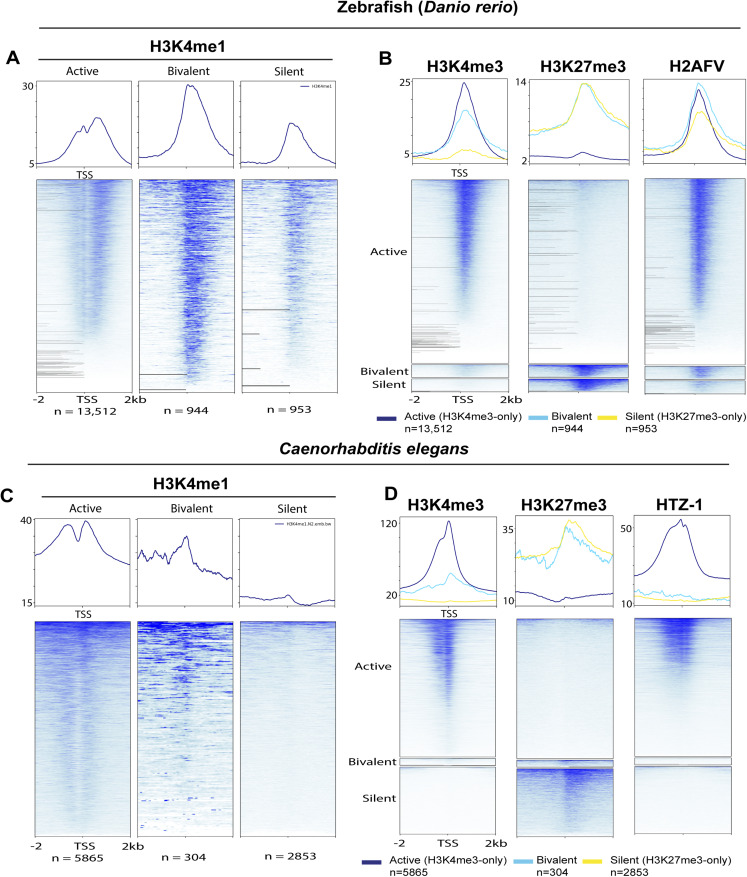
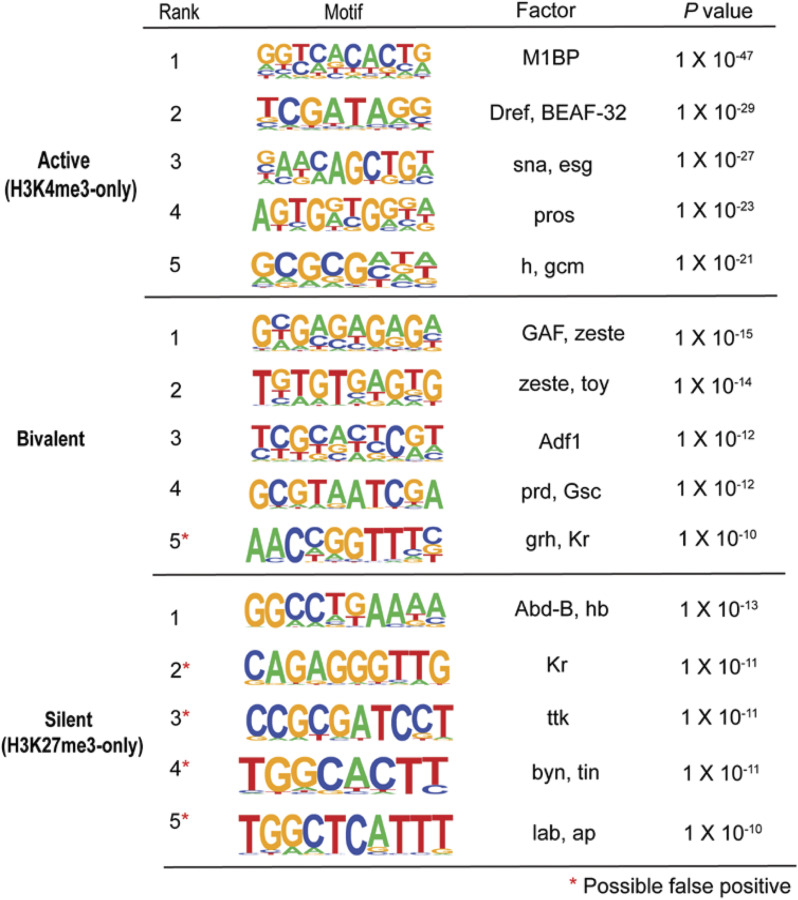
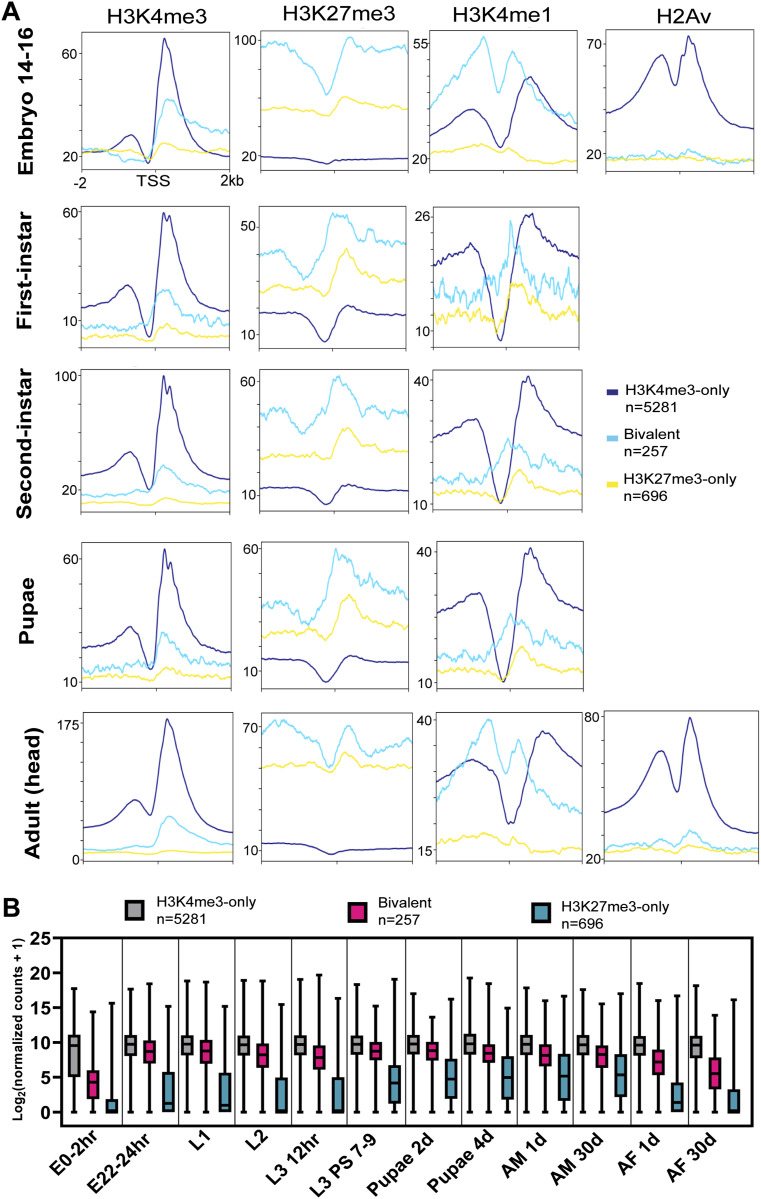
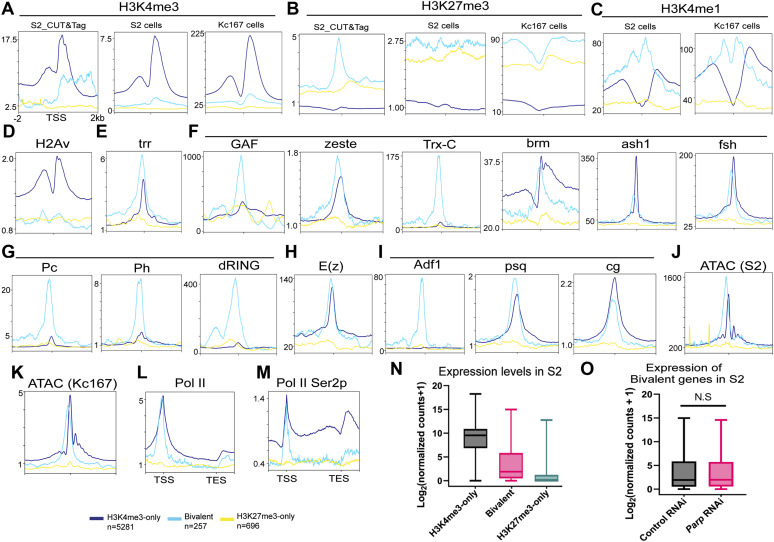
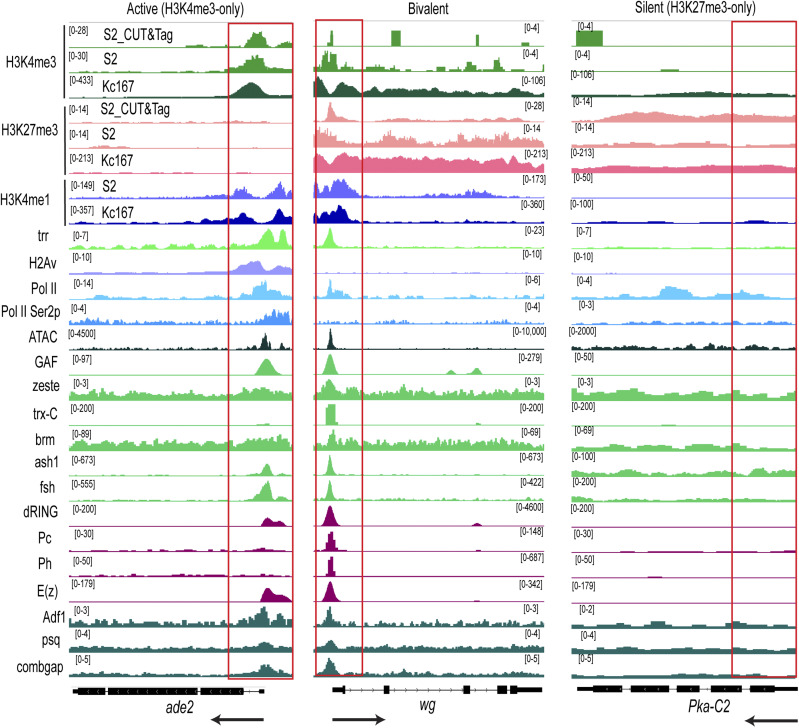
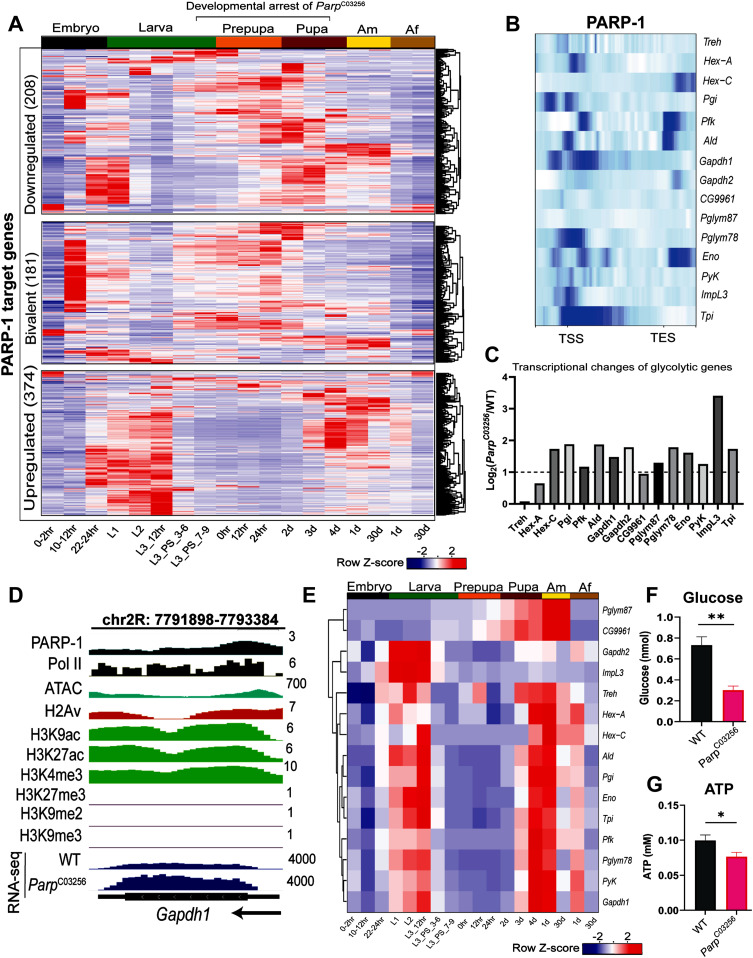
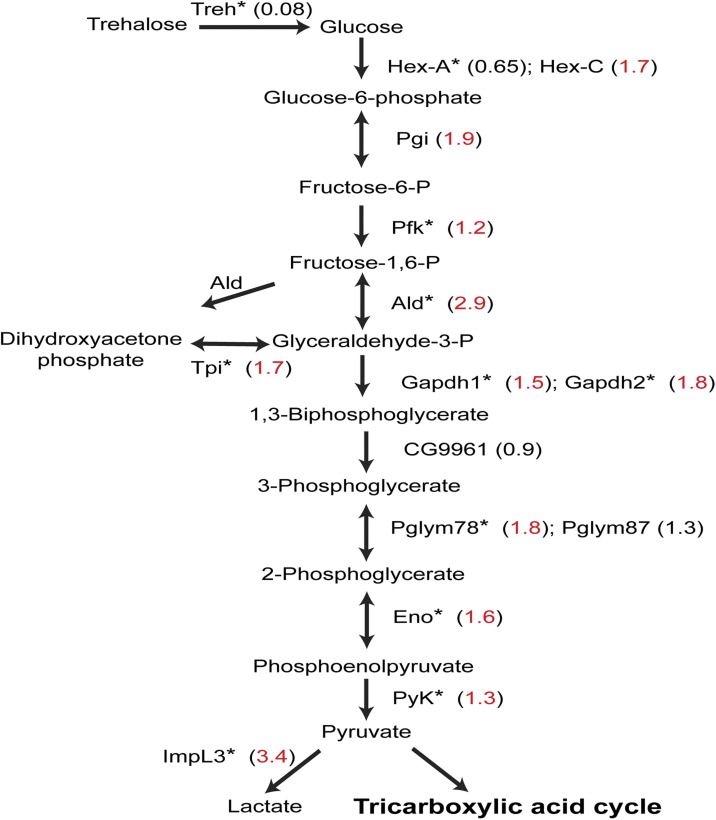
PARP-1 participates in various cellular processes, including gene regulation. In Drosophila, PARP-1 mutants undergo developmental arrest during larval-to-pupal transition. In this study, we investigated PARP-1 binding and its transcriptional regulatory role at this stage. Our findings revealed that PARP-1 binds and represses active metabolic genes, including glycolytic genes, whereas activating low-expression developmental genes, including a subset of "bivalent" genes in third-instar larvae. These bivalent promoters, characterized by dual enrichment of low H3K4me3 and high H3K27me3, a unimodal H3K4me1 enrichment at the transcription start site (conserved in C. elegans and zebrafish), H2Av depletion, and high accessibility, may persist throughout development. In PARP-1 mutant third-instar larvae, metabolic genes typically down-regulated during the larval-to-pupal transition in response to reduced energy needs were repressed by PARP-1. Simultaneously, developmental and bivalent genes typically active at this stage were activated by PARP-1. In addition, glucose and ATP levels were significantly reduced in PARP-1 mutants, suggesting an imbalance in metabolic regulation. We propose that PARP-1 is essential for maintaining the delicate balance between metabolic and developmental gene expression programs to ensure proper developmental progression.


Conflict of interest statement

The authors declare that they have no conflict of interest.

Figures

Figure 1.
Figure 1.. PARP-1 predominantly occupies the promoters of highly expressed genes.
(A) Pie chart showing the percentage of PARP-1 ChIP-seq peaks in Drosophila third-instar larvae across genomic features. (B) Heatmap showing spearman correlation of peaks from ChIP-seq overlaps in third-instar larvae. (C) Percentage distribution of gene expression levels for genes overlapping PARP-1 peaks and the nearest genes closest to PARP-1 peaks. Genes were categorized by expression levels based on steady-state mRNA expression quartiles (High = 75–100%, Moderate = 50–75%, Low = 25–50%, Silent = 0–25%) in WT third-instar larvae, as determined by RNA-seq analysis. (D, E) Metagene plots of normalized PARP-1 ChIP-seq signals and ATAC-seq signals at Drosophila genes stratified by steady-state mRNA expression quartiles in WT third-instar larvae. The graph shows PARP-1 and ATAC-seq signals in third-instar larvae at the regions extending from −1 kb of the transcription start site to +1 kb of the transcription end site.
Figure S1.
Figure S1.. Reproducibility of PARP-1 and control ChIP-seq replicates.
(A) Spearman correlation of ChIP-seq reads. (B) PCA plots of ChIP-seq reads. Three biological replicates per group.
Figure 2.
Figure 2.. Highly enriched PARP-1 represses metabolic genes and activates developmental genes.
(A) Heatmaps showing enrichment of normalized PARP-1, Pol II, H2Av, H3K9ac, H3K4me3, H3K27ac, H3K9me2, H3K9me3, H3K27me3 ChIP-seq signals, and ATAC-seq signals in WT third-instar larvae at active genes that were differentially expressed in ParpC03256 (up-regulated = 737, down-regulated = 429) third instar larvae and highly occupied by PARP-1. Upper plots show the summary of signals (metagene plot). The graph shows ChIP-seq and ATAC-seq signals in third-instar larvae at the regions extending from −1 kb of the TSS to +1 kb of the TES. (B) Expression levels in WT third-instar larvae of active differentially expressed genes in ParpC03256 third-instar larvae that are highly occupied by PARP-1. *P < 0.05 (Mann–Whitney test; two-tailed). (C) Gene ontology of genes that were highly occupied by PARP-1 and differentially expressed in ParpC03256 third-instar larvae. (D) IGV (Integrative Genomics Viewer) tracks of normalized PARP-1, Pol II, H2Av, H3K9ac, H3K27ac, H3K4me3, H3K27me3, H3K27me3, H3K9me2, H3K9me3 ChIP-seq, WT ATAC-Seq signals, and RNA-seq signals of WT and ParpC03256 third-instar larvae in the indicated genes, Cyt-c-p and salr, which were highly occupied by PARP-1, and up-regulated and down-regulated in ParpC03256 third-instar larvae, respectively. Black arrow indicates the direction of transcription. Red boxes highlight promoters.
Figure S2.
Figure S2.. PARP-1 differentially regulates gene expression based on gene length and function.
Histogram showing PARP-1 preferentially represses short genes, which are primarily involved in housekeeping functions, while preferentially activating longer genes that are typically associated with developmental processes. Displayed genes have high PARP-1 occupancy and exhibit differential expression in ParpC03256 third-instar larvae, with 737 up-regulated genes, 429 down-regulated genes, and a random selection of 737 unchanged genes.
Figure 3.
Figure 3.. PARP-1 activates occupied bivalent genes.
(A) Metagene plots showing enrichment of normalized PARP-1, H3K4me3, H3K27me3, H3K4me1, H2Av, Pol II, GAF, E(z), Su(z)12, Jarid2 ChIP-seq signals, and ATAC-seq signals in third-instar larvae at active (H3K4me3-only), bivalent and silent (H3K27me3-only) promoters. ChIP-seq and ATAC-seq signals in third-instar larvae are shown for regions ±2 kb from the TSS. (B) Expression levels of active, bivalent, and silent genes in WT third-instar larvae. ****P < 0.0001 (Kruskal–Wallis test). Box plot: dashed center line, median; box-plot limits, upper and lower quartiles; whiskers, minimum and maximum values. (C) Expression changes of PARP-1-targeted active, bivalent, and silent genes (ParpC03256 versus WT) in third-instar larvae. **P < 0.01. (D) Gene ontology of 257 bivalent genes showing their top molecular function and enriched biological processes. (E) HOMER analysis of PARP-1 binding motifs at bivalent promoters. PRE/TRE motif ranks were culled from Ringrose et al (2003). (F) IGV tracks of PARP-1, H3K4me3, H3K4me1, H2Av, Pol II, GAF, E(z), Su(z)12, Jarid2 ChIP-seq, ATAC-Seq signals in third-instar larvae, and RNA-seq signals of WT and ParpC03256 third-instar larvae in the indicated bivalent genes, Dr and Wg, showing enrichment of PRE/TRE motifs. Black arrows indicate the direction of transcription. Red boxes highlight promoters.
Figure S3.
Figure S3.. Unimodal H3K4me1 enrichment demarcates bivalent genes in zebrafish sperm and C. elegans embryo.
(A, B) Metagene plots showing distribution of (A) H3K4me1, (B) H3K4me3, H3K27me3, and H2AFV at active, bivalent, and silent promoters in zebrafish sperm. (C, D) Metagene plots showing distribution of (C) H3K4me1, (D) H3K4me3, H3K27me3, and HTZ-1 at active, bivalent, and silent promoters in C. elegans embryos. The upper plots show summary of the signals. ChIP-seq signals are shown for regions ±2 kb from the TSS.
Figure S4.
Figure S4.. Bivalent promoters are enriched with PRE/TRE motifs.
De novo motif analysis of active (H3K4me3-only), bivalent, and silent genes (H3K27me3-only promoters) (HOMER). Top 5 most significantly enriched motifs are shown for each group. Red asterisks represent motifs that may be false positives.
Figure 4.
Figure 4.. Bivalency is maintained across all stages of Drosophila development.
(A) Metagene plots showing the enrichment of (A) H3K4me3, H3K27me3, H3K4me1, and H2Av ChIP-seq signals active, bivalent, and silent gene promoters identified in WT third-instar larvae, during various Drosophila developmental stages. ChIP-seq signals are shown for regions ±2 kb from the TSS. (B) Box plot showing the expression levels of active, bivalent, and silent genes identified in third-instar larvae at different Drosophila developmental stages. Box plot: dashed center line, median; box-plot limits, upper and lower quartiles; whiskers, minimum and maximum values.
Figure 5.
Figure 5.. Characterization of bivalency in Drosophila cells.
Metagene plots showing enrichment of histone modifications, chromatin regulators, and transcription factors in S2 or Kc167 cells at the promoters of active, bivalent, and silent genes identified in third-instar larvae. (A, B, C, D, E, F, G, H, I, J, K, L, M) Enrichment patterns for (A) H3K4me3, (B) H3K27me3, (C) H3K4me1, (D) H2Av, trithorax group proteins: (E) trr, (F) GAF, zeste, Trx-C (C-terminal), brm, ash1, fsh, polycomb repressive complex 1: (G) Pc, Ph, dRING, polycomb repressive complex 2: (H) E(z), PRE/TRE binders, and polycomb regulators: (I) Adf1, psq, cg, (J) ATAC signals in S2 cells, (K) ATAC signals in Kc167 cells, (L) Pol II, and (M) Pol II Ser2p in S2R+. CUT&Tag, ChIP-seq, and ATAC-seq signals are shown for regions ±2 kb from the TSS. (N) Pol II CUT&Tag and Pol II Ser2p ChIP-seq signals are shown for the regions extending from −1 kb of the TSS to +1 kb of the TES (N) boxplot showing the expression levels of active, bivalent, and silent genes in Drosophila S2 cells treated with control RNAi. (O) Box plot showing the expression levels of bivalent genes identified in third-instar larvae in S2 cells treated with control RNAi or Parp RNAi (Two biological replicates). Box plot: dashed center line, median; box plot limits, upper and lower quartiles; whiskers, minimum and maximum values.
Figure S5.
Figure S5.. IGV tracks showing CUT&Tag and ChIP-seq signal of histone modifications, chromatin regulators, and transcription factors in S2 or Kc167 cells at representative active, bivalent and silent genes identified in third-instar larvae.
Enrichment patterns for H3K4me3, H3K27me3, H3K4me1, H2Av, trithorax group proteins: trr, GAF, zeste, Trx-C (C-terminal), brm, ash1, fsh, polycomb repressive complex 1: Pc, Ph, dRING, polycomb repressive complex 2: E(z), PRE/TRE binders, and polycomb regulators: Adf1, psq, cg, ATAC signals in S2 cells, Pol II, and Pol II Ser2p in S2R + at the indicated genes, ade2 (active), wg (bivalent), and Pka-C2 (silent). Black arrows indicate the direction of transcription. Red boxes highlight promoters.
Figure 6.
Figure 6.. PARP-1 balances metabolic and developmental gene expression during the larval-to-pupal transition.
(A) Heatmap showing a temporal profile of the expression of occupied PARP-1-regulated genes (bivalent, and genes that were up-regulated or down-regulated genes in ParpC03256 third-instar larvae) in WT animals during Drosophila development. Expression levels are represented as row z-scores based on normalized read counts. (B) Heatmap showing PARP-1 binding at the promoters of glycolytic genes. PARP-1 ChIP-seq signals in third-instar larvae at the regions extending from −1 kb of the TSS to +1 kb TES are shown. (C) Expression changes of glycolytic genes (ParpC03256 versus WT) in third-instar larvae. Log2 fold changes from DESeq2 analysis are shown. Dashed line indicates a Log2 fold change of 1 (twofold change). (D) IGV tracks showing normalized PARP-1, H2Av, H3K9ac, H3K27ac, H3K4me3, H3K27me3, H3K9me2, H3K9me3 ChIP-seq signals, ATAC-seq signals in third-instar larvae, and RNA-seq signals in WT and ParpC03256 third-instar larvae at the indicated gene, Gapdh1. Black arrow indicates the direction of transcription. (E) Heatmap showing a temporal profile of the expression of glycolytic genes in WT animals during Drosophila development. Expression levels are represented as row z-scores based on normalized read counts. (F, G) Quantification of glucose (three biological replicates) and (G) ATP levels (five biological replicates) in WT and ParpC03256 in third instar larvae. **P < 0.01, *P < 0.05 (unpaired t test; two-tailed).
Figure S6.
Figure S6.. PARP-1 modulates the glycolytic pathway by repressing gene expression.
A schematic representation of the glycolytic pathway highlights differentially expressed genes in ParpC03256 third-instar larvae. Numbers in brackets indicate the log2 fold change between ParpC03256 and WT (red: significant, black: not significant). Asterisks (*) indicate PARP-1 occupancy at the promoter of the gene (PARP-1-targeted) encoding the respective enzyme in third-instar larvae.

References

    1. Akmammedov A, Geigges M, Paro R (2019) Bivalency in Drosophila embryos is associated with strong inducibility of Polycomb target genes. Fly (Austin) 13: 42–50. 10.1080/19336934.2019.1619438 - DOI - PMC - PubMed
    1. Arbeitman MN, Furlong EEM, Imam F, Johnson E, Null BH, Baker BS, Krasnow MA, Scott MP, Davis RW, White KP (2002) Gene expression during the life cycle of Drosophila melanogaster. Science 297: 2270–2275. 10.1126/SCIENCE.1072152 - DOI - PubMed
    1. Artavanis-Tsakonas S (2004) Accessing the Exelixis collection. Nat Genet 36: 207. 10.1038/NG1316 - DOI - PubMed
    1. Azuara V, Perry P, Sauer S, Spivakov M, Jørgensen HF, John RM, Gouti M, Casanova M, Warnes G, Merkenschlager M, et al. (2006) Chromatin signatures of pluripotent cell lines. Nat Cell Biol 8: 532–538. 10.1038/NCB1403 - DOI - PubMed
    1. Bae S, Lesch BJ (2020) H3K4me1 distribution predicts transcription state and poising at promoters. Front Cell Dev Biol 8: 289. 10.3389/fcell.2020.00289 - DOI - PMC - PubMed

Publication types

MeSH terms

Substances