. 2023 Dec 15;19(3):2281733.
doi: 10.1080/21645515.2023.2281733. Epub 2023 Nov 27.

Delineation of DNA and mRNA COVID-19 vaccine-induced immune responses in preclinical animal models

Affiliations

Delineation of DNA and mRNA COVID-19 vaccine-induced immune responses in preclinical animal models

Viviane M Andrade et al. Hum Vaccin Immunother. .

Abstract

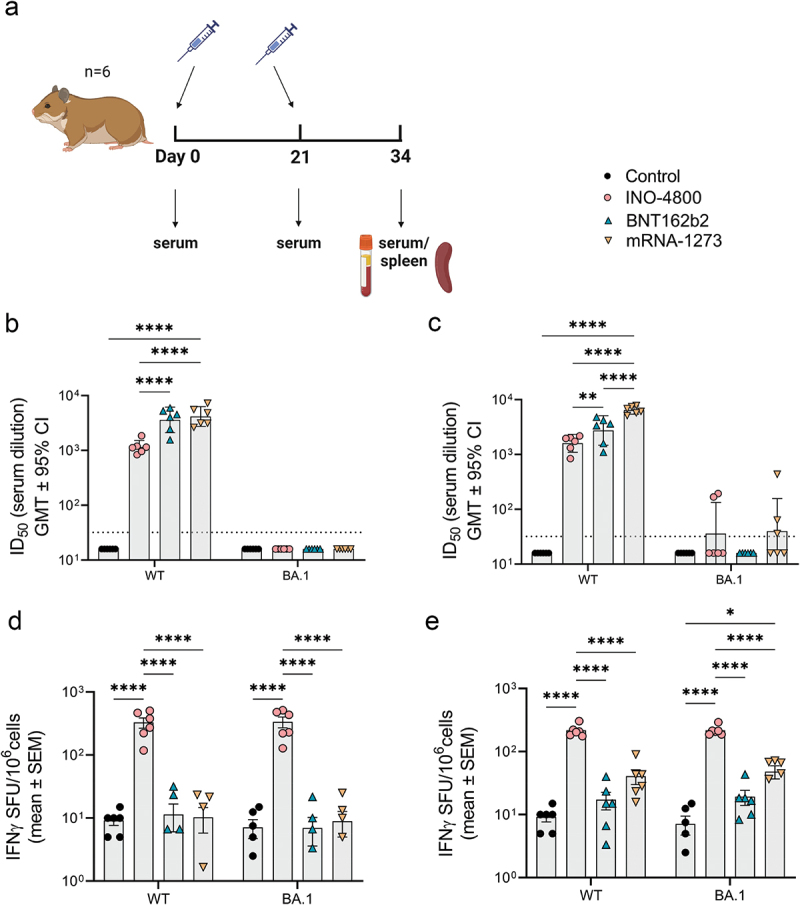
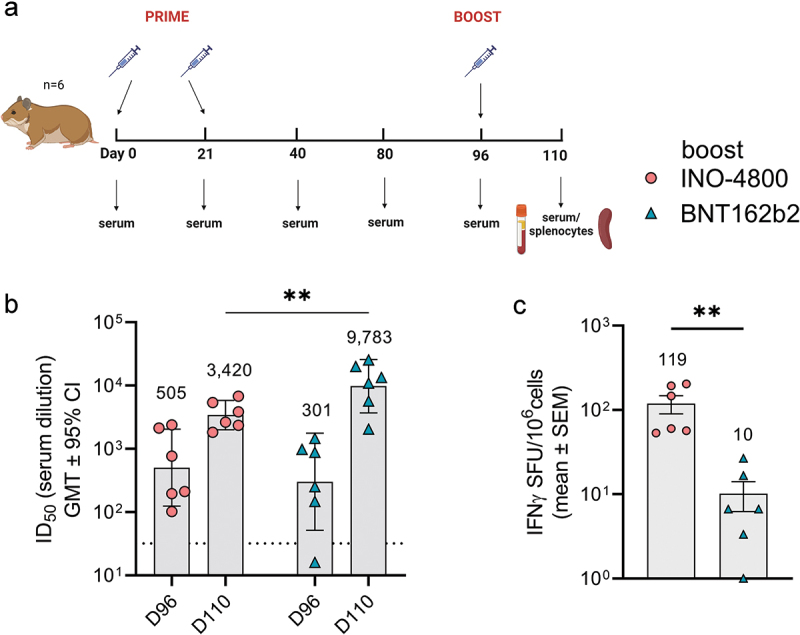
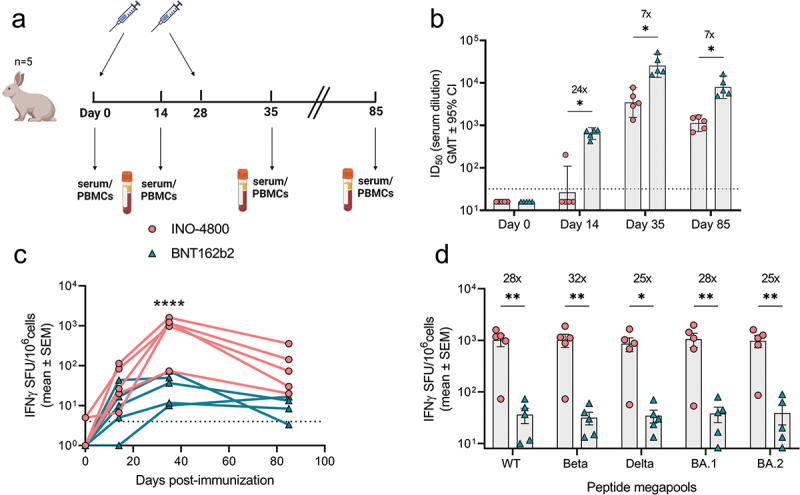
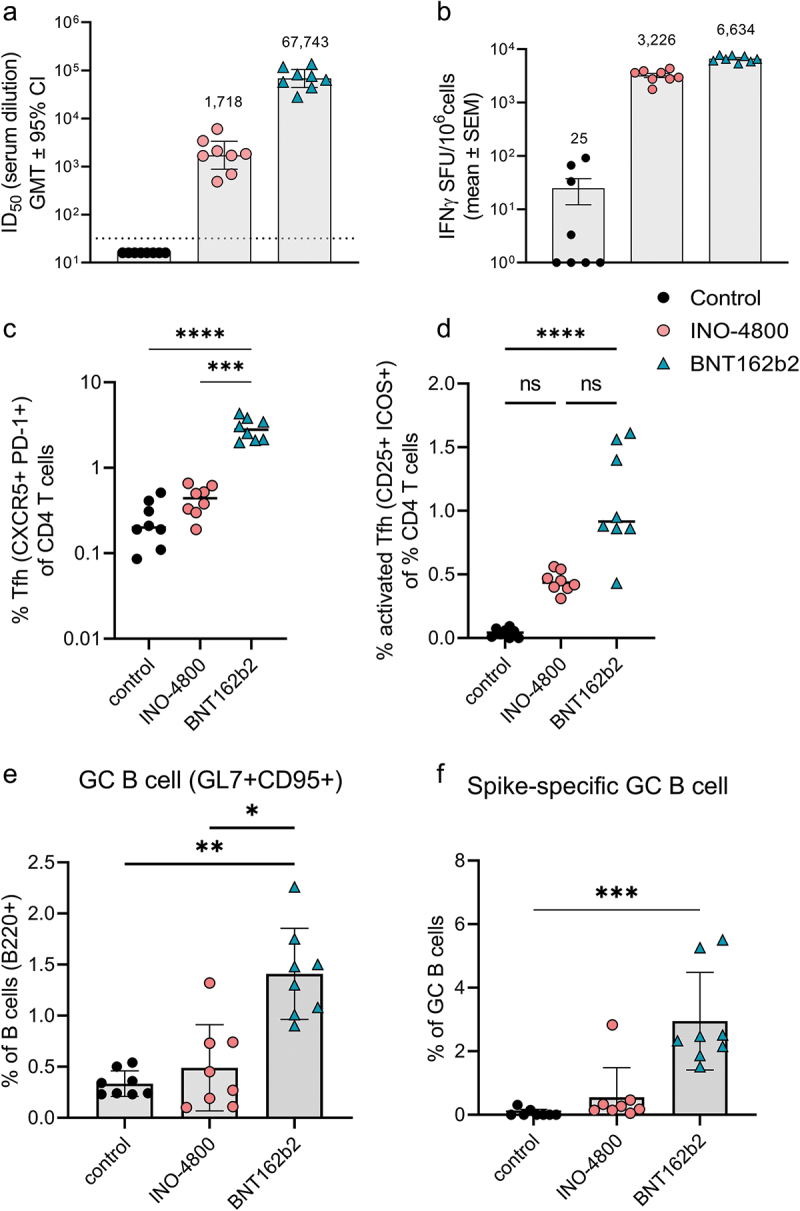
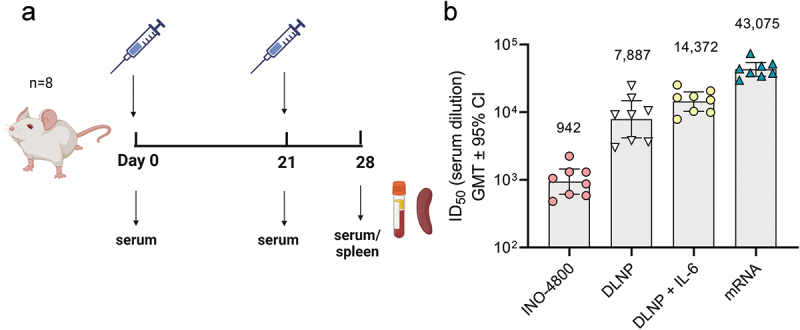
Nucleic acid vaccines are designed based on genetic sequences (DNA or mRNA) of a target antigen to be expressed in vivo to drive a host immune response. In response to the COVID-19 pandemic, mRNA and DNA vaccines based on the SARS-CoV-2 Spike antigen were developed. Surprisingly, head-to-head characterizations of the immune responses elicited by each vaccine type has not been performed to date. Here, we have employed a range of preclinical animal models including the hamster, guinea pig, rabbit, and mouse to compare and delineate the immune response raised by DNA, administered intradermally (ID) with electroporation (EP) and mRNA vaccines (BNT162b2 or mRNA-1273), administered intramuscularly (IM), expressing the SARS-CoV-2 WT spike antigen. The results revealed clear differences in the quality and magnitude of the immune response between the two vaccine platforms. The DNA vaccine immune response was characterized by strong T cell responses, while the mRNA vaccine elicited robust humoral responses. The results may assist in guiding the disease target each vaccine type may be best matched against and suggest mechanisms to further enhance the breadth of each platform's immune response.

Keywords: COVID-19; DNA vaccines; SARS-CoV-2; animal models; immunogenicity; mRNA vaccines.


Conflict of interest statement

VMA, IM, RK, LJ, OB, LH, and TRFS are employees of and may hold stock options in Inovio Pharmaceuticals., Inc. DWK is the recipient of research funding from Inovio Pharmaceuticals, Inc.

Figures

Figure 1.
Figure 1.
Characterization of the immune response in Syrian golden hamsters after a primary series of mRNA and DNA vaccination delivered at different sites. (a) Study schematic and dosing schedule in Syrian golden hamster. (b-c) Neutralizing activity (ID50 values) against the WT and BA.1 pseudoviruses are shown (ID delivery, b and IM delivery, c). Each data point represents the mean of technical duplicates for each animal (n = 6). Dashed lines represent the limit of detection (LOD) of the assay. Samples below LOD were plotted at the number equivalent to half of the lowest serum dilution. Data shown represent ID50 (GMT ± 95% CI) for each group of six hamsters. (d-e) Splenocyte cellular responses to WT and BA.1 spike peptide megapools measured by IFNγ ELISpot assay (ID delivery, e and IM delivery, f). Data shown represent IFNγ spots per one million cells of experimental triplicates (mean ± SEM) after DMSO subtraction. ****P ≤ .0001, **P = .0021, *P = .033 (2-way ANOVA, tukey’s multiple comparison).
Figure 2.
Figure 2.
Heterologous and homologous boost of mRNA vaccinated hamsters. (a) Study schematic and dosing schedule in Syrian golden hamsters. (b) Neutralizing activity (ID50 values) against the WT pseudovirus pre-boost (day 96) and post-boost (day 110) are shown. Each data point represents the mean of technical duplicates for each animal (n = 6). Dashed lines represent the limit of detection (LOD) of the assay. Samples below LOD were plotted at the number equivalent to half of the lowest serum dilution. Data shown represent mean ID50 (GMT ± 95% CI) for each group of six hamsters. GMT numbers are plotted above bars for reference. **P < .001. 2-way ANOVA, Sidak’s multiple comparison. (c) Splenocyte cellular responses to WT spike peptide megapool on day 110 measured by IFNγ ELISpot assay. Data shown represent IFNγ spots per one million cells of experimental triplicates (mean ± SEM) after DMSO subtraction. *P < .05 student t-test, Mann Whitney.
Figure 3.
Figure 3.
Characterization of the immune response in New Zealand rabbits after a primary series of mRNA and DNA clinically relevant doses. (a) Study schematic and dosing schedule in New Zealand rabbits. (b) Neutralizing activity (ID50 values) against the WT pseudovirus for sera samples from Day 0, Day 14 and Day 35 are shown. Dashed lines represent the limit of detection (LOD) of the assay. Samples below LOD were plotted at the number equivalent to half of the lowest serum dilution. Data shown represent mean ID50 (GMT ± 95% CI) for each group of six rabbits. Numbers above bars represent GMT values and fold-change between treatments. (c-d) PBMC cellular responses to WT spike peptide megapool on (c) days 0, 14, 35 and 85 or (d) responses to WT, Beta, Delta, BA.1 and BA.2 variant spike megapools at Day 35 measured by IFNγ ELISpot assay. Numbers above bars represent fold-change between treatments for each variant. Data shown represent IFNγ spots per one million cells of experimental triplicates (mean ± SEM) after DMSO subtraction. (b-d) ****P < .0001, **P < .01, *P ≤ .05 (2-way ANOVA, sidak’s multiple comparison).
Figure 4.
Figure 4.
Cellular and humoral mechanisms involved in mRNA and DNA vaccination in C57BL6 mice. (a) Neutralizing activity (ID50 values) against the WT pseudovirus for sera samples from day 28 are shown. Dashed line represents the limit of detection (LOD) of the assay. Samples below LOD were plotted at the number equivalent to half of the lowest serum dilution. Bars represent mean ID50 (GMT ± 95% CI) for each group of eight mice. Numbers above bars represent the GMT. (b) Splenocyte cellular responses to WT spike peptide megapool at day 28, measured by IFNγ ELISpot assay. Bars represent the mean ± SEM of experimental triplicates shown as IFNγ spots per million cells after DMSO subtraction. Frequency of (c) Tfh, (d) activated Tfh, (e) GC B and (f) spike-specific GC B cells from spleens of vaccinated mice on day 28 is shown. To assess frequency of Tfh cells and activated Tfh and CD4 T cells, splenocytes were stained with CD4, CD3, CXCR5, PD-1, live-dead; CD25, and ICOS antibodies. To assess frequency of GC B and spike-specific GC B cells, splenocytes were stained with live-dead staining, biotinylated spike-tetramers, CD3, B220, GL7 and CD95 antibodies for a flow cytometric analysis. ****P < .0001, ***P < .001, **P < .01, *P ≤ .05 (Kruskal Wallis test).
Figure 5.
Figure 5.
Evaluation of humoral immune response enhancements in BALB/c mice. (a) Study schematic and dosing regimen in BALB/c. (b) Neutralizing activity (ID50 values) against the WT pseudovirus for sera samples from day 28 are shown. Data shown represent mean ID50 (GMT ± 95% CI) for each group of eight mice. GMT values are plotted above bars for reference.

Similar articles

Cited by

References

    1. Wolff JA, Malone RW, Williams P, Chong W, Acsadi G, Jani A.. Direct gene transfer into mouse muscle in vivo. Science. 1990;247(4949 Pt 1):1465–12. doi:10.1126/science.1690918. - DOI - PubMed
    1. Ulmer JB. Heterologous protection against influenza by injection of DNA encoding a viral protein. Science. 1993;259(5102):1745–9. doi:10.1126/science.8456302. - DOI - PubMed
    1. Wang B, Ugen KE, Srikantan V, Agadjanyan MG, Dang K, Refaeli Y, Sato AI, Boyer J, Williams WV, Weiner DB, et al. Gene inoculation generates immune responses against human immunodeficiency virus type 1. Proc Natl Acad Sci USA. 1993;90(9):4156–60. doi:10.1073/pnas.90.9.4156. - DOI - PMC - PubMed
    1. Aihara H, Miyazaki J. Gene transfer into muscle by electroporation in vivo. Nat Biotechnol. 1998;16(9):867–70. doi:10.1038/nbt0998-867. - DOI - PubMed
    1. Felgner PL, Felgner PL, Gadek TR, Holm M, Roman R., Chan HW, Wenz M, Northrop JP, Ringold GM, Danielsen M. Lipofection: a highly efficient, lipid-mediated DNA-transfection procedure. Proc Natl Acad Sci USA. 1987;84(21):7413–7. doi:10.1073/pnas.84.21.7413. - DOI - PMC - PubMed

Publication types